| Param | Original file | Final file |
|---|---|---|
| Filename | modeM0/AS1A04_141T01_9000001848_12427cztM0_level2.evt | modeM0/AS1A04_141T01_9000001848_12427cztM0_level2_quad_clean.evt |
| Size (bytes) | 1,446,053,760 | 222,240,960 |
| Size | 1.3 GB | 211.9 MB |
| Events in quadrant A | 11,762,623 | 1,403,678 |
| Events in quadrant B | 10,160,070 | 1,393,807 |
| Events in quadrant C | 7,856,087 | 1,415,516 |
| Events in quadrant D | 12,818,212 | 1,294,934 |
| Mode M9 | |||
|---|---|---|---|
| Quadrant | BADHDUFLAG | Total packets | Discarded packets |
| A | 0 | 19 | 0 |
| B | 0 | 19 | 0 |
| C | 0 | 19 | 0 |
| D | 0 | 19 | 0 |
| Mode M0 | |||
|---|---|---|---|
| Quadrant | BADHDUFLAG | Total packets | Discarded packets |
| A | 0 | 46880 | 4 |
| B | 0 | 41911 | 3 |
| C | 0 | 36149 | 3 |
| D | 0 | 50453 | 3 |
| Mode SS | |||
|---|---|---|---|
| Quadrant | BADHDUFLAG | Total packets | Discarded packets |
| A | 0 | 362 | 0 |
| B | 0 | 362 | 0 |
| C | 0 | 362 | 0 |
| D | 0 | 362 | 0 |
| Quadrant | Total seconds | Saturated seconds | Saturation percentage |
|---|---|---|---|
| A | 17730 | 525 | 2.961083% |
| B | 17730 | 760 | 4.286520% |
| C | 17730 | 57 | 0.321489% |
| D | 17730 | 1136 | 6.407219% |
Noise dominated data is calculated using 1-second bins in cleaned event files. If a bin has >2000 counts, and if more than 50% of those come from <1% of pixels, then it is considered to be noise-dominated and hence unusable.
| Quadrant | # 1 sec bins | Bins with >0 counts | Bins with >2000 counts | High rate bins dominated by noise | Noise dominated (total time) | Noise dominated (detector-on time) | Marked lightcurve |
|---|---|---|---|---|---|---|---|
| A | 19766 | 17731 | 314 | 314 | 1.59% | 1.77% | 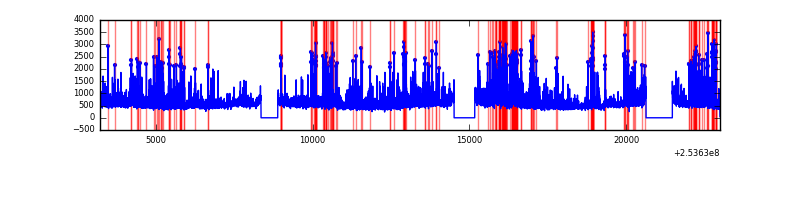 |
| B | 19766 | 17731 | 511 | 511 | 2.59% | 2.88% | 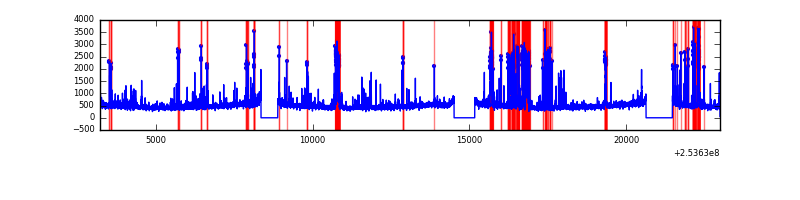 |
| C | 19766 | 17733 | 7 | 7 | 0.04% | 0.04% |  |
| D | 19766 | 17734 | 1310 | 1310 | 6.63% | 7.39% | 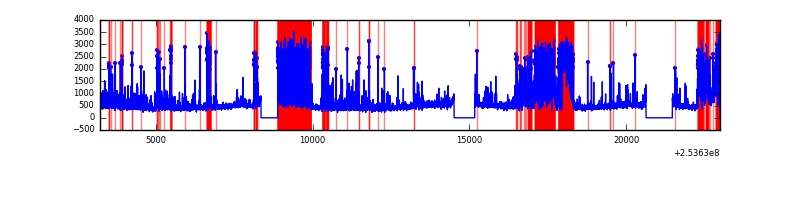 |
Top three noisy pixels from each quadrant. If the there are fewer than three noisy pixels in the level2.evt file, extra rows are filled as -1
| Pixel properties | Quadrant properties | ||||||
|---|---|---|---|---|---|---|---|
| Quadrant | DetID | PixID | Counts | Sigma | Mean | Median | Sigma |
| A | 13 | 251 | 2850197 | 6905.04 | 2036 | 1994 | 412.5 |
| A | 1 | 162 | 246685 | 593.22 | 2036 | 1994 | 412.5 |
| A | 8 | 15 | 208249 | 500.03 | 2036 | 1994 | 412.5 |
| B | 4 | 239 | 1766702 | 4595.02 | 2021 | 1972 | 384.1 |
| B | 3 | 64 | 245953 | 635.28 | 2021 | 1972 | 384.1 |
| B | 0 | 218 | 68378 | 172.91 | 2021 | 1972 | 384.1 |
| C | 15 | 208 | 90497 | 191.59 | 1988 | 1993 | 461.9 |
| C | 13 | 61 | 14649 | 27.4 | 1988 | 1993 | 461.9 |
| C | 8 | 128 | 8338 | 13.74 | 1988 | 1993 | 461.9 |
| D | 1 | 52 | 4891457 | 10565.47 | 1928 | 1873 | 462.8 |
| D | 14 | 34 | 219282 | 469.78 | 1928 | 1873 | 462.8 |
| D | 8 | 195 | 126920 | 270.2 | 1928 | 1873 | 462.8 |
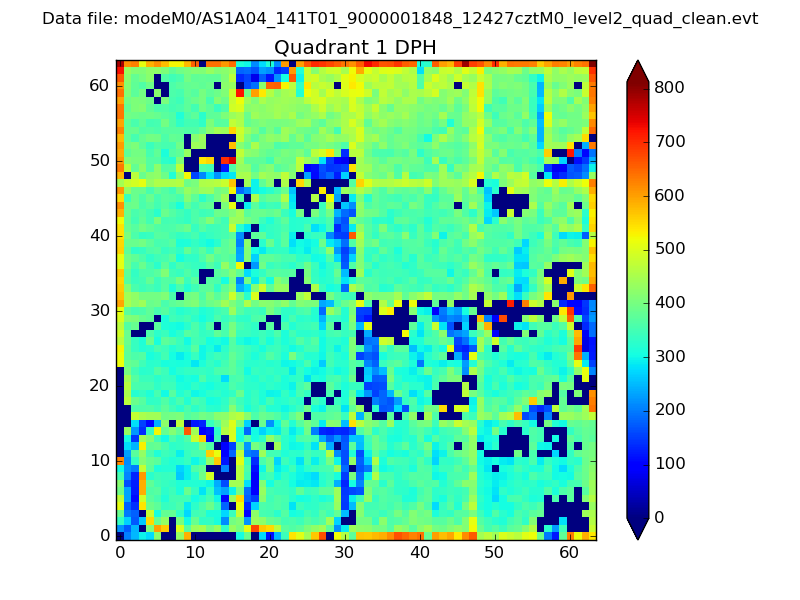
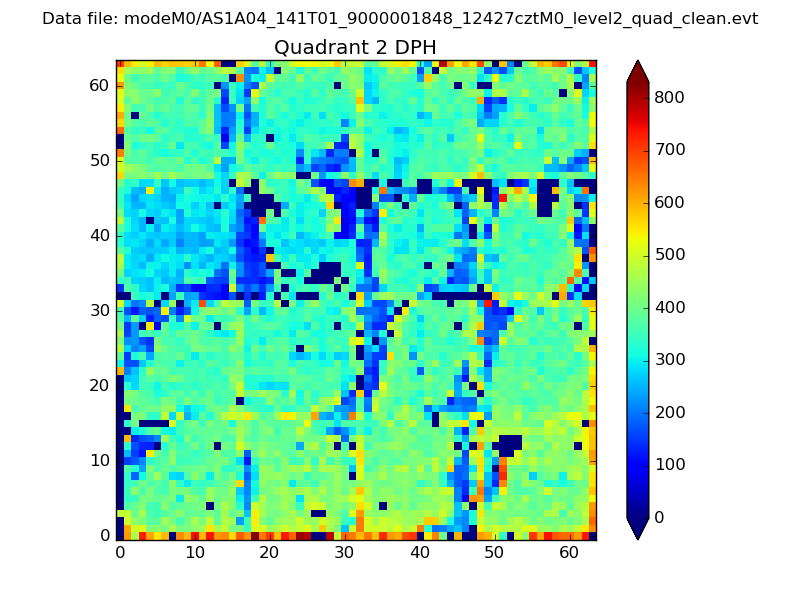
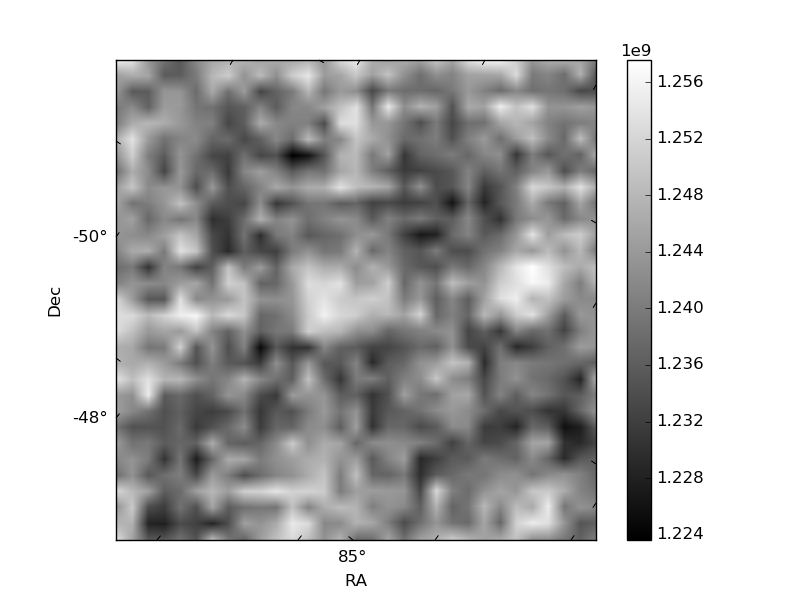
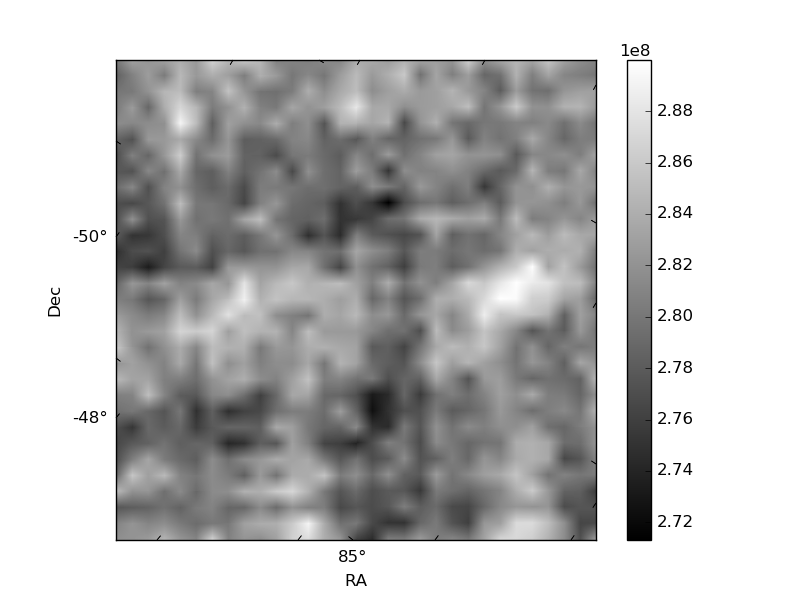
Histogram calculated using DETX and DETY for each event in the final _common_clean file
| Quadrant A | 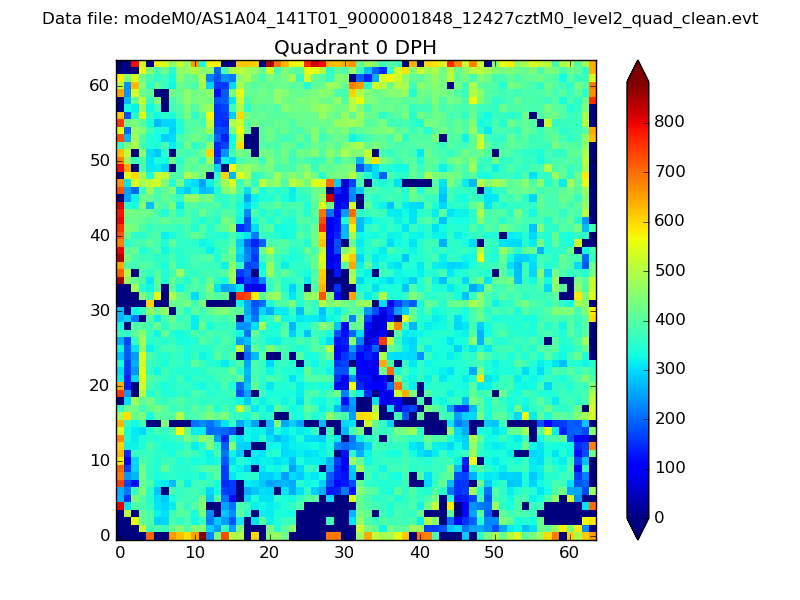 |
 |
Quadrant B |
|---|---|---|---|
| Quadrant D | 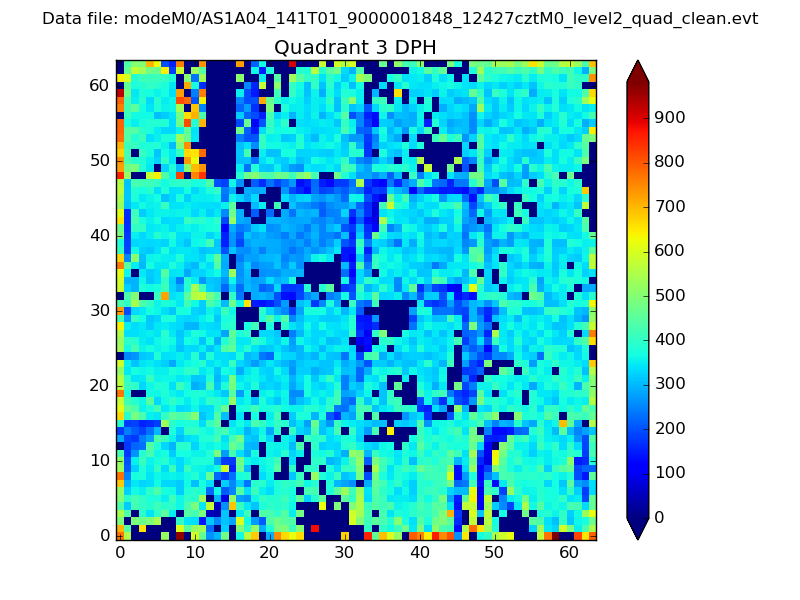 |
 |
Quadrant C |
| Plot type | Count rate plots | Images |
|---|---|---|
| Comparison with Poisson distribution Blue bars denote a histogram of data divided into 1 sec bins. Red curve is a Poisson curve with rate = median count rate of data. |
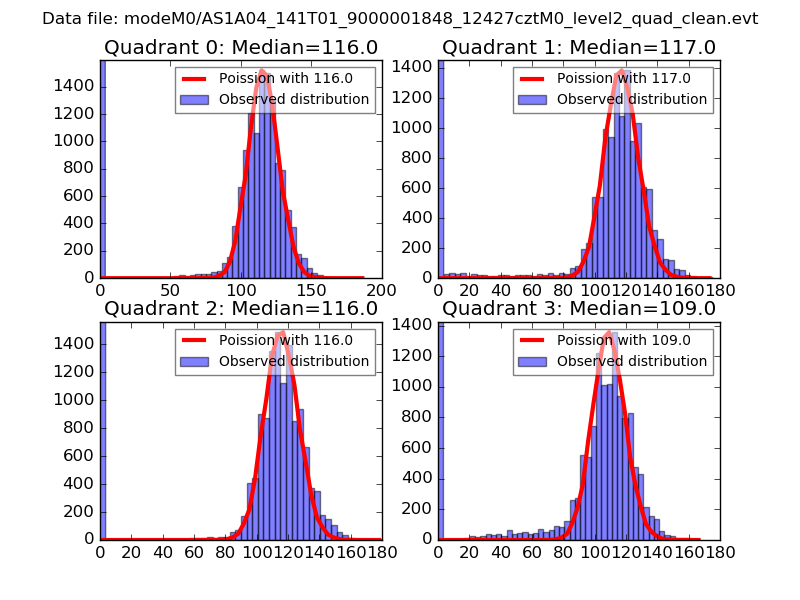 |
 |
| Quadrant-wise count rates Data is divided into 100 sec bins |
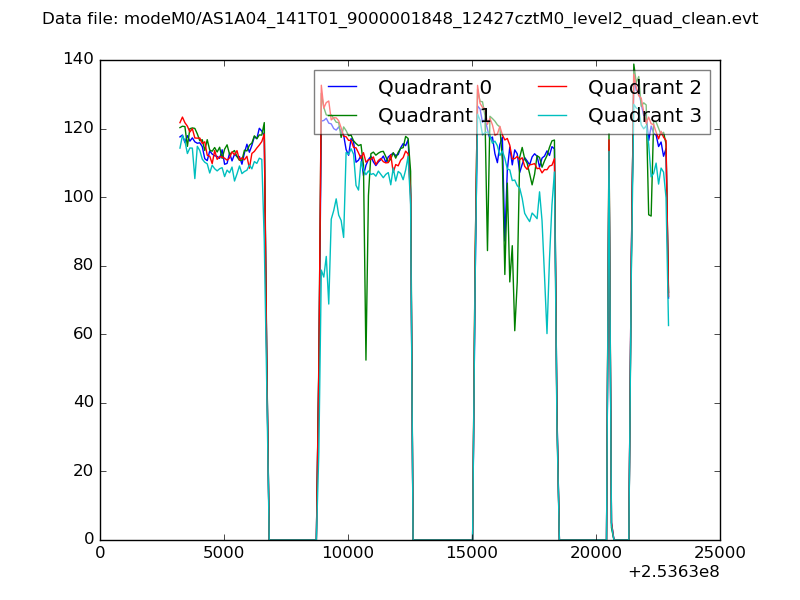 |
|
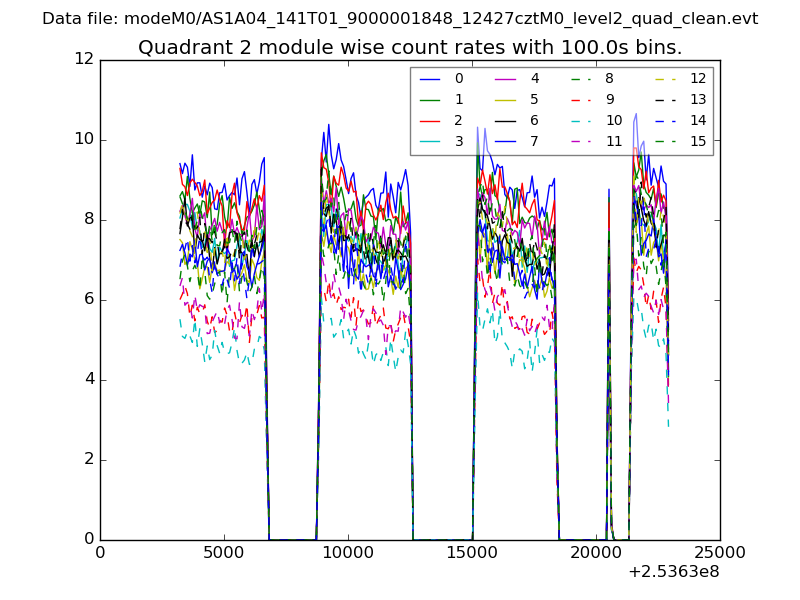
| Module-wise count rates for Quadrant A Data is divided into 100 sec bins |
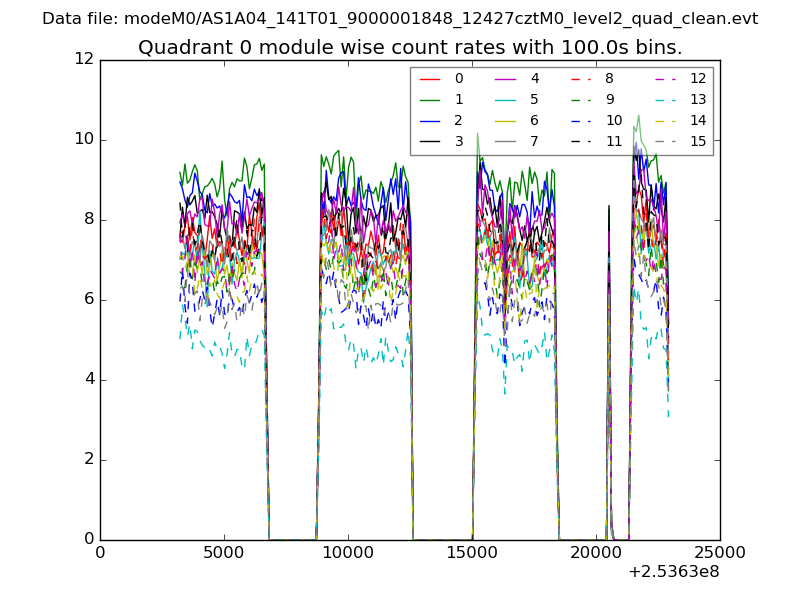 |
 |
| Module-wise count rates for Quadrant B Data is divided into 100 sec bins |
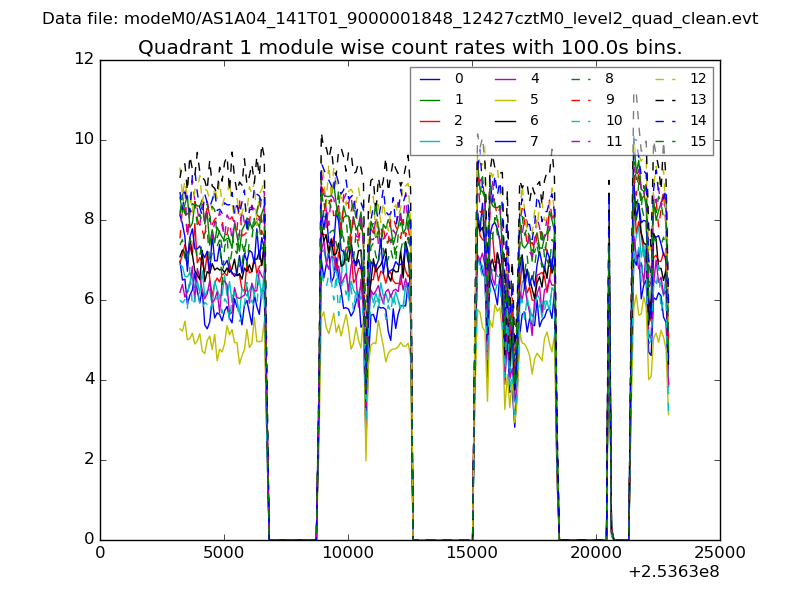 |
 |
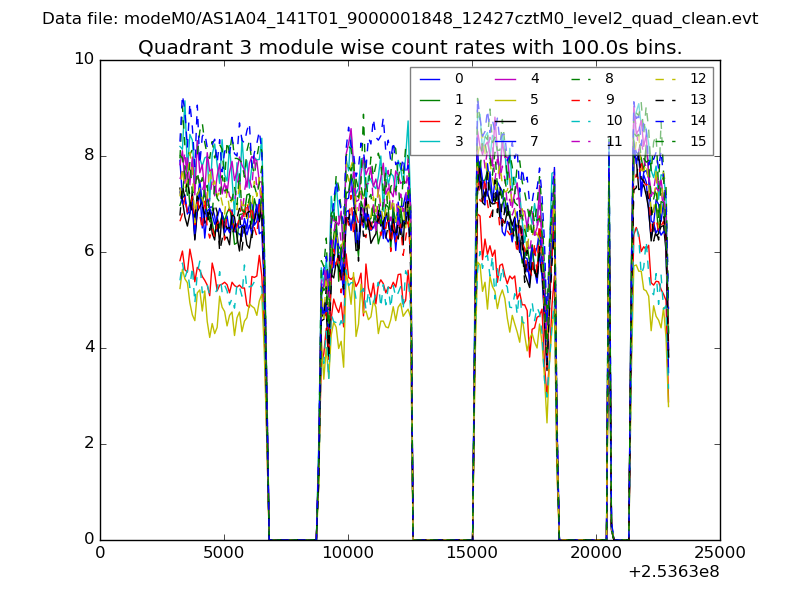
| Module-wise count rates for Quadrant C Data is divided into 100 sec bins |
 |
 |
| Module-wise count rates for Quadrant D Data is divided into 100 sec bins |
 |
 |
| Parameter | Plot |
|---|---|
| CZT HV Monitor | 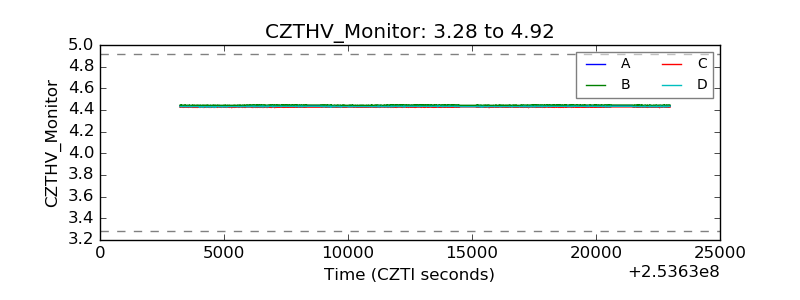 |
| D_VDD | 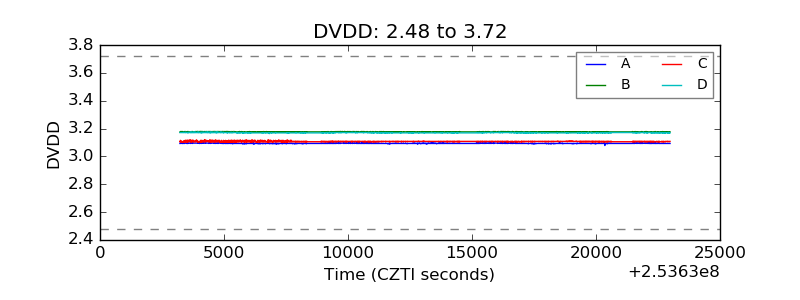 |
| Temperature 1 | 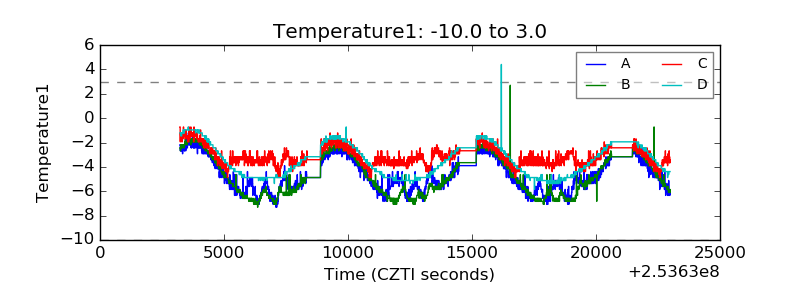 |
| Veto HV Monitor | 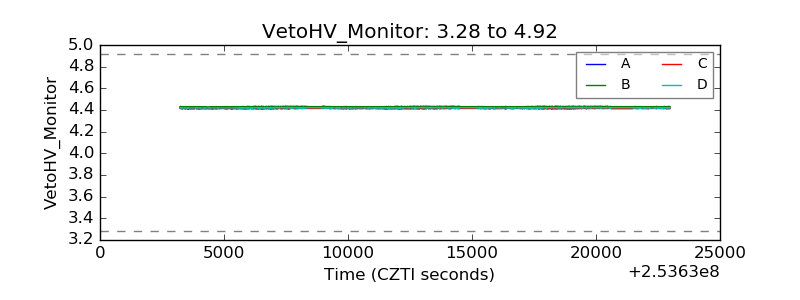 |
| Veto LLD | 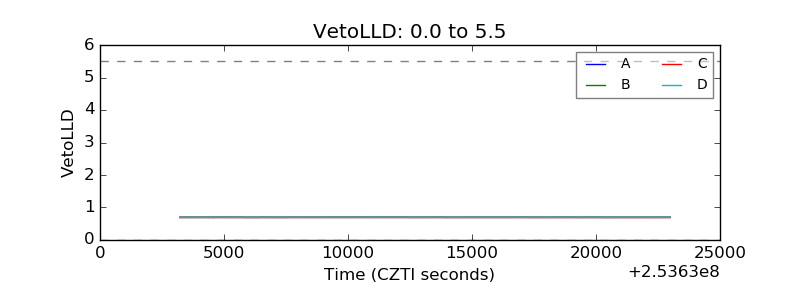 |
| Alpha Counter | 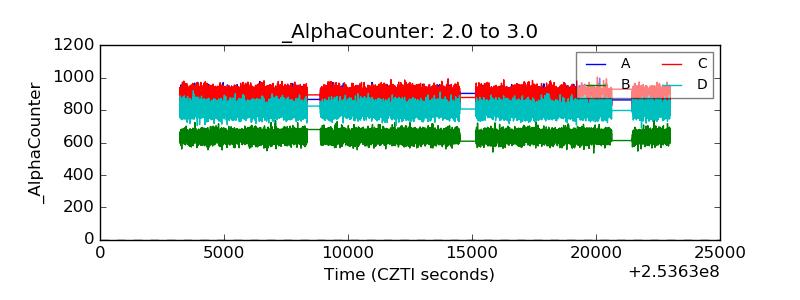 |
| _CPM_Rate | 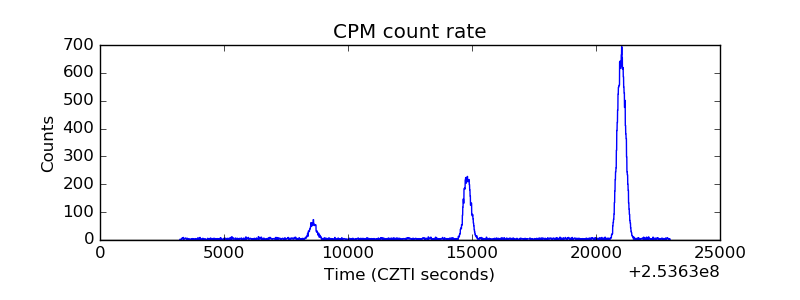 |
| CZT Counter | 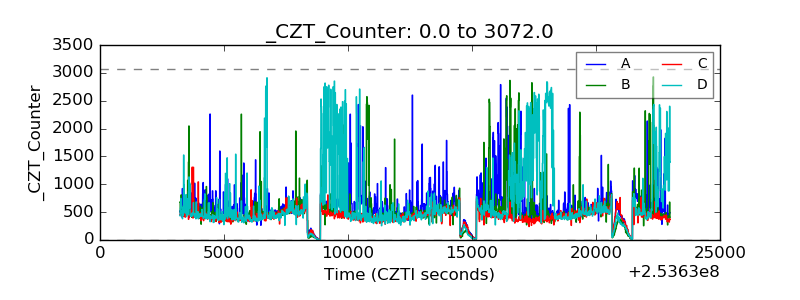 |
| +2.5 Volts monitor |  |
| +5 Volts monitor |  |
| _ROLL_ROT | 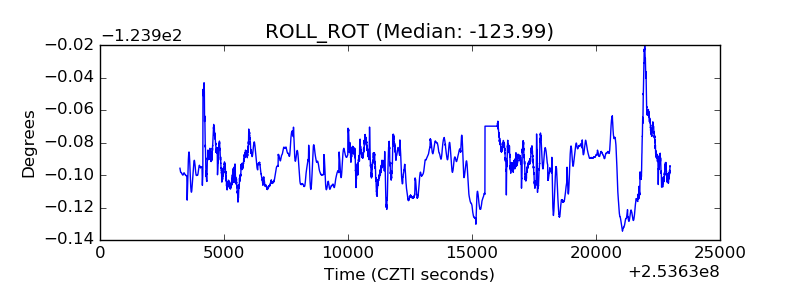 |
| _Roll_DEC | 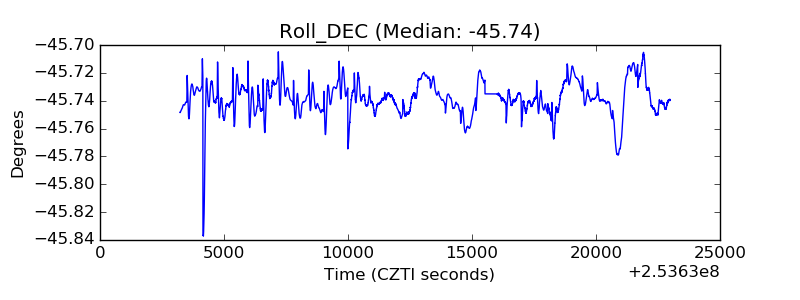 |
| _Roll_RA | 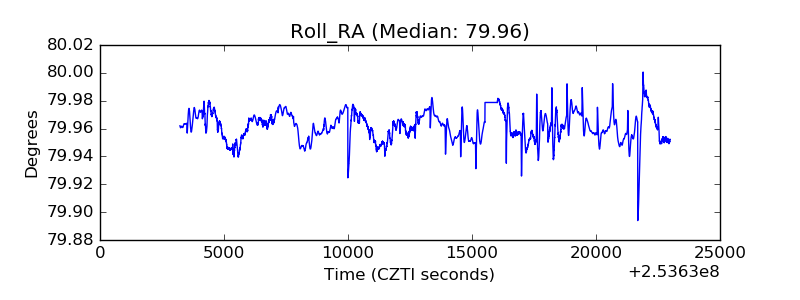 |
| Veto Counter | 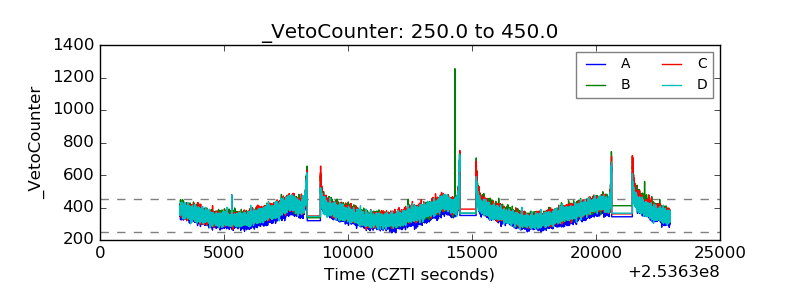 |