| Param | Original file | Final file |
|---|---|---|
| Filename | modeM0/AS1A04_141T01_9000001848_12428cztM0_level2.evt | modeM0/AS1A04_141T01_9000001848_12428cztM0_level2_quad_clean.evt |
| Size (bytes) | 580,504,320 | 87,246,720 |
| Size | 553.6 MB | 83.2 MB |
| Events in quadrant A | 4,771,937 | 553,759 |
| Events in quadrant B | 3,796,580 | 555,433 |
| Events in quadrant C | 2,923,975 | 559,800 |
| Events in quadrant D | 5,641,006 | 512,260 |
| Mode M9 | |||
|---|---|---|---|
| Quadrant | BADHDUFLAG | Total packets | Discarded packets |
| A | 0 | 14 | 0 |
| B | 0 | 14 | 0 |
| C | 0 | 14 | 0 |
| D | 0 | 15 | 0 |
| Mode M0 | |||
|---|---|---|---|
| Quadrant | BADHDUFLAG | Total packets | Discarded packets |
| A | 0 | 18718 | 3 |
| B | 0 | 15614 | 2 |
| C | 0 | 13390 | 2 |
| D | 0 | 21306 | 2 |
| Mode SS | |||
|---|---|---|---|
| Quadrant | BADHDUFLAG | Total packets | Discarded packets |
| A | 0 | 134 | 0 |
| B | 0 | 134 | 0 |
| C | 0 | 134 | 0 |
| D | 0 | 134 | 0 |
| Quadrant | Total seconds | Saturated seconds | Saturation percentage |
|---|---|---|---|
| A | 6604 | 248 | 3.755300% |
| B | 6604 | 223 | 3.376741% |
| C | 6604 | 9 | 0.136281% |
| D | 6604 | 302 | 4.572986% |
Noise dominated data is calculated using 1-second bins in cleaned event files. If a bin has >2000 counts, and if more than 50% of those come from <1% of pixels, then it is considered to be noise-dominated and hence unusable.
| Quadrant | # 1 sec bins | Bins with >0 counts | Bins with >2000 counts | High rate bins dominated by noise | Noise dominated (total time) | Noise dominated (detector-on time) | Marked lightcurve |
|---|---|---|---|---|---|---|---|
| A | 7600 | 6605 | 167 | 167 | 2.20% | 2.53% | 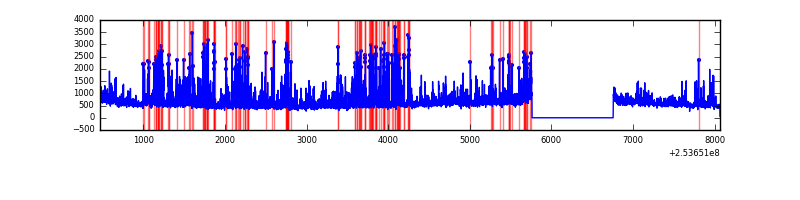 |
| B | 7600 | 6605 | 160 | 160 | 2.11% | 2.42% | 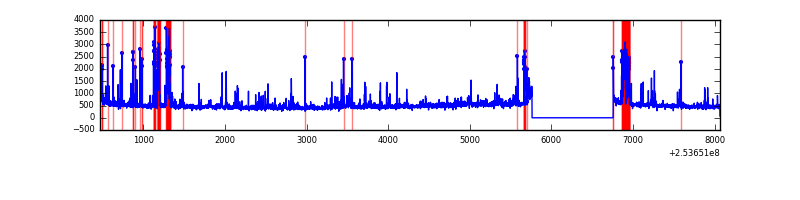 |
| C | 7600 | 6606 | 0 | 0 | 0.00% | 0.00% | 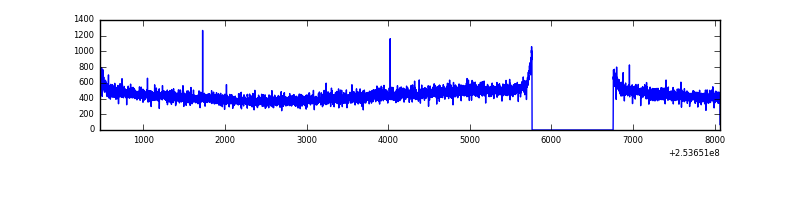 |
| D | 7600 | 6605 | 398 | 398 | 5.24% | 6.03% | 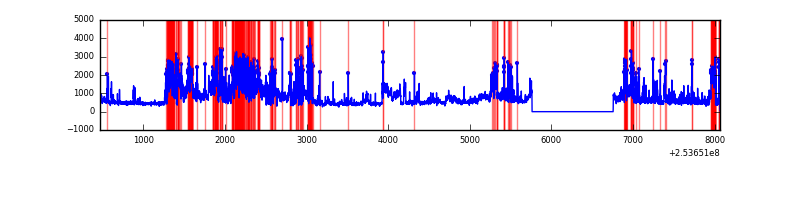 |
Top three noisy pixels from each quadrant. If the there are fewer than three noisy pixels in the level2.evt file, extra rows are filled as -1
| Pixel properties | Quadrant properties | ||||||
|---|---|---|---|---|---|---|---|
| Quadrant | DetID | PixID | Counts | Sigma | Mean | Median | Sigma |
| A | 13 | 251 | 1476543 | 9421.74 | 766 | 750 | 156.6 |
| A | 1 | 162 | 104194 | 660.41 | 766 | 750 | 156.6 |
| A | 12 | 189 | 52768 | 332.09 | 766 | 750 | 156.6 |
| B | 4 | 239 | 567523 | 3862.25 | 767 | 748 | 146.7 |
| B | 3 | 64 | 125735 | 851.72 | 767 | 748 | 146.7 |
| B | 0 | 187 | 44438 | 297.72 | 767 | 748 | 146.7 |
| C | 13 | 61 | 5531 | 27.37 | 748 | 752 | 174.6 |
| C | 12 | 4 | 2932 | 12.49 | 748 | 752 | 174.6 |
| C | 14 | 234 | 2320 | 8.98 | 748 | 752 | 174.6 |
| D | 1 | 52 | 2648867 | 14910.49 | 730 | 708 | 177.6 |
| D | 14 | 34 | 65031 | 362.17 | 730 | 708 | 177.6 |
| D | 8 | 195 | 48544 | 269.34 | 730 | 708 | 177.6 |
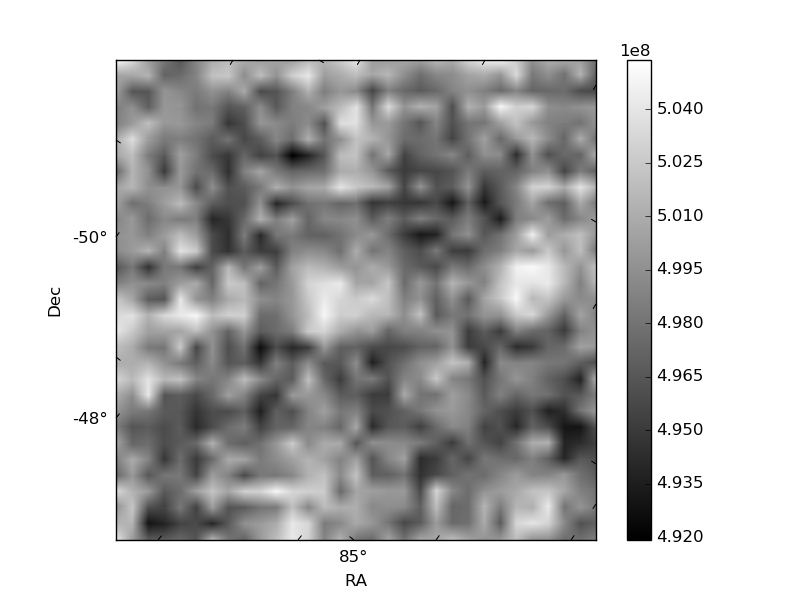
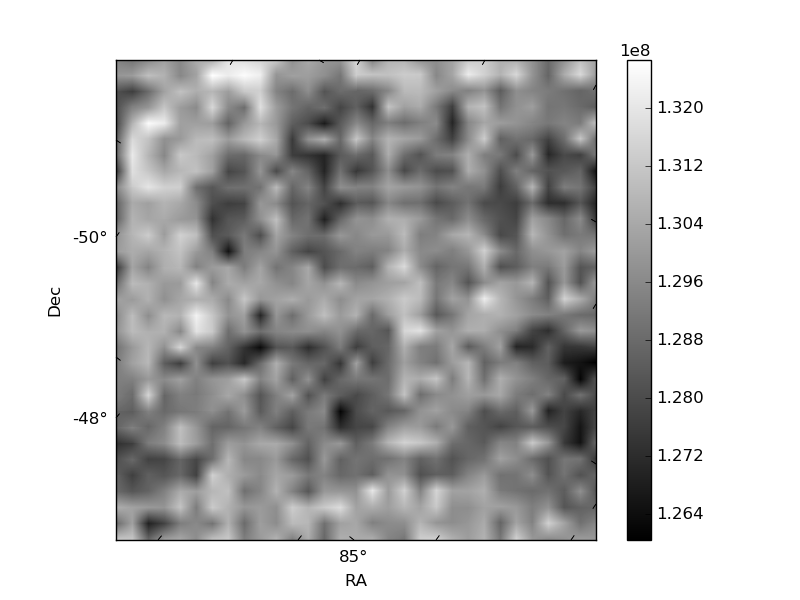
Histogram calculated using DETX and DETY for each event in the final _common_clean file
| Quadrant A | 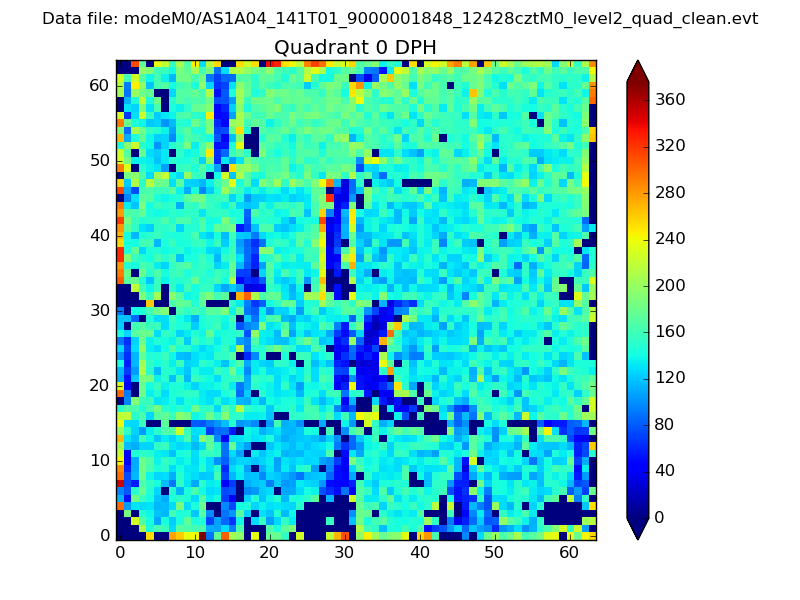 |
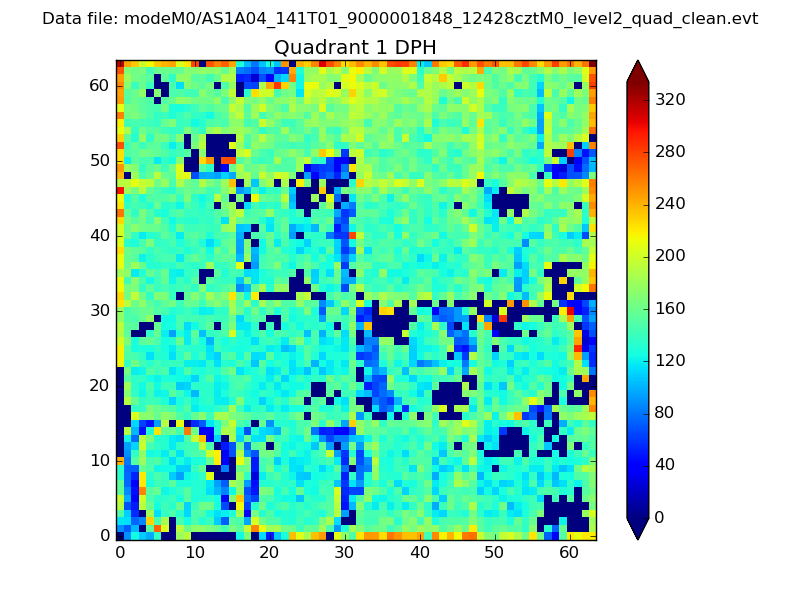 |
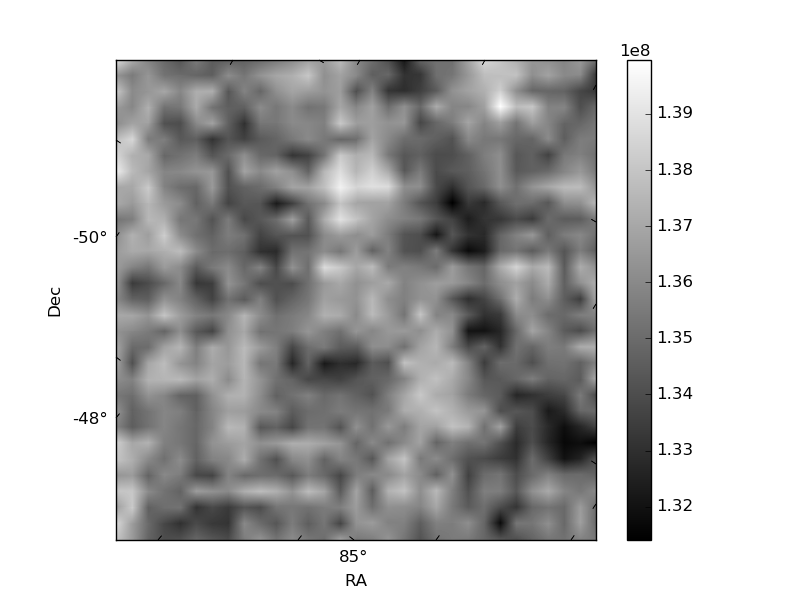
Quadrant B |
|---|---|---|---|
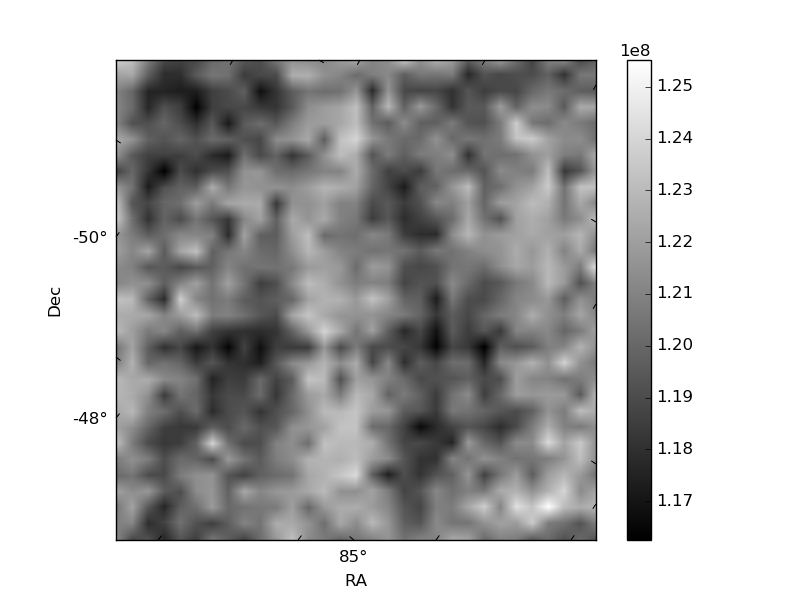
| Quadrant D | 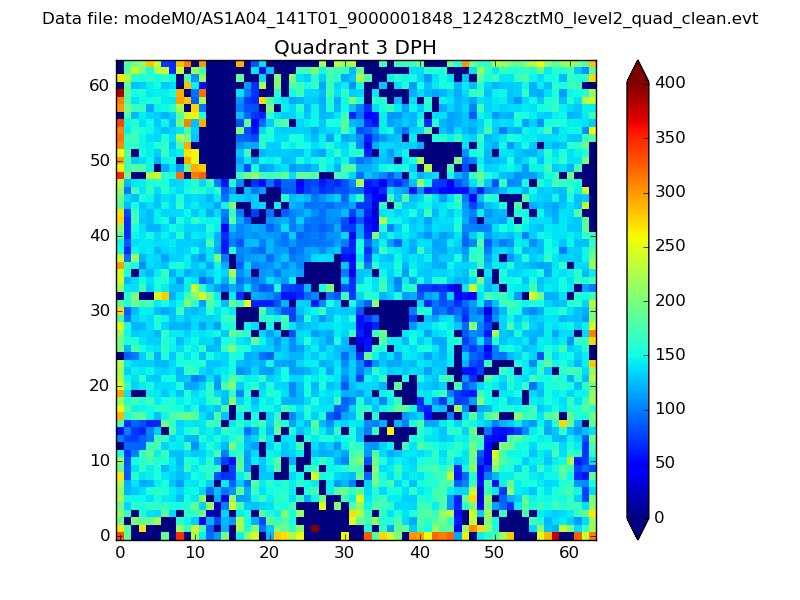 |
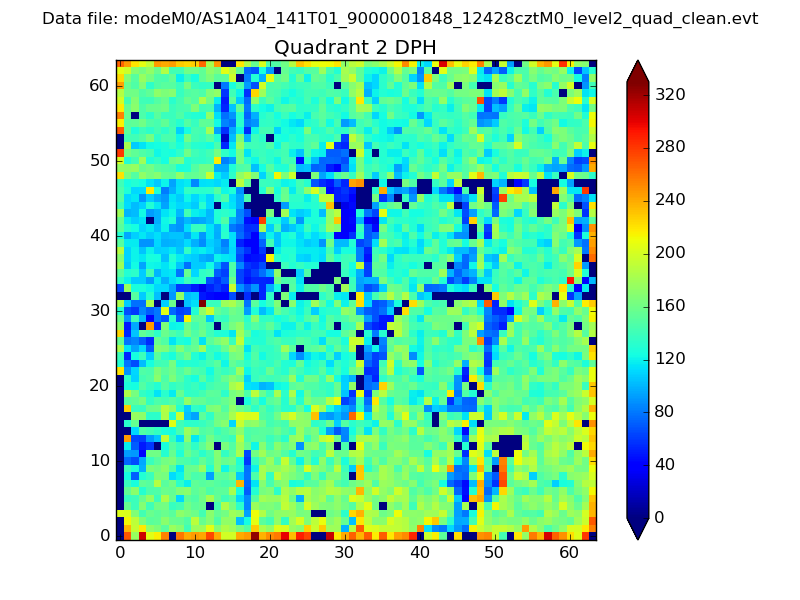 |
Quadrant C |
| Plot type | Count rate plots | Images |
|---|---|---|
| Comparison with Poisson distribution Blue bars denote a histogram of data divided into 1 sec bins. Red curve is a Poisson curve with rate = median count rate of data. |
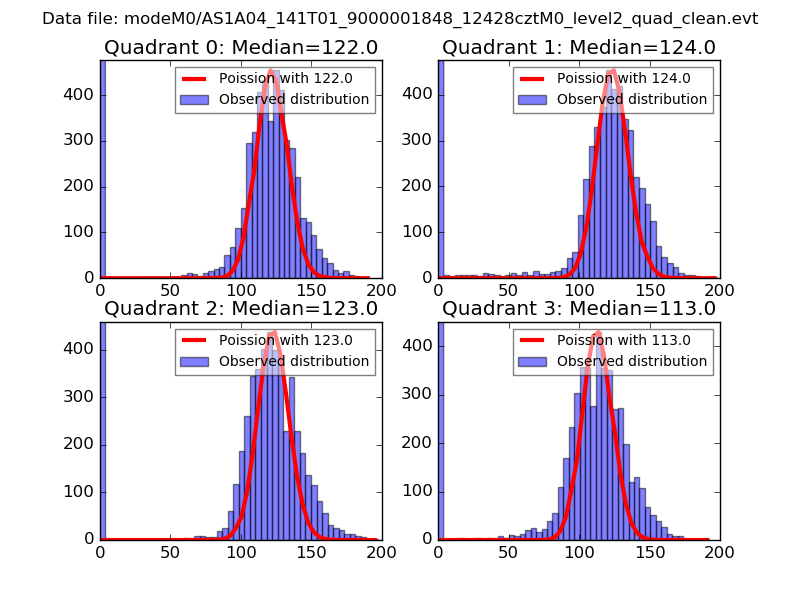 |
 |
| Quadrant-wise count rates Data is divided into 100 sec bins |
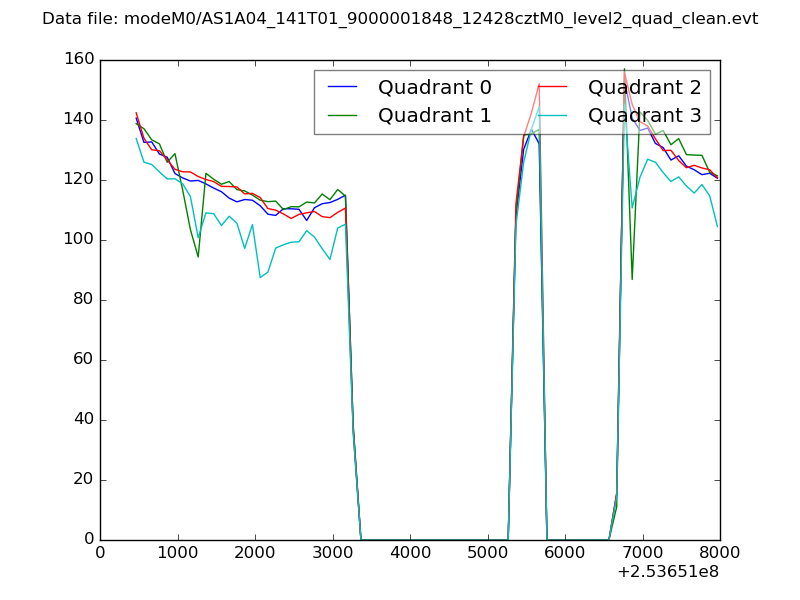 |
|
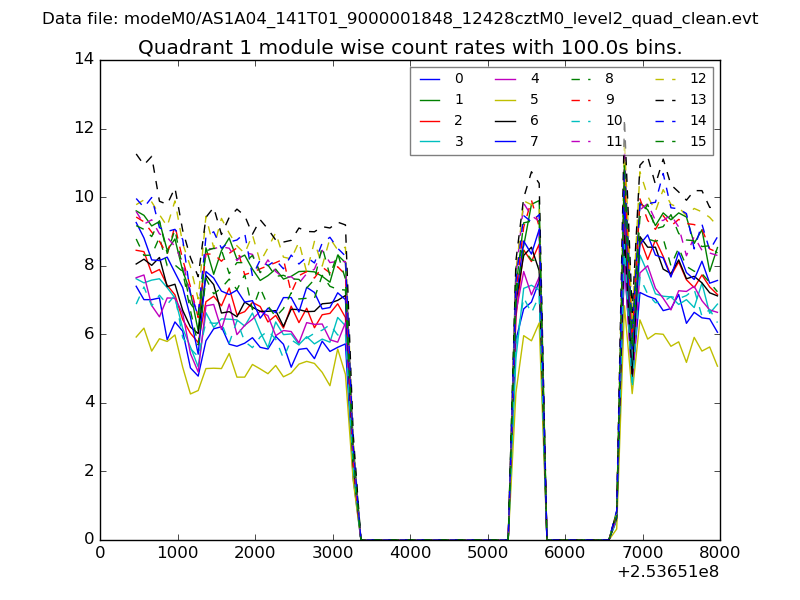
| Module-wise count rates for Quadrant A Data is divided into 100 sec bins |
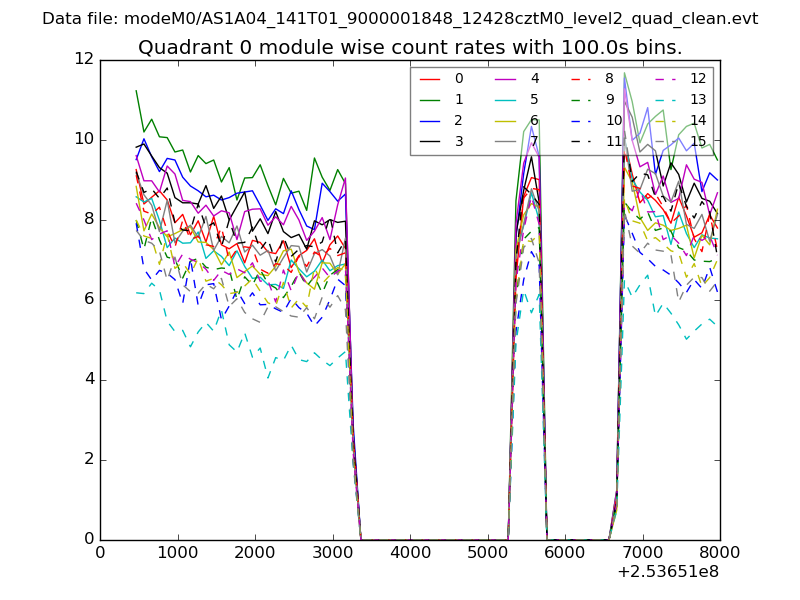 |
 |
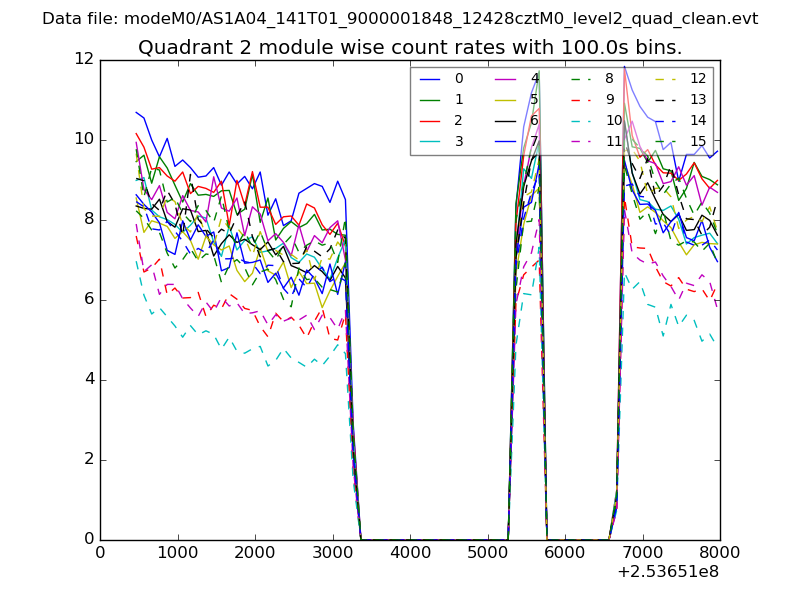
| Module-wise count rates for Quadrant B Data is divided into 100 sec bins |
 |
 |
| Module-wise count rates for Quadrant C Data is divided into 100 sec bins |
 |
 |
| Module-wise count rates for Quadrant D Data is divided into 100 sec bins |
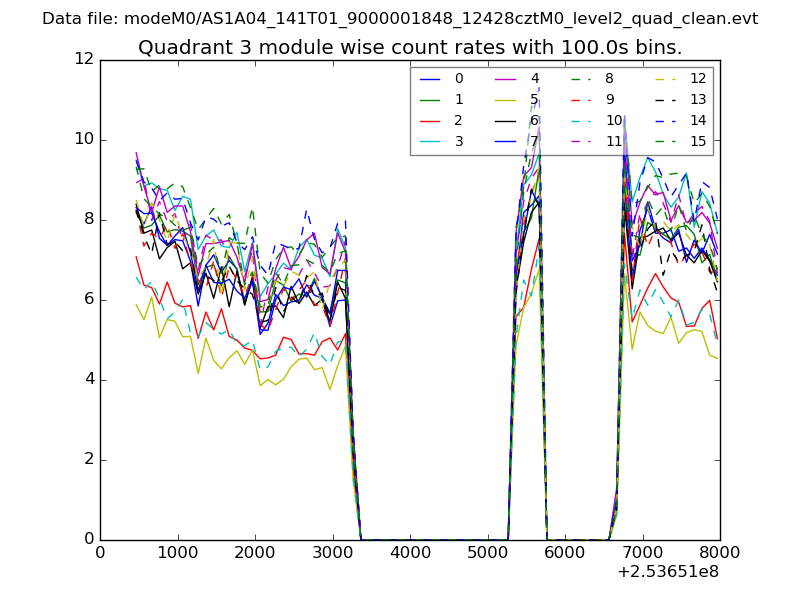 |
 |
| Parameter | Plot |
|---|---|
| CZT HV Monitor | 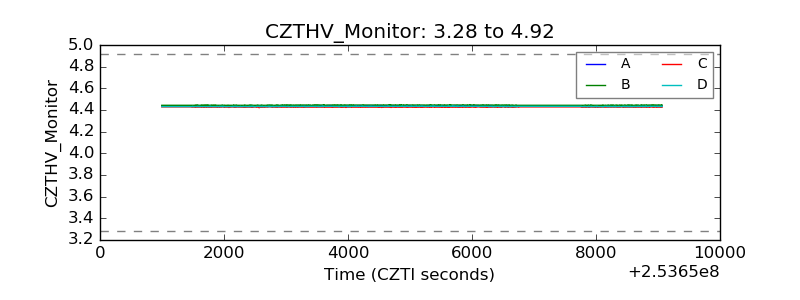 |
| D_VDD | 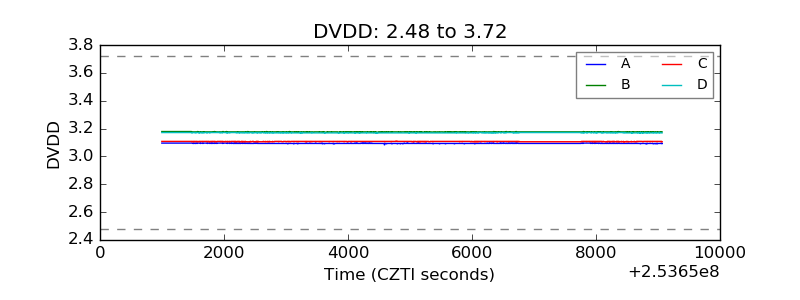 |
| Temperature 1 | 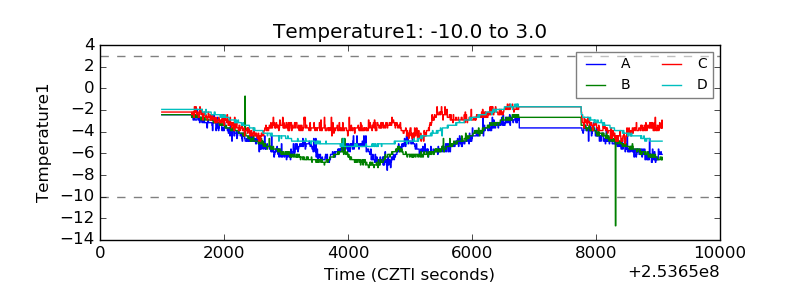 |
| Veto HV Monitor | 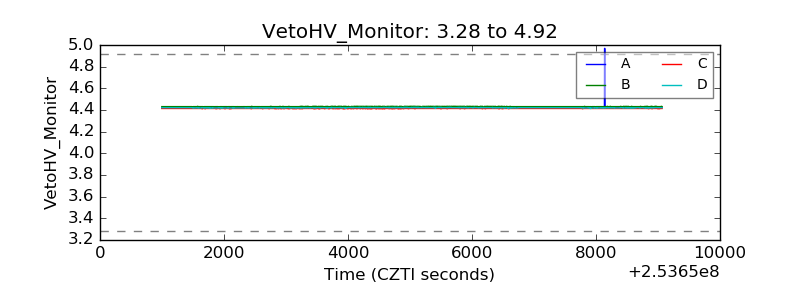 |
| Veto LLD | 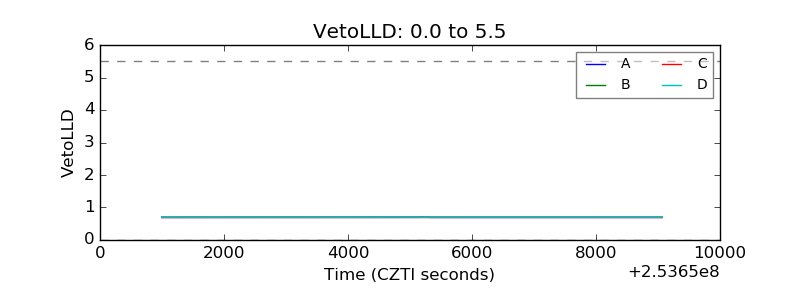 |
| Alpha Counter | 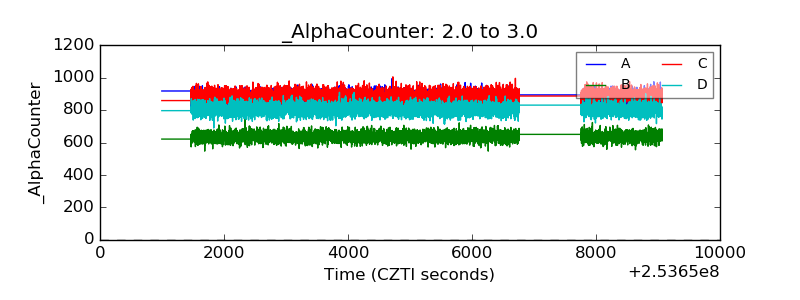 |
| _CPM_Rate | 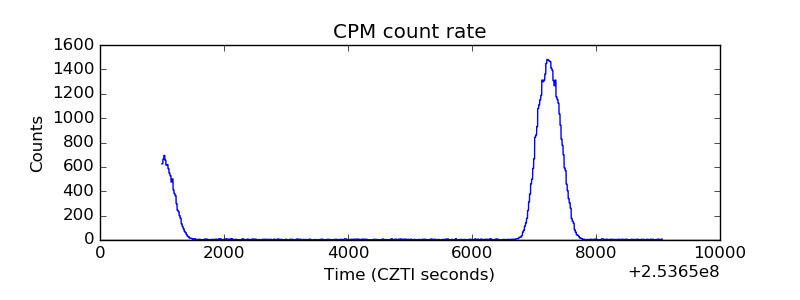 |
| CZT Counter | 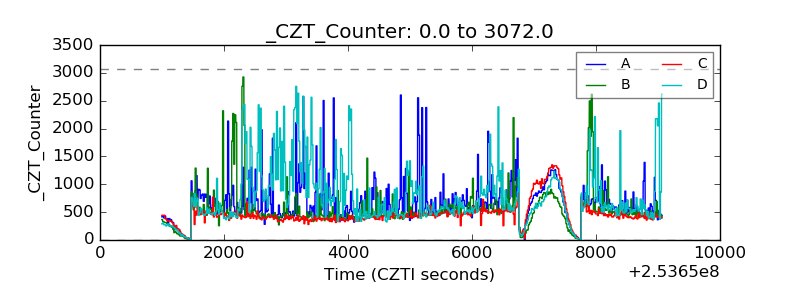 |
| +2.5 Volts monitor |  |
| +5 Volts monitor |  |
| _ROLL_ROT | 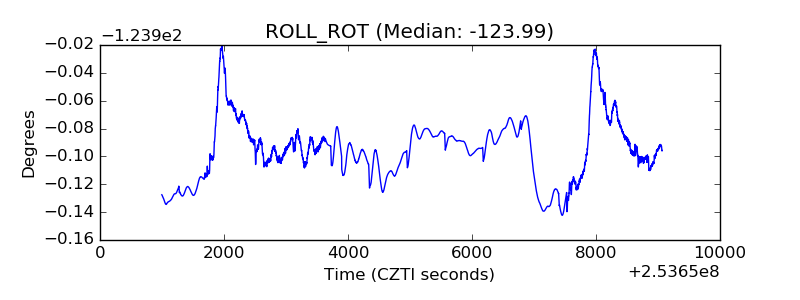 |
| _Roll_DEC | 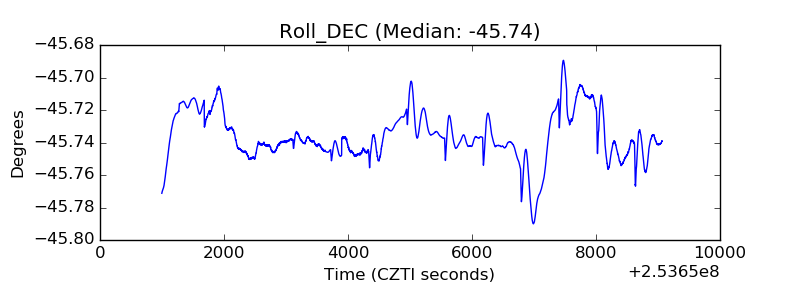 |
| _Roll_RA | 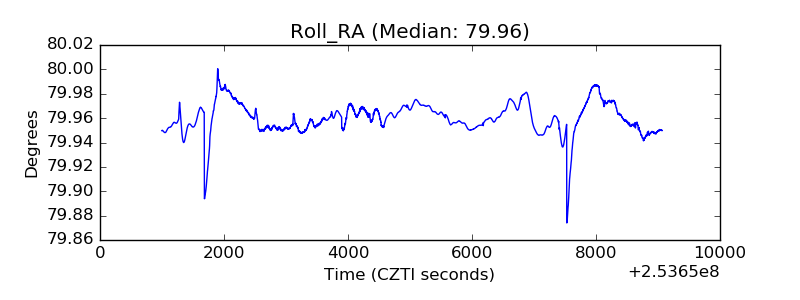 |
| Veto Counter | 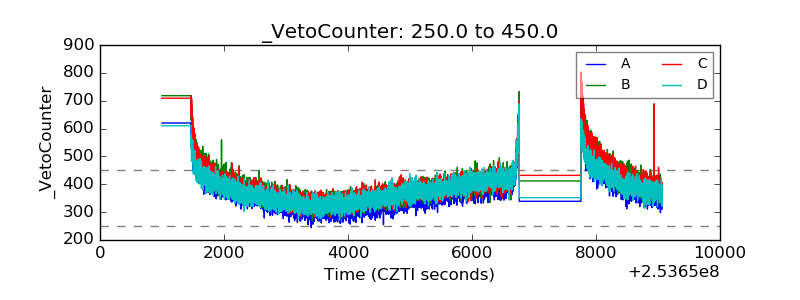 |