| Param | Original file | Final file |
|---|---|---|
| Filename | modeM0/AS1A04_141T01_9000001848_12430cztM0_level2.evt | modeM0/AS1A04_141T01_9000001848_12430cztM0_level2_quad_clean.evt |
| Size (bytes) | 498,628,800 | 92,079,360 |
| Size | 475.5 MB | 87.8 MB |
| Events in quadrant A | 3,691,179 | 587,442 |
| Events in quadrant B | 3,714,146 | 595,840 |
| Events in quadrant C | 2,981,953 | 592,874 |
| Events in quadrant D | 4,265,908 | 552,176 |
| Mode M9 | |||
|---|---|---|---|
| Quadrant | BADHDUFLAG | Total packets | Discarded packets |
| A | 0 | 17 | 0 |
| B | 0 | 17 | 0 |
| C | 0 | 17 | 0 |
| D | 0 | 18 | 0 |
| Mode M0 | |||
|---|---|---|---|
| Quadrant | BADHDUFLAG | Total packets | Discarded packets |
| A | 0 | 15261 | 3 |
| B | 0 | 15330 | 2 |
| C | 0 | 13389 | 2 |
| D | 0 | 17206 | 2 |
| Mode SS | |||
|---|---|---|---|
| Quadrant | BADHDUFLAG | Total packets | Discarded packets |
| A | 0 | 134 | 0 |
| B | 0 | 134 | 0 |
| C | 0 | 134 | 0 |
| D | 0 | 134 | 0 |
| Quadrant | Total seconds | Saturated seconds | Saturation percentage |
|---|---|---|---|
| A | 6598 | 54 | 0.818430% |
| B | 6598 | 143 | 2.167323% |
| C | 6598 | 12 | 0.181873% |
| D | 6598 | 200 | 3.031222% |
Noise dominated data is calculated using 1-second bins in cleaned event files. If a bin has >2000 counts, and if more than 50% of those come from <1% of pixels, then it is considered to be noise-dominated and hence unusable.
| Quadrant | # 1 sec bins | Bins with >0 counts | Bins with >2000 counts | High rate bins dominated by noise | Noise dominated (total time) | Noise dominated (detector-on time) | Marked lightcurve |
|---|---|---|---|---|---|---|---|
| A | 7734 | 6599 | 15 | 15 | 0.19% | 0.23% | 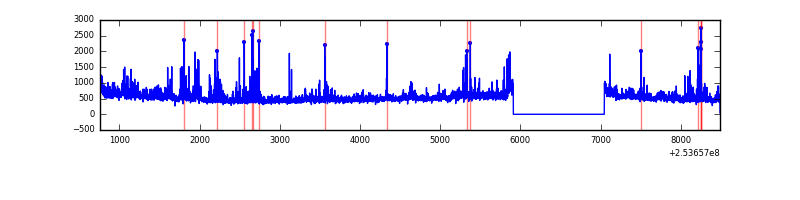 |
| B | 7734 | 6599 | 85 | 85 | 1.10% | 1.29% | 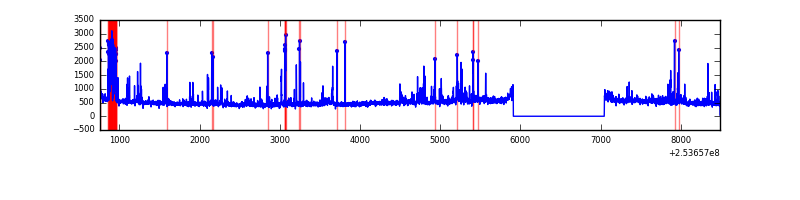 |
| C | 7734 | 6600 | 0 | 0 | 0.00% | 0.00% | 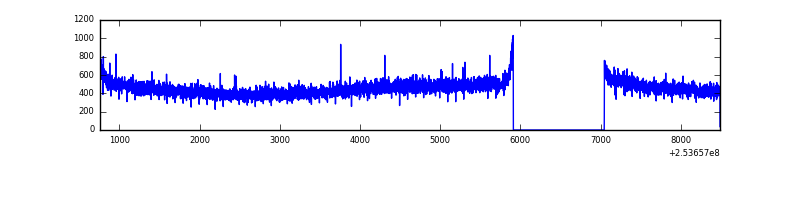 |
| D | 7734 | 6600 | 228 | 228 | 2.95% | 3.45% | 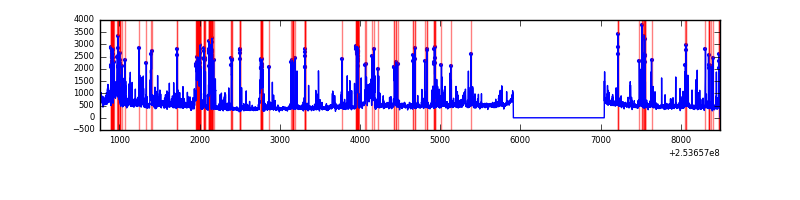 |
Top three noisy pixels from each quadrant. If the there are fewer than three noisy pixels in the level2.evt file, extra rows are filled as -1
| Pixel properties | Quadrant properties | ||||||
|---|---|---|---|---|---|---|---|
| Quadrant | DetID | PixID | Counts | Sigma | Mean | Median | Sigma |
| A | 13 | 251 | 413034 | 2583.33 | 781 | 766 | 159.6 |
| A | 1 | 162 | 94531 | 587.55 | 781 | 766 | 159.6 |
| A | 1 | 178 | 46879 | 288.95 | 781 | 766 | 159.6 |
| B | 4 | 239 | 387376 | 2596.65 | 784 | 766 | 148.9 |
| B | 3 | 64 | 81977 | 545.45 | 784 | 766 | 148.9 |
| B | 15 | 201 | 56700 | 375.68 | 784 | 766 | 148.9 |
| C | 13 | 61 | 5528 | 26.79 | 765 | 770 | 177.6 |
| C | 1 | 16 | 1884 | 6.27 | 765 | 770 | 177.6 |
| C | 3 | 202 | 1883 | 6.27 | 765 | 770 | 177.6 |
| D | 1 | 52 | 1229412 | 6957.69 | 739 | 717 | 176.6 |
| D | 7 | 80 | 94387 | 530.42 | 739 | 717 | 176.6 |
| D | 8 | 195 | 48284 | 269.36 | 739 | 717 | 176.6 |
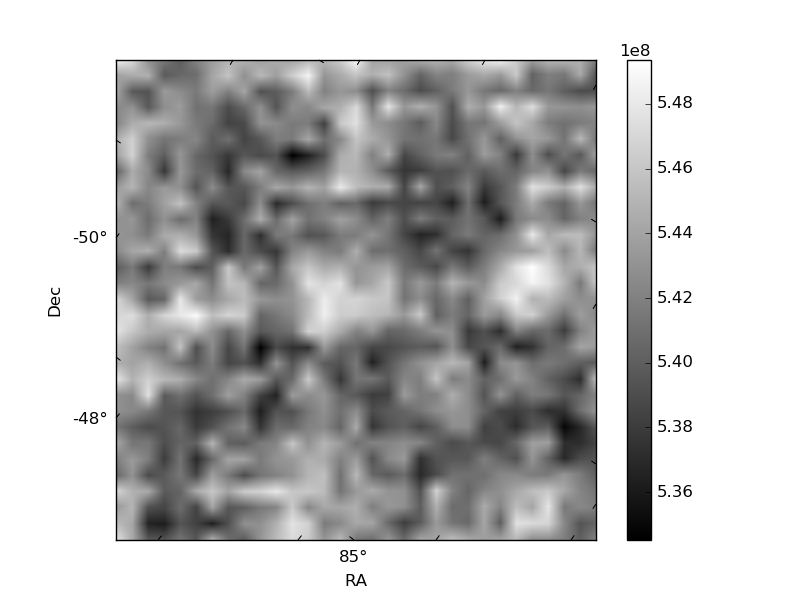
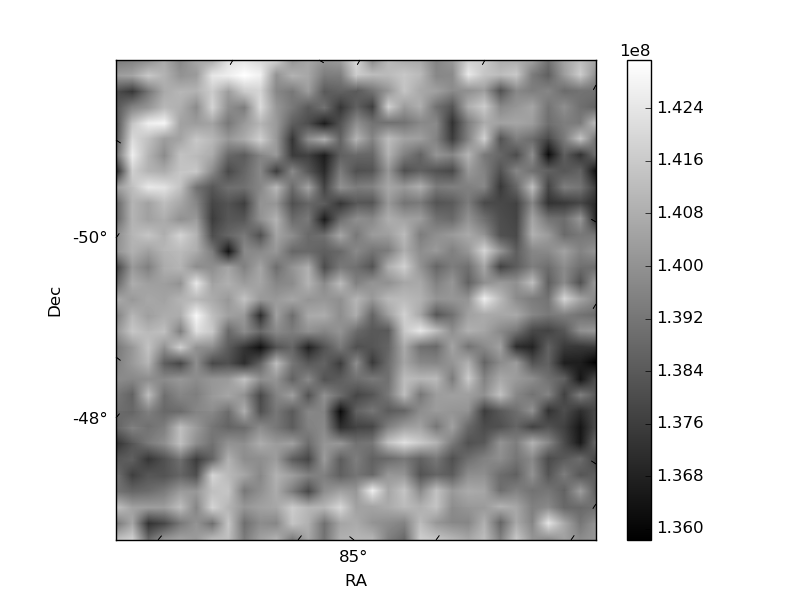
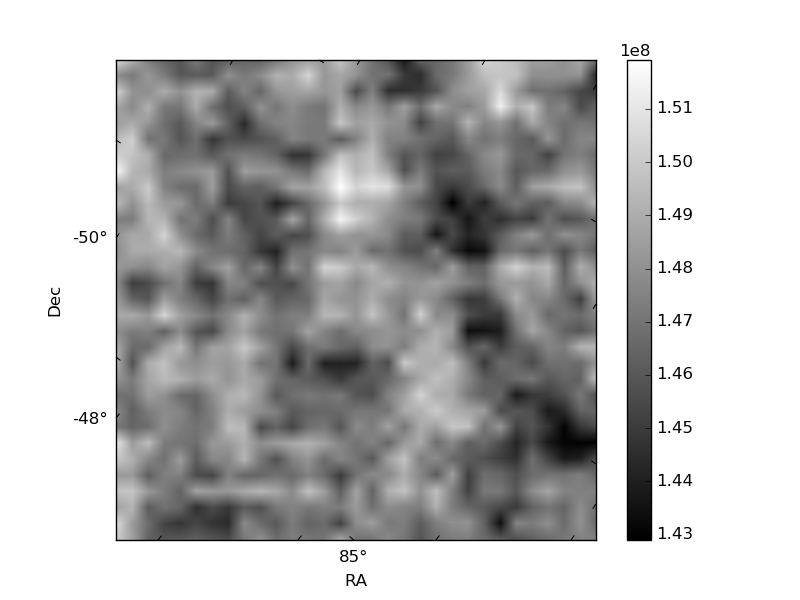
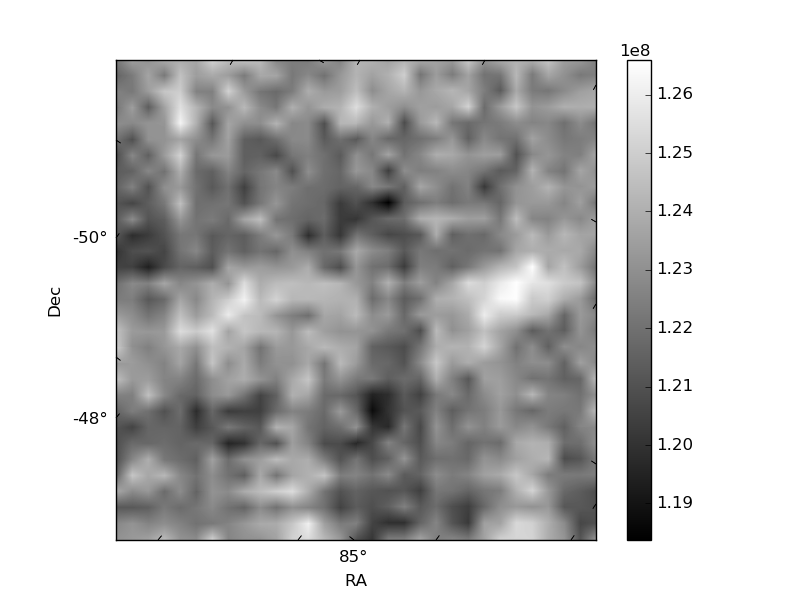
Histogram calculated using DETX and DETY for each event in the final _common_clean file
| Quadrant A | 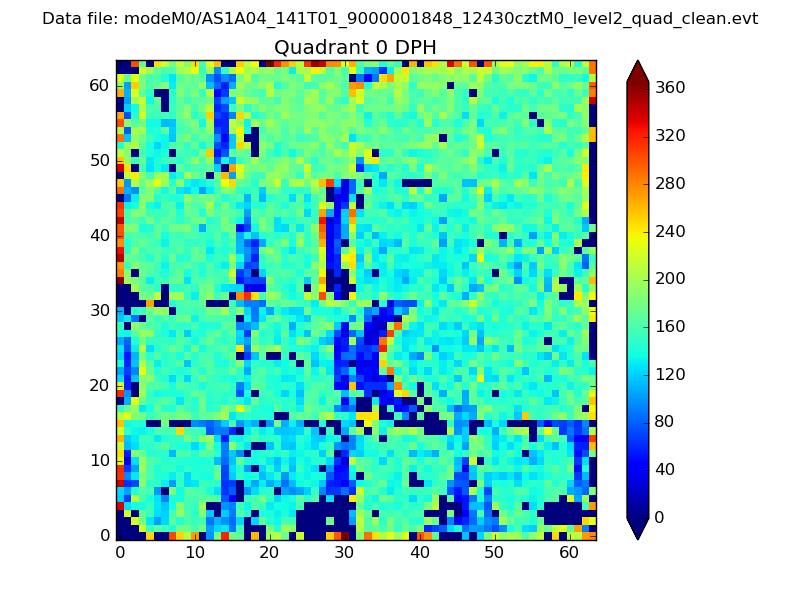 |
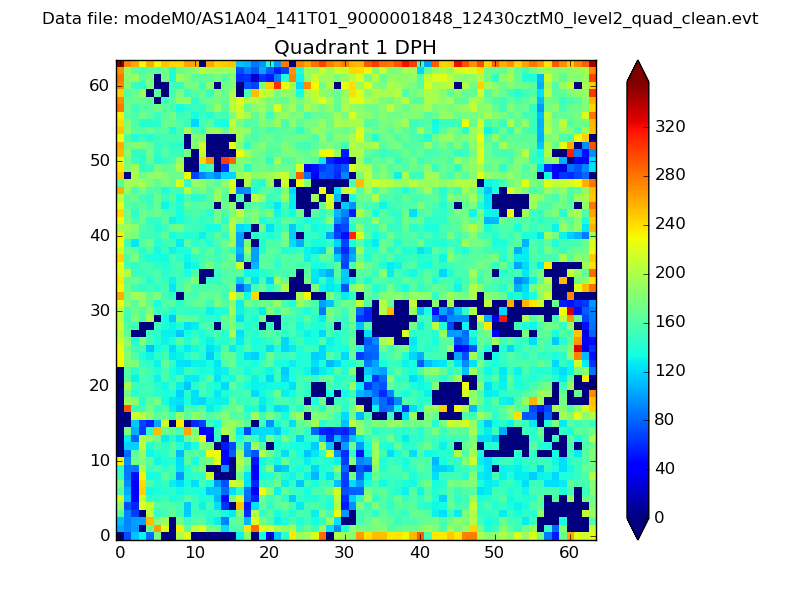 |
Quadrant B |
|---|---|---|---|
| Quadrant D | 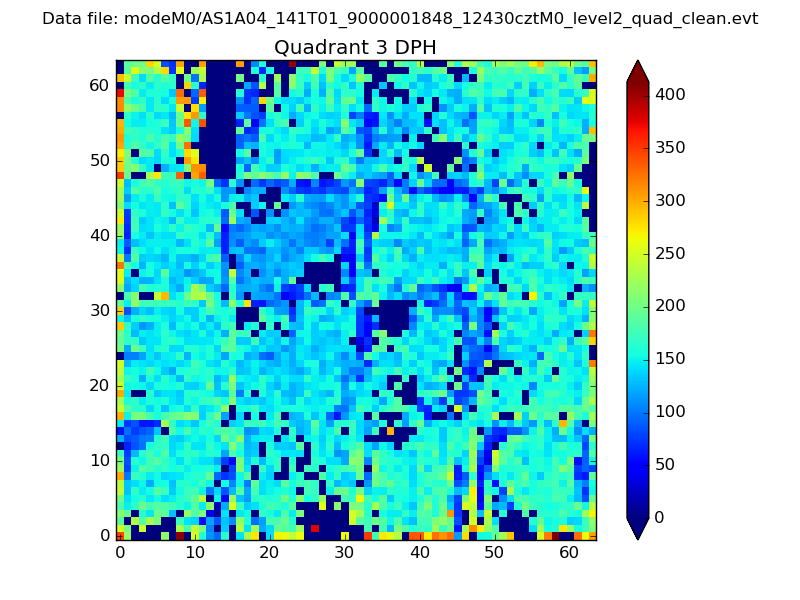 |
 |
Quadrant C |
| Plot type | Count rate plots | Images |
|---|---|---|
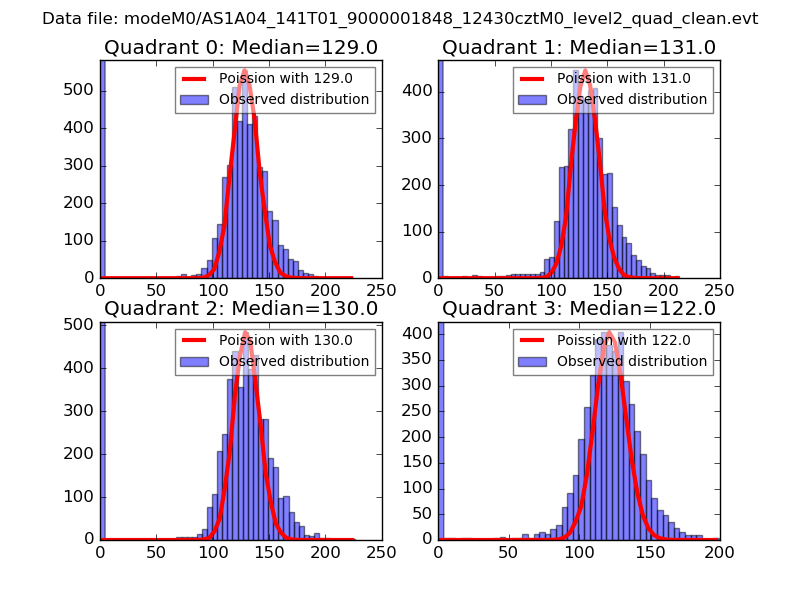
| Comparison with Poisson distribution Blue bars denote a histogram of data divided into 1 sec bins. Red curve is a Poisson curve with rate = median count rate of data. |
 |
 |
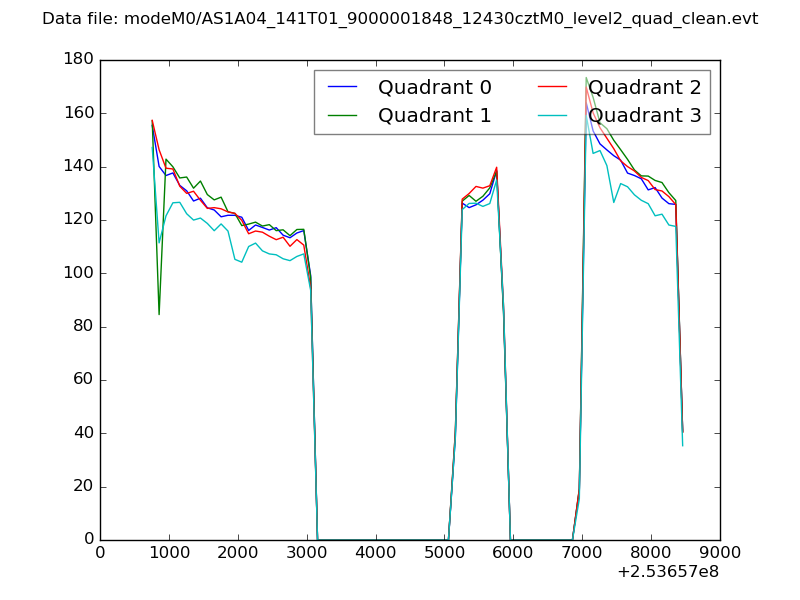
| Quadrant-wise count rates Data is divided into 100 sec bins |
 |
|
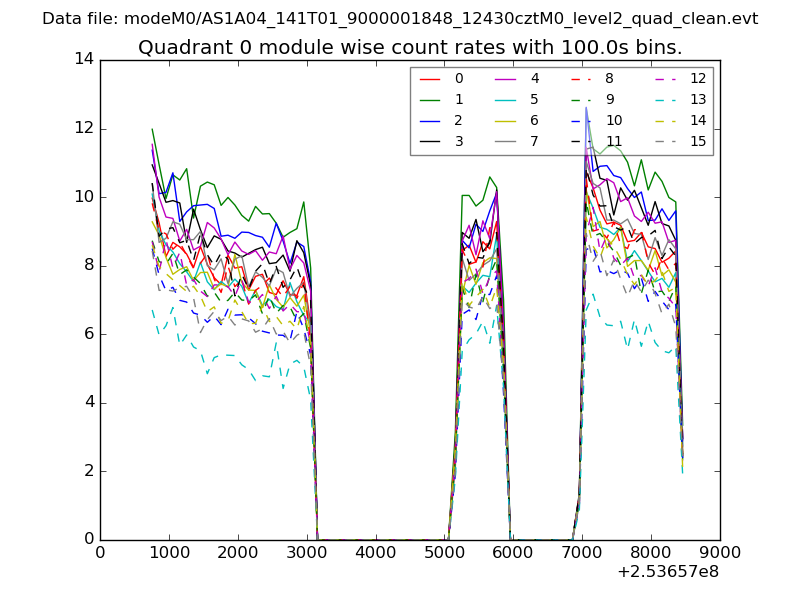
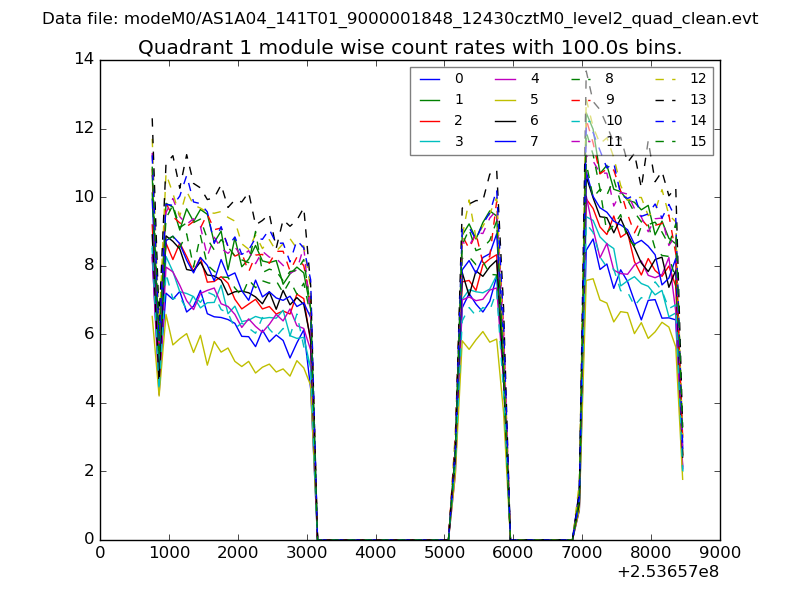
| Module-wise count rates for Quadrant A Data is divided into 100 sec bins |
 |
 |
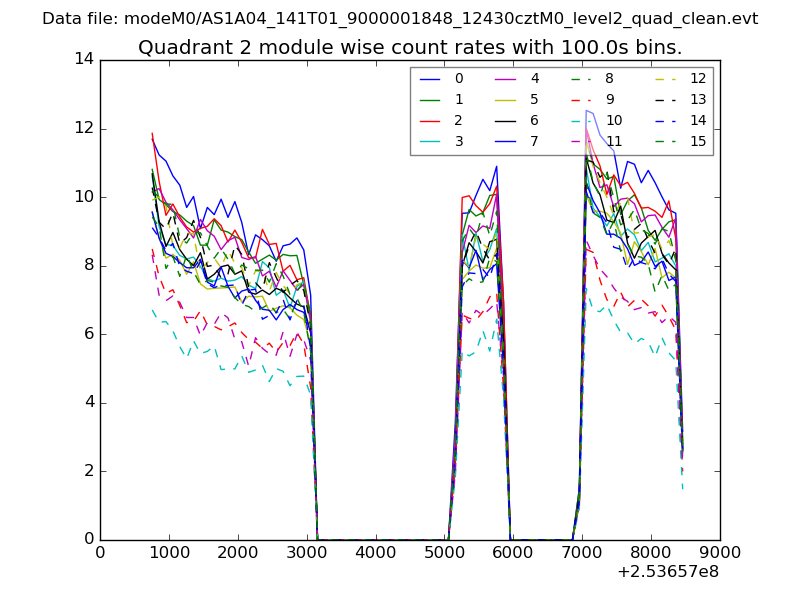
| Module-wise count rates for Quadrant B Data is divided into 100 sec bins |
 |
 |
| Module-wise count rates for Quadrant C Data is divided into 100 sec bins |
 |
 |
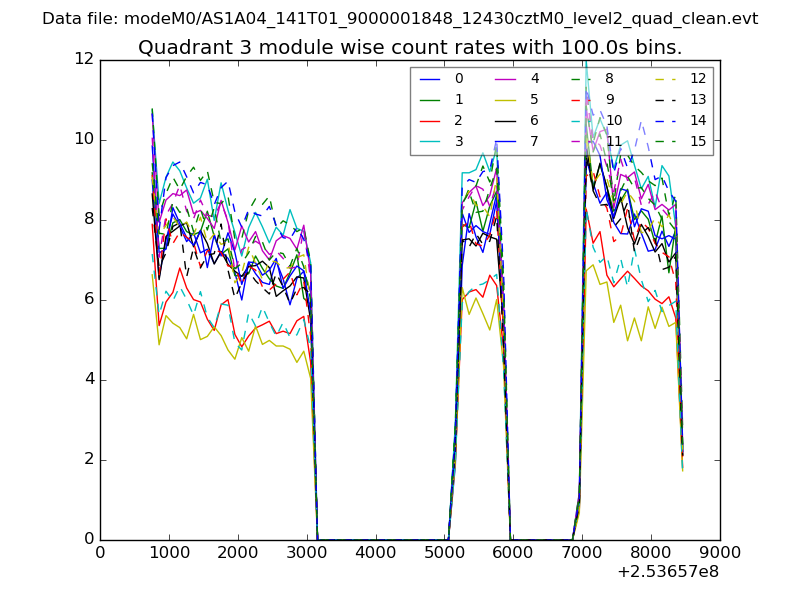
| Module-wise count rates for Quadrant D Data is divided into 100 sec bins |
 |
 |
| Parameter | Plot |
|---|---|
| CZT HV Monitor | 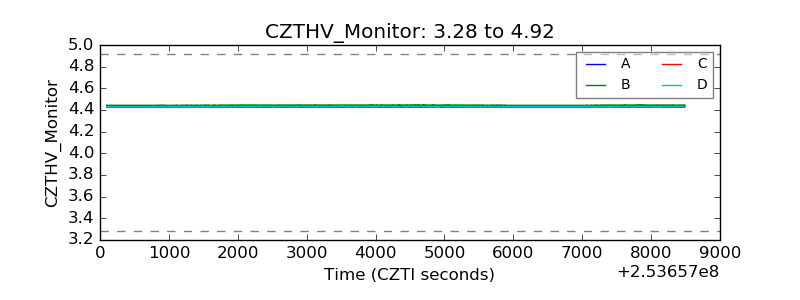 |
| D_VDD | 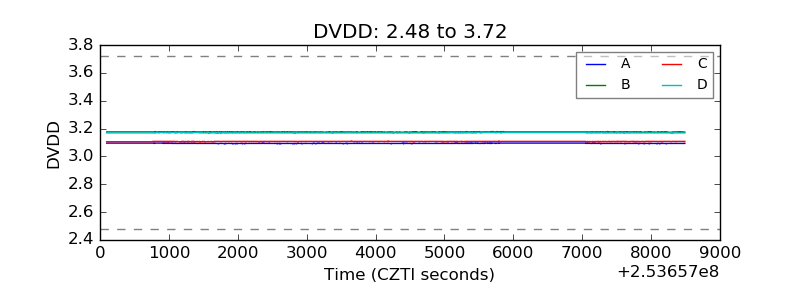 |
| Temperature 1 | 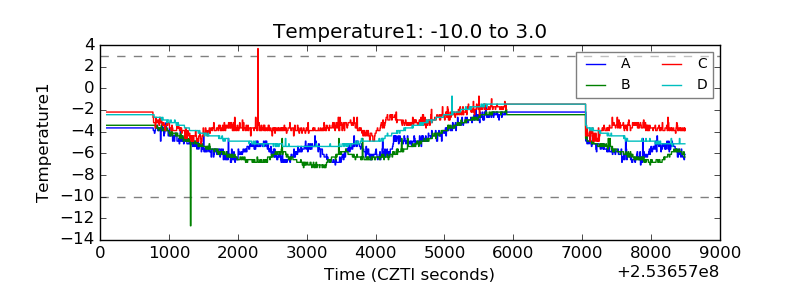 |
| Veto HV Monitor | 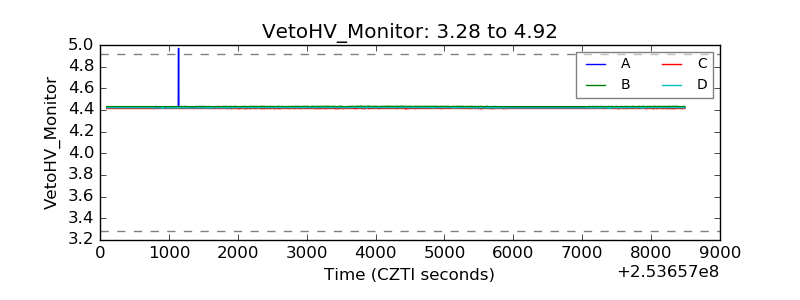 |
| Veto LLD | 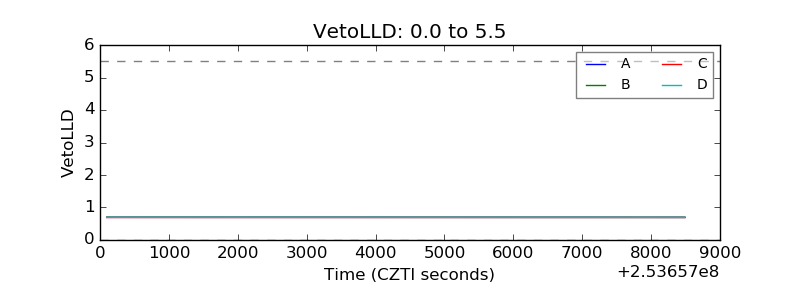 |
| Alpha Counter | 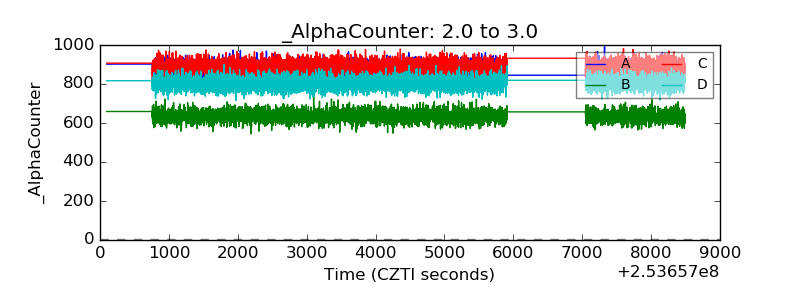 |
| _CPM_Rate | 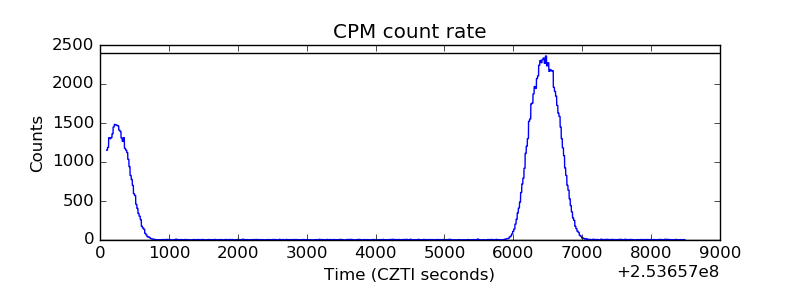 |
| CZT Counter | 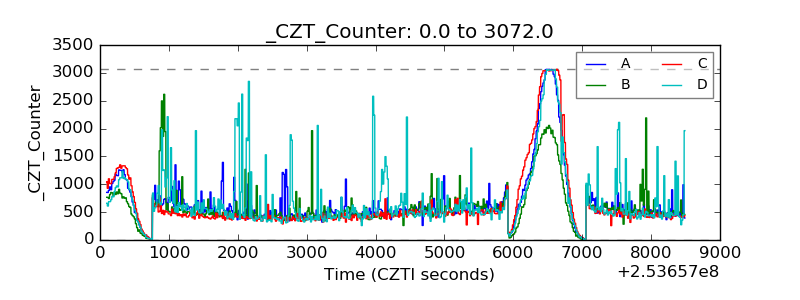 |
| +2.5 Volts monitor |  |
| +5 Volts monitor |  |
| _ROLL_ROT | 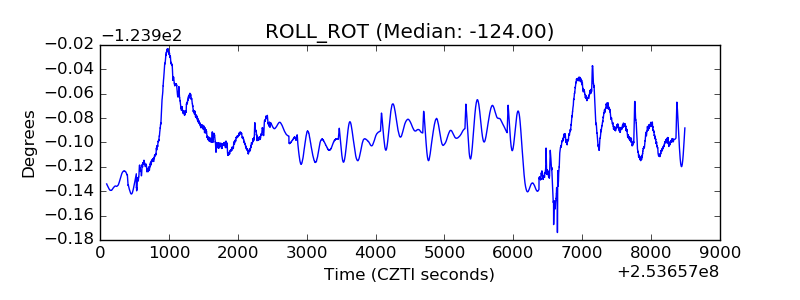 |
| _Roll_DEC | 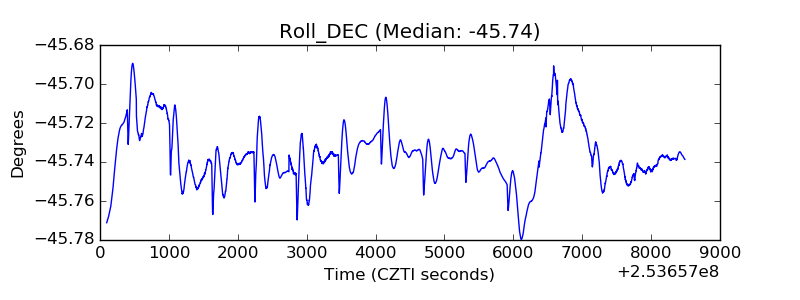 |
| _Roll_RA | 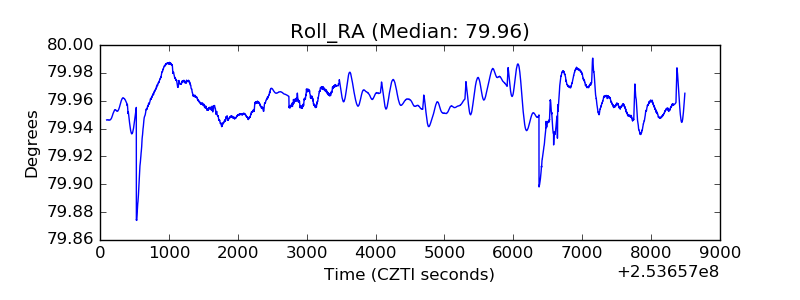 |
| Veto Counter | 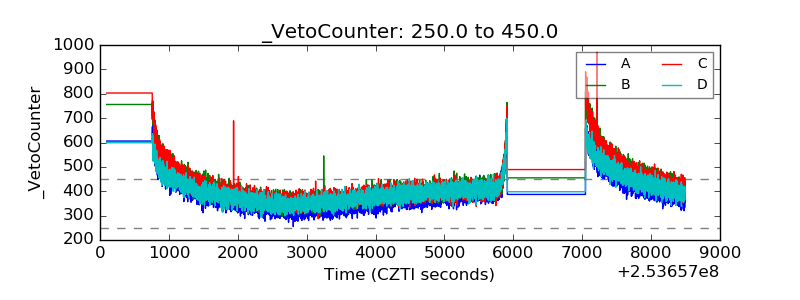 |