| Param | Original file | Final file |
|---|---|---|
| Filename | modeM0/AS1A04_141T01_9000001848_12431cztM0_level2.evt | modeM0/AS1A04_141T01_9000001848_12431cztM0_level2_quad_clean.evt |
| Size (bytes) | 474,258,240 | 93,790,080 |
| Size | 452.3 MB | 89.4 MB |
| Events in quadrant A | 3,520,827 | 600,884 |
| Events in quadrant B | 3,412,129 | 620,430 |
| Events in quadrant C | 3,031,038 | 611,251 |
| Events in quadrant D | 3,964,379 | 561,135 |
| Mode M9 | |||
|---|---|---|---|
| Quadrant | BADHDUFLAG | Total packets | Discarded packets |
| A | 0 | 17 | 0 |
| B | 0 | 17 | 0 |
| C | 0 | 17 | 0 |
| D | 0 | 18 | 0 |
| Mode M0 | |||
|---|---|---|---|
| Quadrant | BADHDUFLAG | Total packets | Discarded packets |
| A | 0 | 14466 | 3 |
| B | 0 | 14153 | 2 |
| C | 0 | 13156 | 2 |
| D | 0 | 16001 | 2 |
| Mode SS | |||
|---|---|---|---|
| Quadrant | BADHDUFLAG | Total packets | Discarded packets |
| A | 0 | 130 | 0 |
| B | 0 | 130 | 0 |
| C | 0 | 130 | 0 |
| D | 0 | 130 | 0 |
| Quadrant | Total seconds | Saturated seconds | Saturation percentage |
|---|---|---|---|
| A | 6400 | 39 | 0.609375% |
| B | 6400 | 37 | 0.578125% |
| C | 6400 | 10 | 0.156250% |
| D | 6400 | 202 | 3.156250% |
Noise dominated data is calculated using 1-second bins in cleaned event files. If a bin has >2000 counts, and if more than 50% of those come from <1% of pixels, then it is considered to be noise-dominated and hence unusable.
| Quadrant | # 1 sec bins | Bins with >0 counts | Bins with >2000 counts | High rate bins dominated by noise | Noise dominated (total time) | Noise dominated (detector-on time) | Marked lightcurve |
|---|---|---|---|---|---|---|---|
| A | 7656 | 6402 | 14 | 14 | 0.18% | 0.22% | 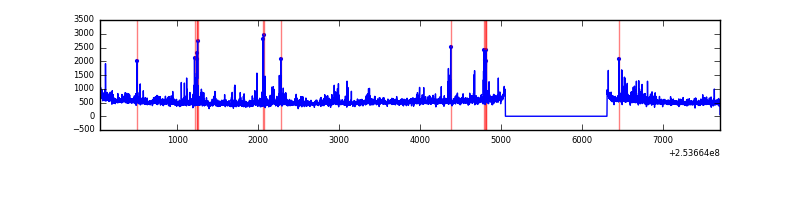 |
| B | 7656 | 6402 | 12 | 12 | 0.16% | 0.19% | 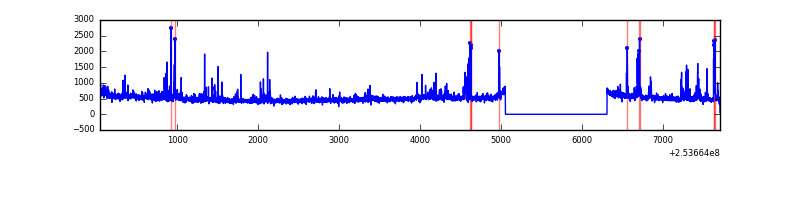 |
| C | 7656 | 6402 | 2 | 2 | 0.03% | 0.03% | 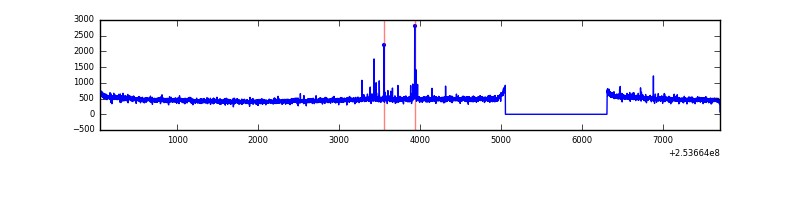 |
| D | 7656 | 6402 | 175 | 175 | 2.29% | 2.73% | 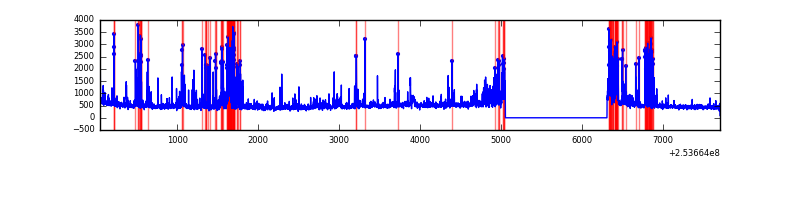 |
Top three noisy pixels from each quadrant. If the there are fewer than three noisy pixels in the level2.evt file, extra rows are filled as -1
| Pixel properties | Quadrant properties | ||||||
|---|---|---|---|---|---|---|---|
| Quadrant | DetID | PixID | Counts | Sigma | Mean | Median | Sigma |
| A | 13 | 251 | 291889 | 1860.24 | 776 | 762 | 156.5 |
| A | 1 | 162 | 85124 | 539.05 | 776 | 762 | 156.5 |
| A | 1 | 178 | 42607 | 267.38 | 776 | 762 | 156.5 |
| B | 4 | 239 | 209771 | 1396.68 | 790 | 771 | 149.6 |
| B | 3 | 64 | 46644 | 306.55 | 790 | 771 | 149.6 |
| B | 0 | 187 | 33750 | 220.39 | 790 | 771 | 149.6 |
| C | 15 | 208 | 38294 | 213.11 | 767 | 775 | 176.1 |
| C | 13 | 61 | 5451 | 26.56 | 767 | 775 | 176.1 |
| C | 1 | 16 | 1936 | 6.59 | 767 | 775 | 176.1 |
| D | 1 | 52 | 894094 | 5014.99 | 744 | 726 | 178.1 |
| D | 8 | 195 | 68487 | 380.38 | 744 | 726 | 178.1 |
| D | 7 | 80 | 65161 | 361.71 | 744 | 726 | 178.1 |
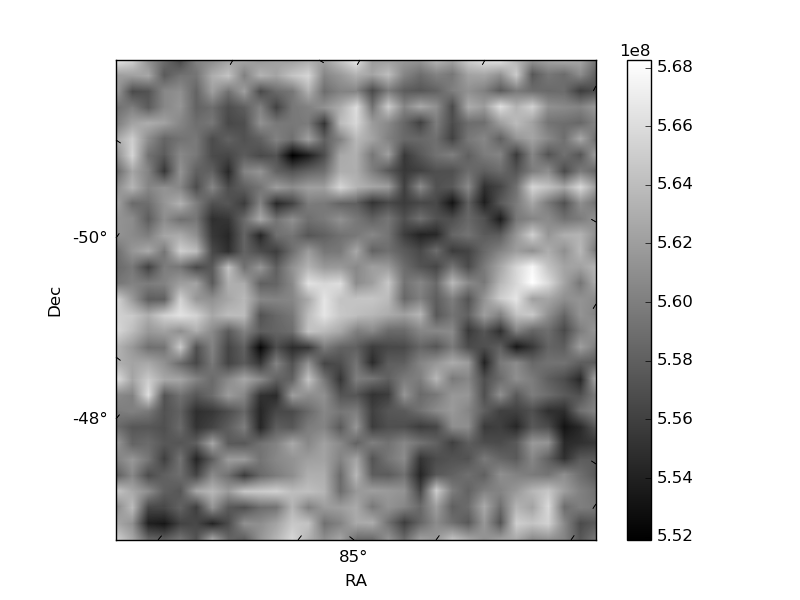
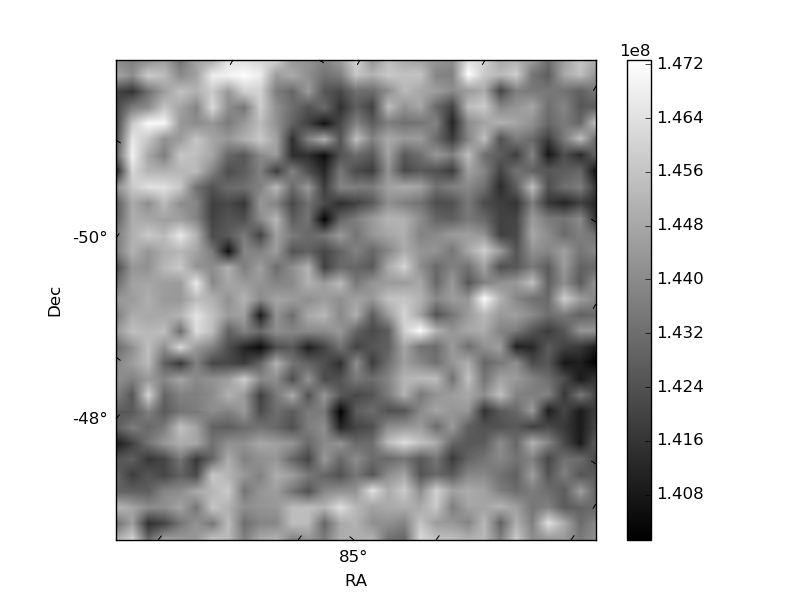
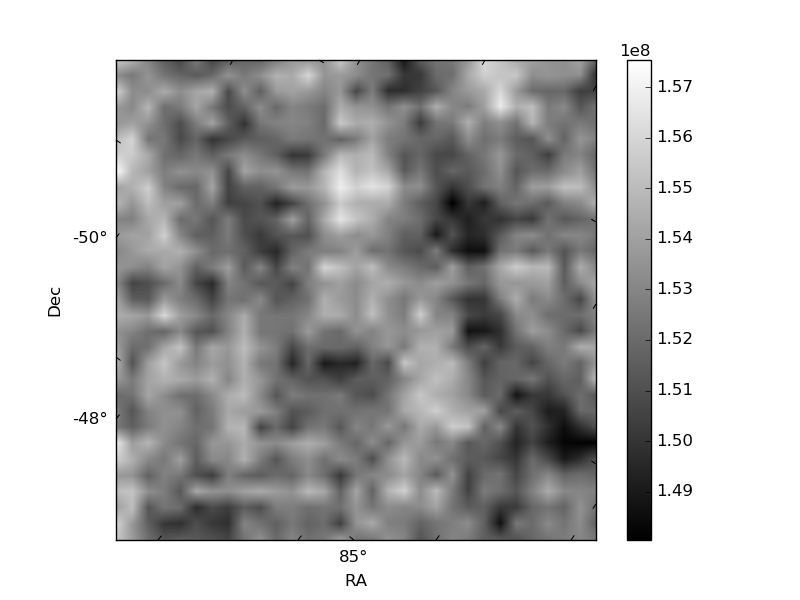
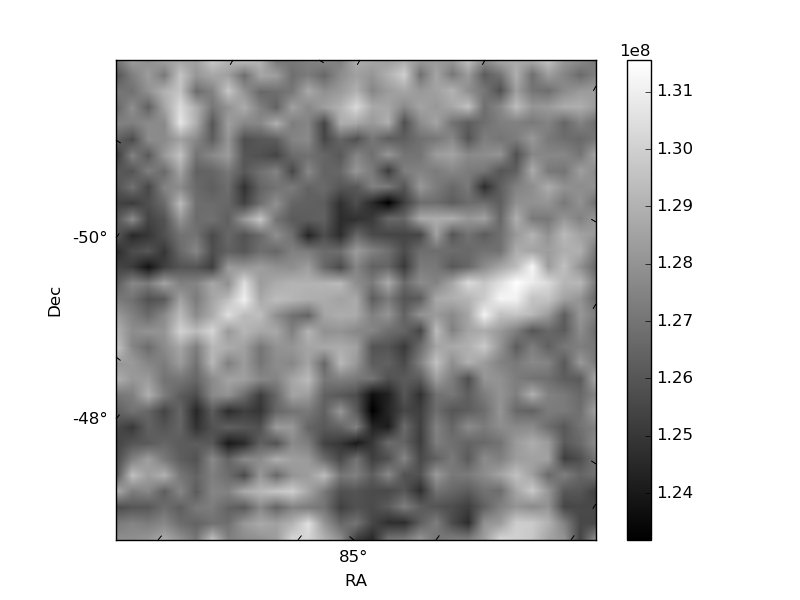
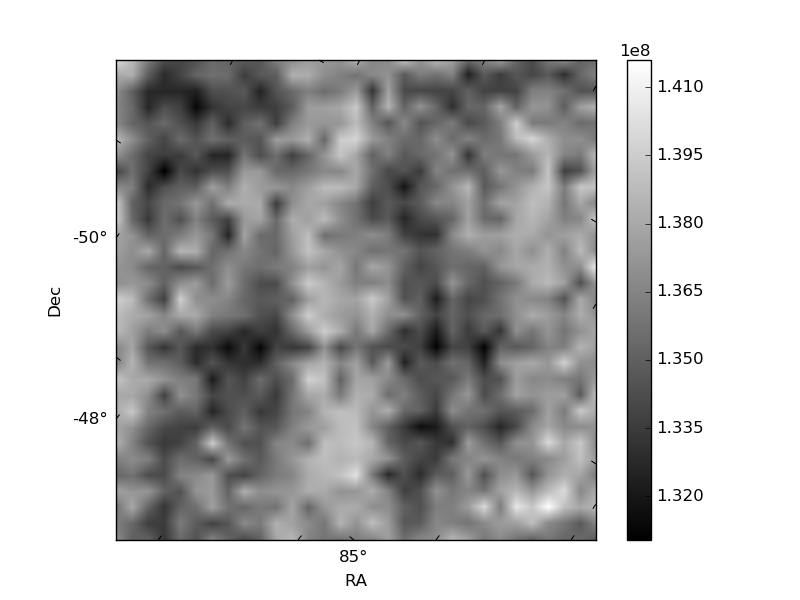
Histogram calculated using DETX and DETY for each event in the final _common_clean file
| Quadrant A | 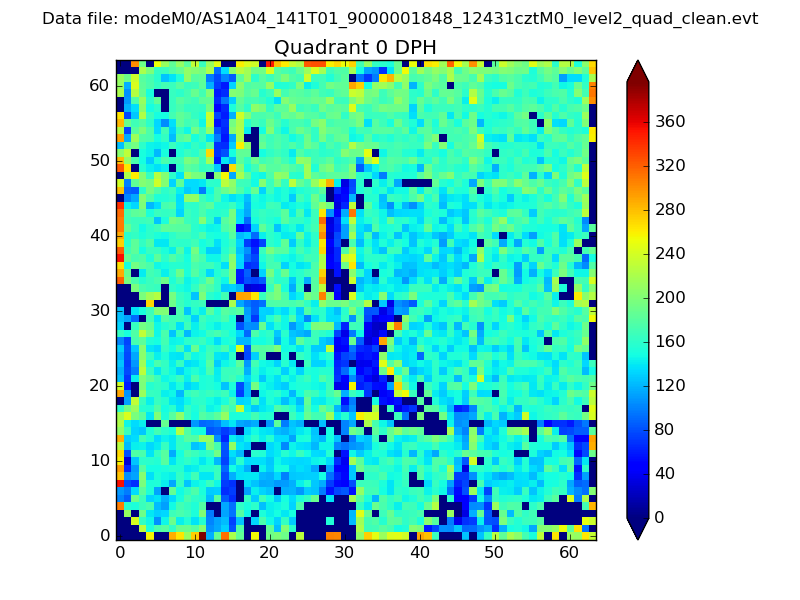 |
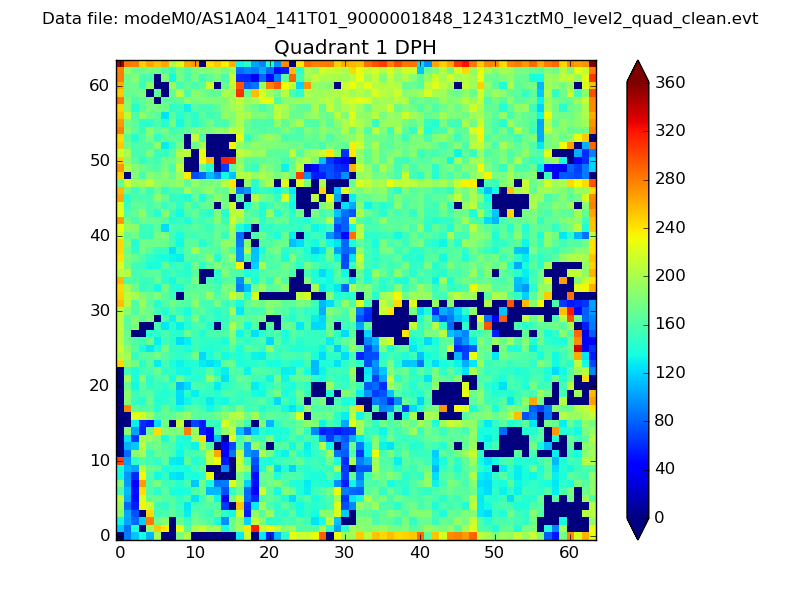 |
Quadrant B |
|---|---|---|---|
| Quadrant D | 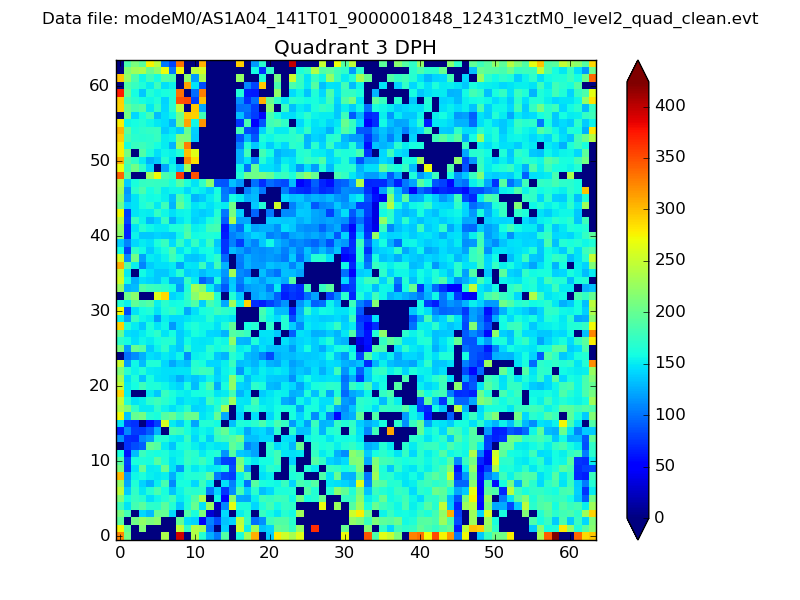 |
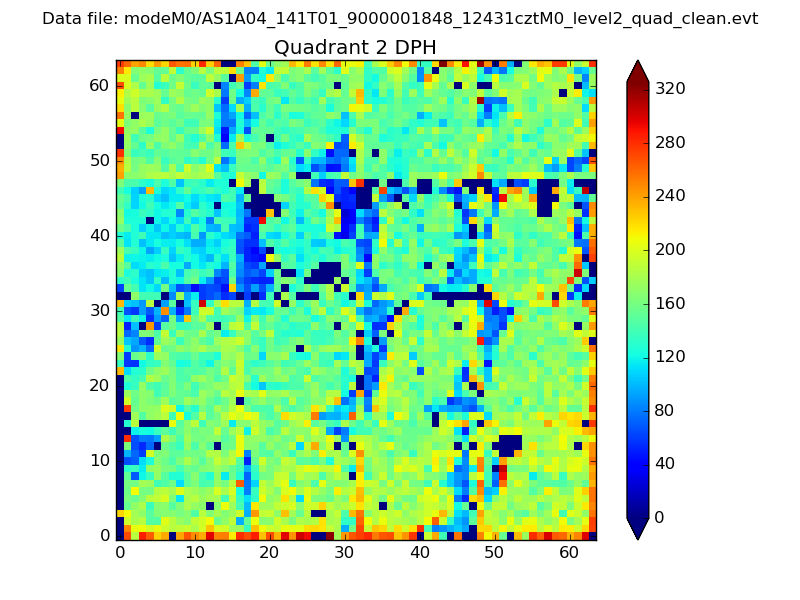 |
Quadrant C |
| Plot type | Count rate plots | Images |
|---|---|---|
| Comparison with Poisson distribution Blue bars denote a histogram of data divided into 1 sec bins. Red curve is a Poisson curve with rate = median count rate of data. |
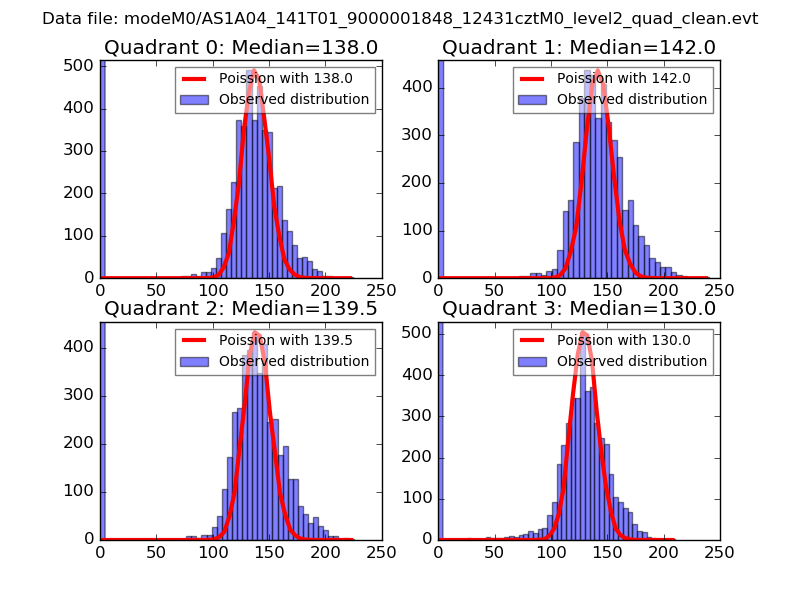 |
 |
| Quadrant-wise count rates Data is divided into 100 sec bins |
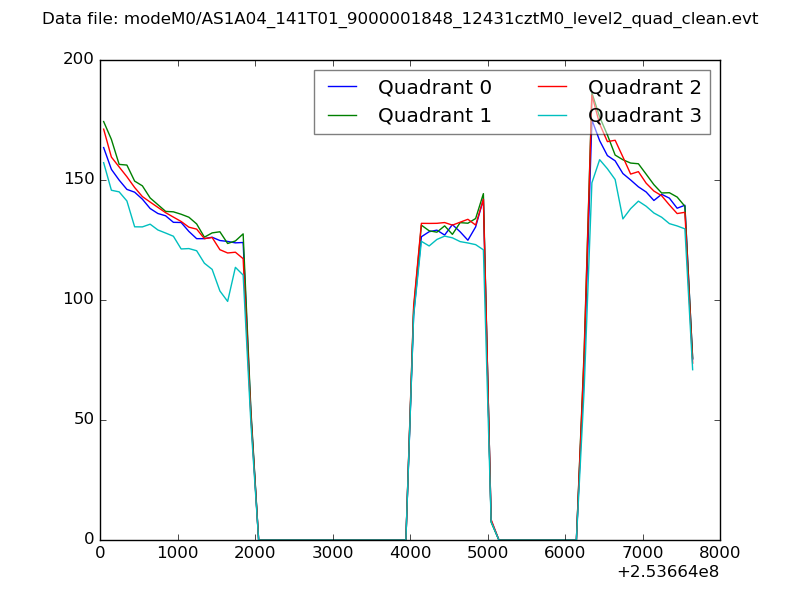 |
|
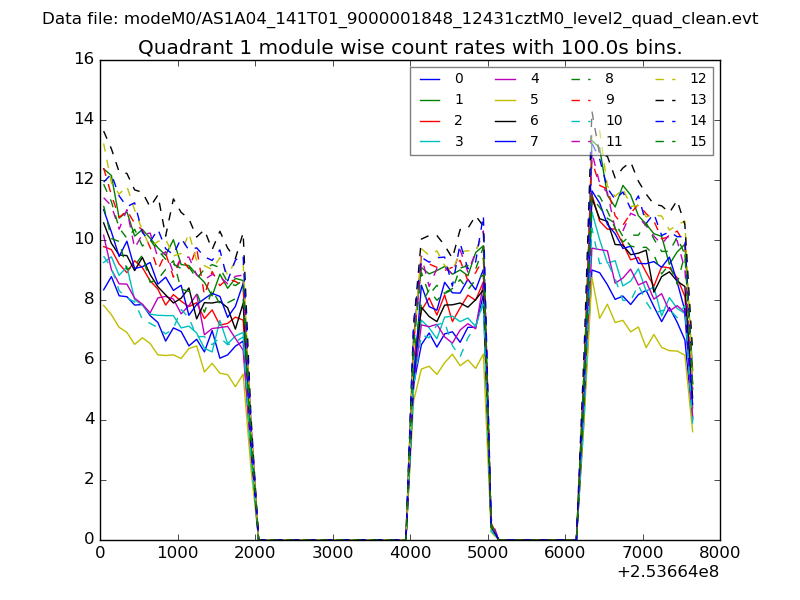
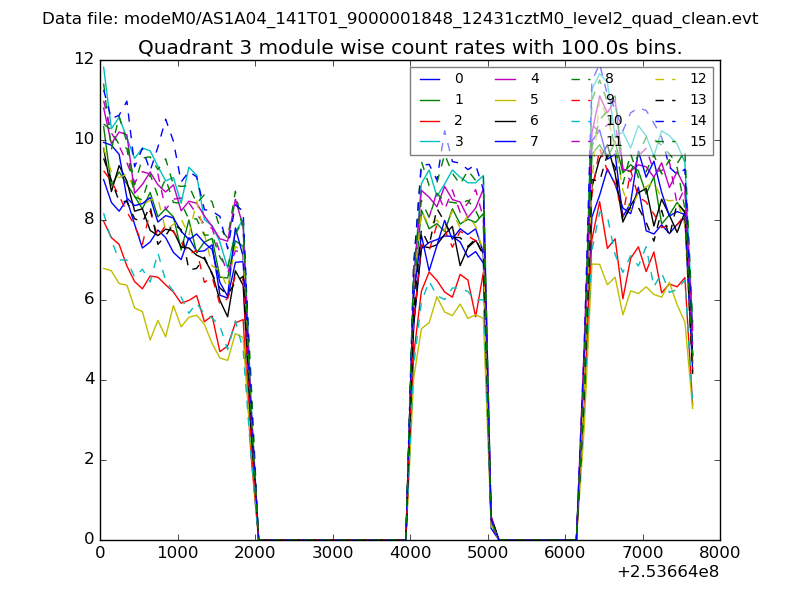
| Module-wise count rates for Quadrant A Data is divided into 100 sec bins |
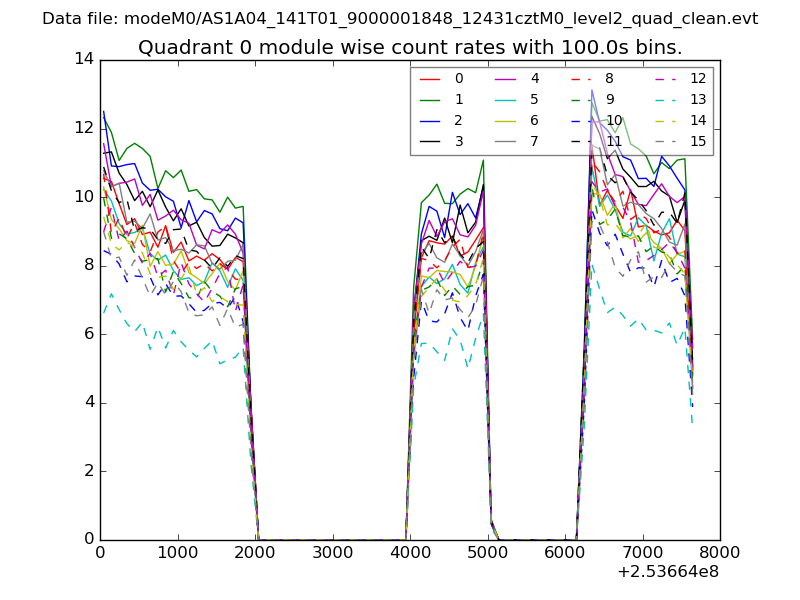 |
 |
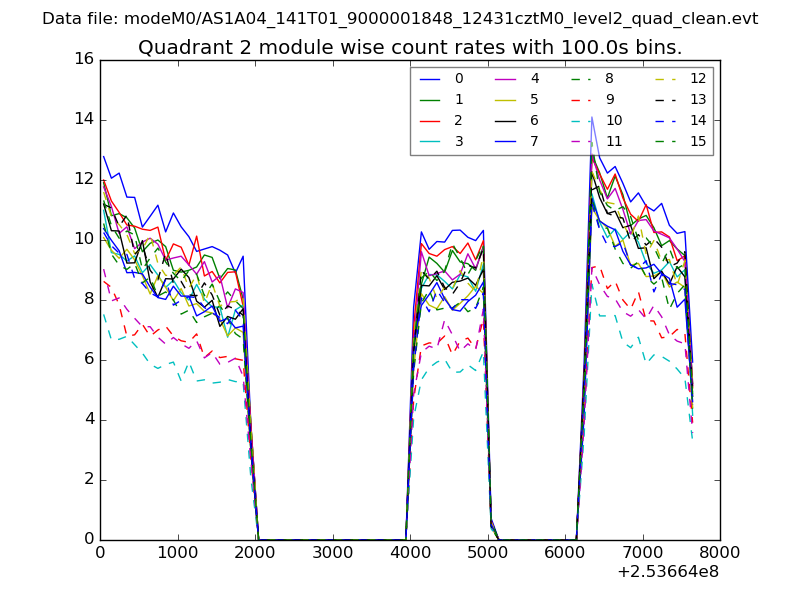
| Module-wise count rates for Quadrant B Data is divided into 100 sec bins |
 |
 |
| Module-wise count rates for Quadrant C Data is divided into 100 sec bins |
 |
 |
| Module-wise count rates for Quadrant D Data is divided into 100 sec bins |
 |
 |
| Parameter | Plot |
|---|---|
| CZT HV Monitor | 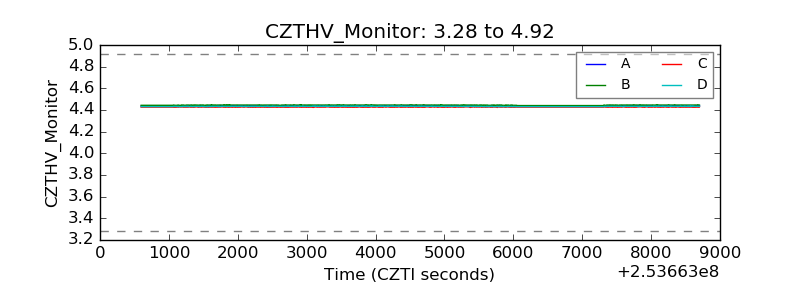 |
| D_VDD |  |
| Temperature 1 | 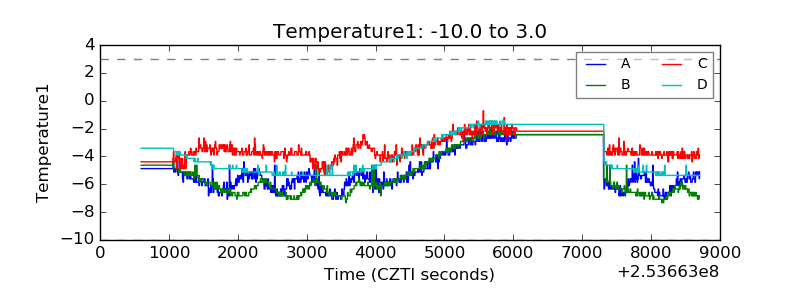 |
| Veto HV Monitor | 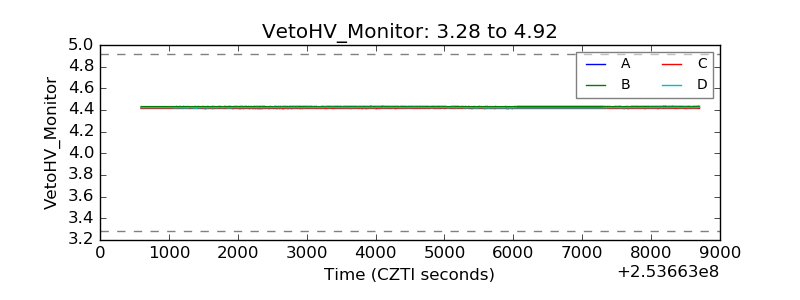 |
| Veto LLD | 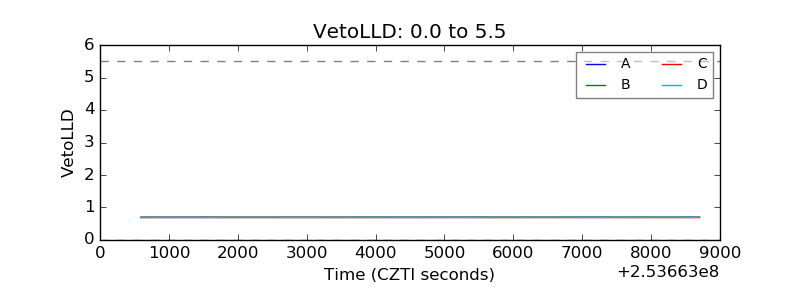 |
| Alpha Counter | 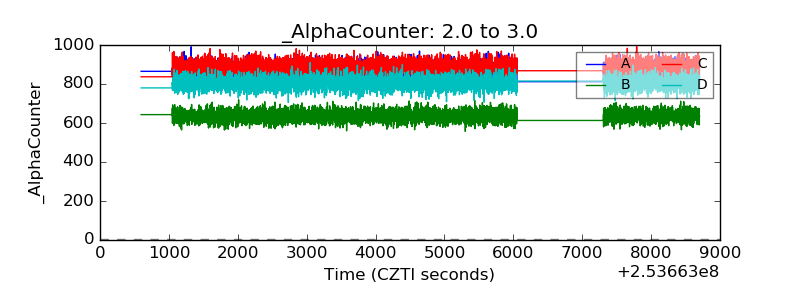 |
| _CPM_Rate | 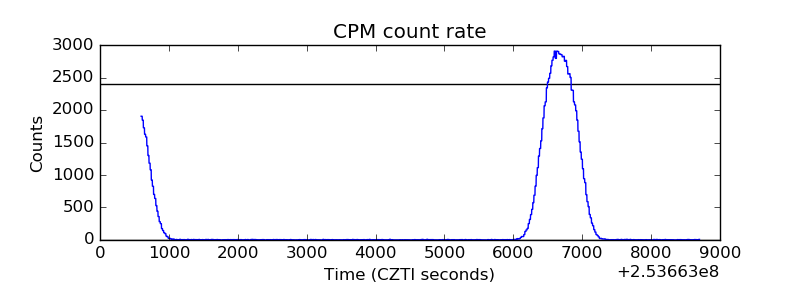 |
| CZT Counter | 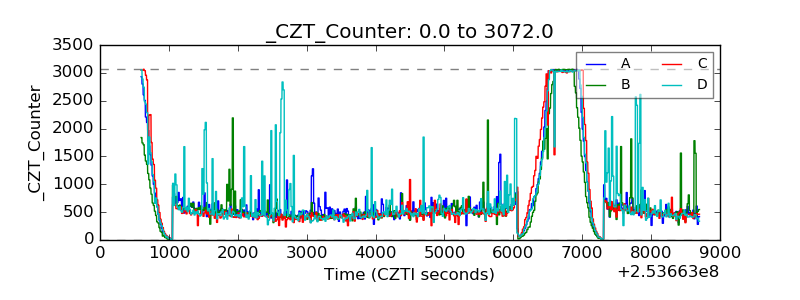 |
| +2.5 Volts monitor |  |
| +5 Volts monitor |  |
| _ROLL_ROT | 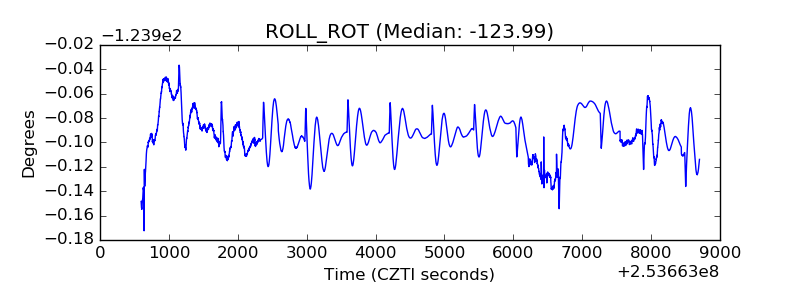 |
| _Roll_DEC | 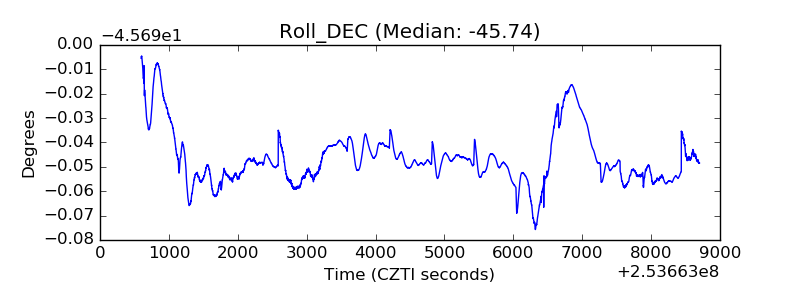 |
| _Roll_RA | 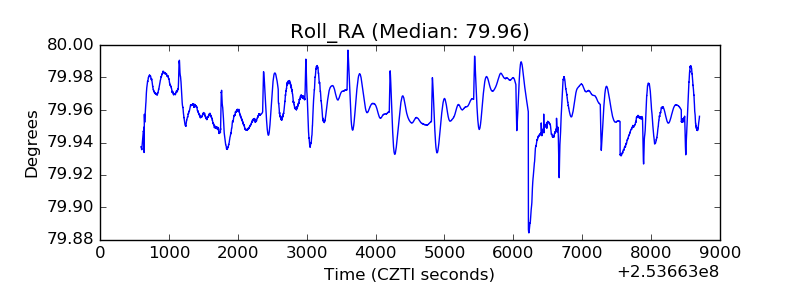 |
| Veto Counter | 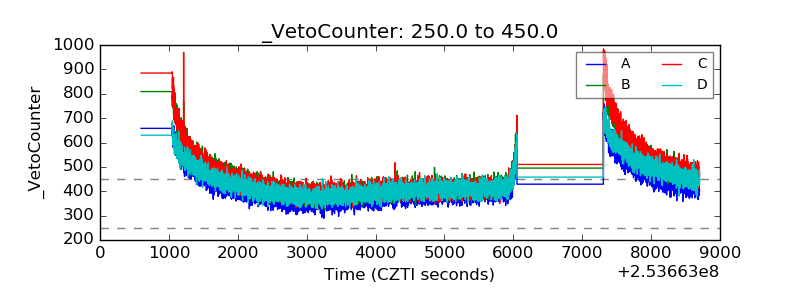 |