| Param | Original file | Final file |
|---|---|---|
| Filename | modeM0/AS1A04_141T01_9000001848_12432cztM0_level2.evt | modeM0/AS1A04_141T01_9000001848_12432cztM0_level2_quad_clean.evt |
| Size (bytes) | 476,040,960 | 92,053,440 |
| Size | 454.0 MB | 87.8 MB |
| Events in quadrant A | 3,524,903 | 584,872 |
| Events in quadrant B | 3,794,112 | 602,453 |
| Events in quadrant C | 3,318,800 | 599,719 |
| Events in quadrant D | 3,348,337 | 557,908 |
| Mode M9 | |||
|---|---|---|---|
| Quadrant | BADHDUFLAG | Total packets | Discarded packets |
| A | 0 | 16 | 0 |
| B | 0 | 16 | 0 |
| C | 0 | 16 | 0 |
| D | 0 | 17 | 0 |
| Mode M0 | |||
|---|---|---|---|
| Quadrant | BADHDUFLAG | Total packets | Discarded packets |
| A | 0 | 14409 | 3 |
| B | 0 | 15164 | 2 |
| C | 0 | 13685 | 2 |
| D | 0 | 14100 | 2 |
| Mode SS | |||
|---|---|---|---|
| Quadrant | BADHDUFLAG | Total packets | Discarded packets |
| A | 0 | 128 | 0 |
| B | 0 | 128 | 0 |
| C | 0 | 128 | 0 |
| D | 0 | 128 | 0 |
| Quadrant | Total seconds | Saturated seconds | Saturation percentage |
|---|---|---|---|
| A | 6348 | 22 | 0.346566% |
| B | 6348 | 163 | 2.567738% |
| C | 6348 | 27 | 0.425331% |
| D | 6348 | 92 | 1.449275% |
Noise dominated data is calculated using 1-second bins in cleaned event files. If a bin has >2000 counts, and if more than 50% of those come from <1% of pixels, then it is considered to be noise-dominated and hence unusable.
| Quadrant | # 1 sec bins | Bins with >0 counts | Bins with >2000 counts | High rate bins dominated by noise | Noise dominated (total time) | Noise dominated (detector-on time) | Marked lightcurve |
|---|---|---|---|---|---|---|---|
| A | 7669 | 6350 | 10 | 10 | 0.13% | 0.16% | 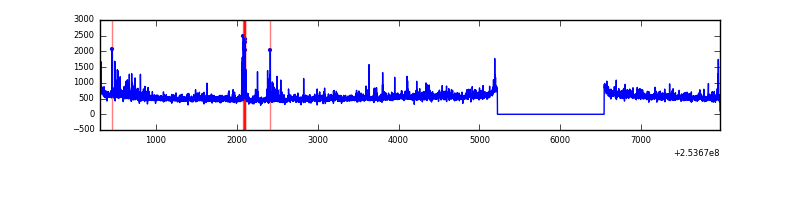 |
| B | 7669 | 6350 | 100 | 100 | 1.30% | 1.57% | 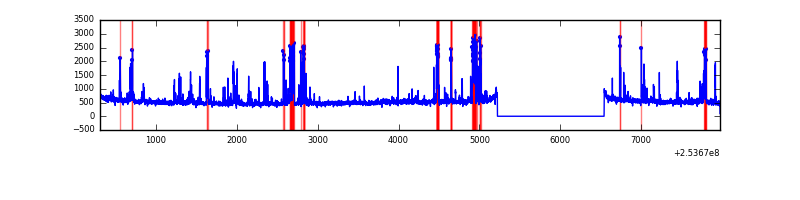 |
| C | 7669 | 6350 | 13 | 13 | 0.17% | 0.20% | 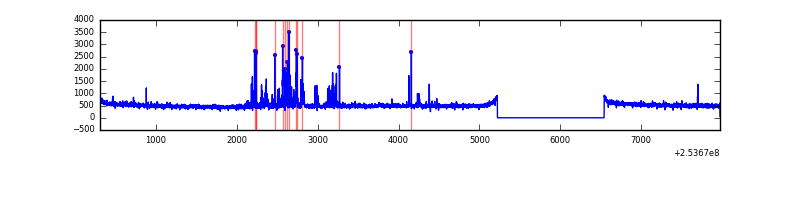 |
| D | 7669 | 6350 | 79 | 79 | 1.03% | 1.24% | 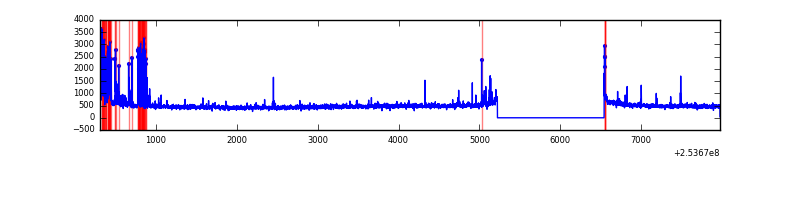 |
Top three noisy pixels from each quadrant. If the there are fewer than three noisy pixels in the level2.evt file, extra rows are filled as -1
| Pixel properties | Quadrant properties | ||||||
|---|---|---|---|---|---|---|---|
| Quadrant | DetID | PixID | Counts | Sigma | Mean | Median | Sigma |
| A | 13 | 251 | 219040 | 1359.91 | 797 | 782 | 160.5 |
| A | 1 | 162 | 81645 | 503.84 | 797 | 782 | 160.5 |
| A | 1 | 178 | 39226 | 239.53 | 797 | 782 | 160.5 |
| B | 4 | 239 | 597567 | 3978.58 | 806 | 789 | 150.0 |
| B | 12 | 111 | 16767 | 106.52 | 806 | 789 | 150.0 |
| B | 11 | 51 | 16544 | 105.03 | 806 | 789 | 150.0 |
| C | 15 | 208 | 206836 | 1128.29 | 798 | 804 | 182.6 |
| C | 13 | 61 | 5835 | 27.55 | 798 | 804 | 182.6 |
| C | 1 | 16 | 2374 | 8.6 | 798 | 804 | 182.6 |
| D | 1 | 52 | 285885 | 1568.31 | 776 | 755 | 181.8 |
| D | 10 | 199 | 34748 | 186.97 | 776 | 755 | 181.8 |
| D | 8 | 195 | 26987 | 144.29 | 776 | 755 | 181.8 |
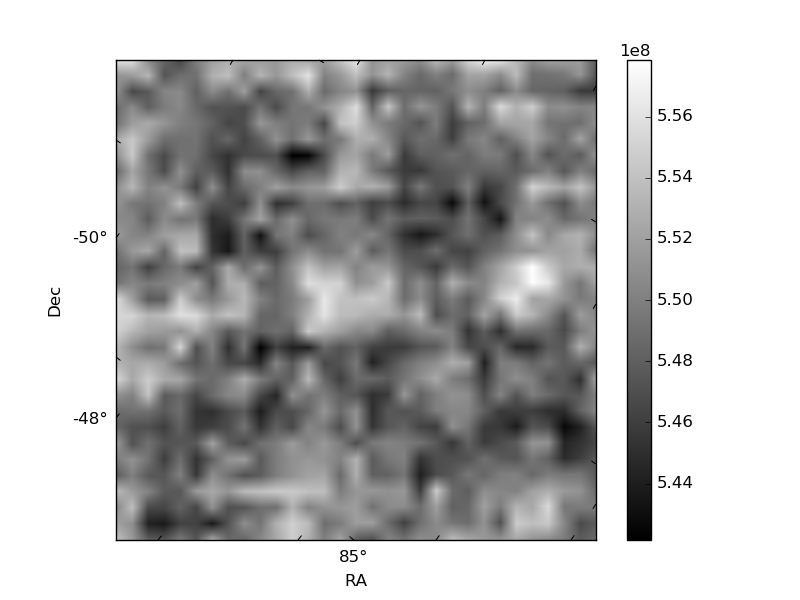
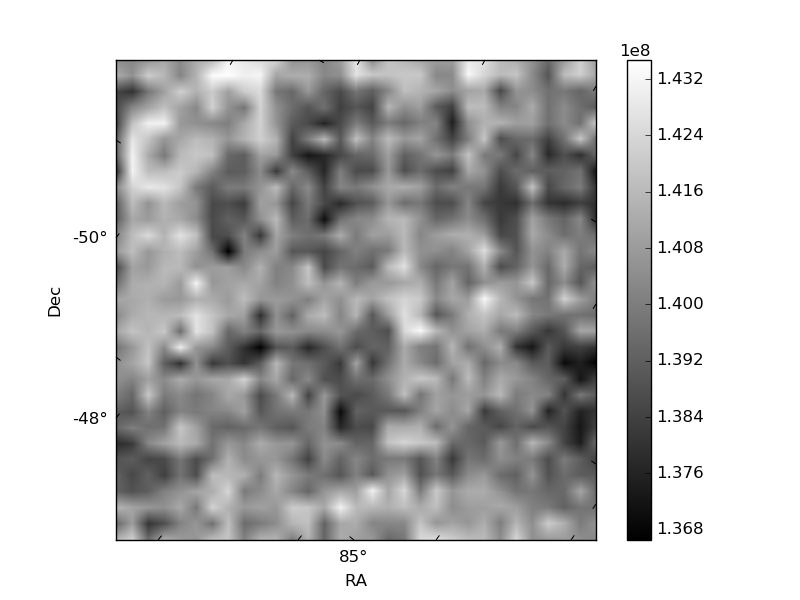
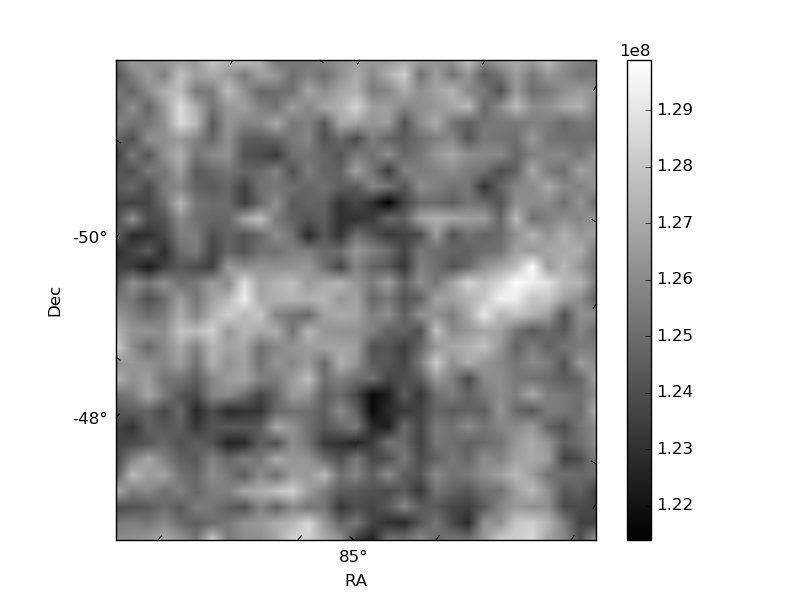
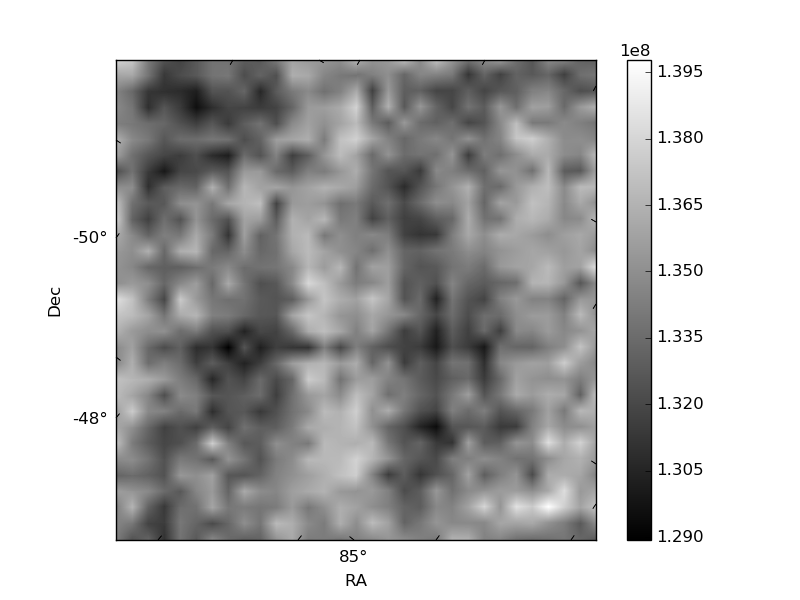
Histogram calculated using DETX and DETY for each event in the final _common_clean file
| Quadrant A | 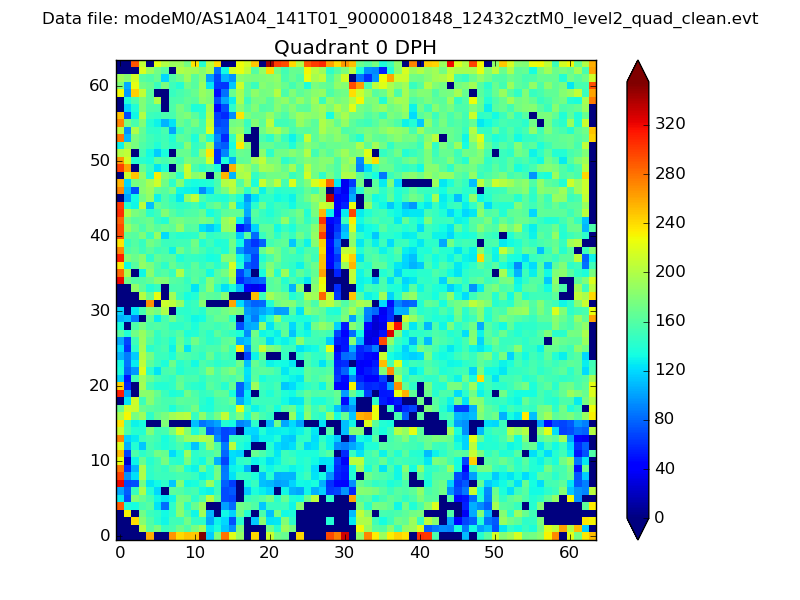 |
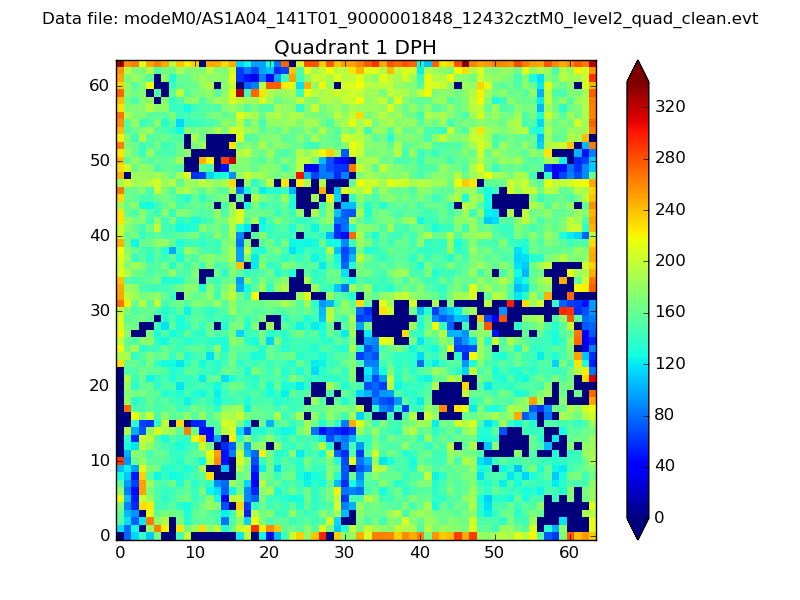 |
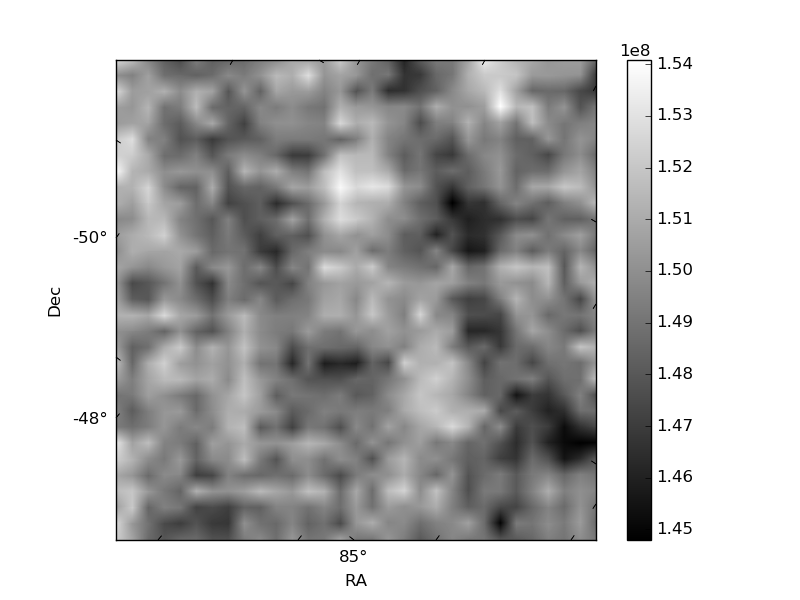
Quadrant B |
|---|---|---|---|
| Quadrant D | 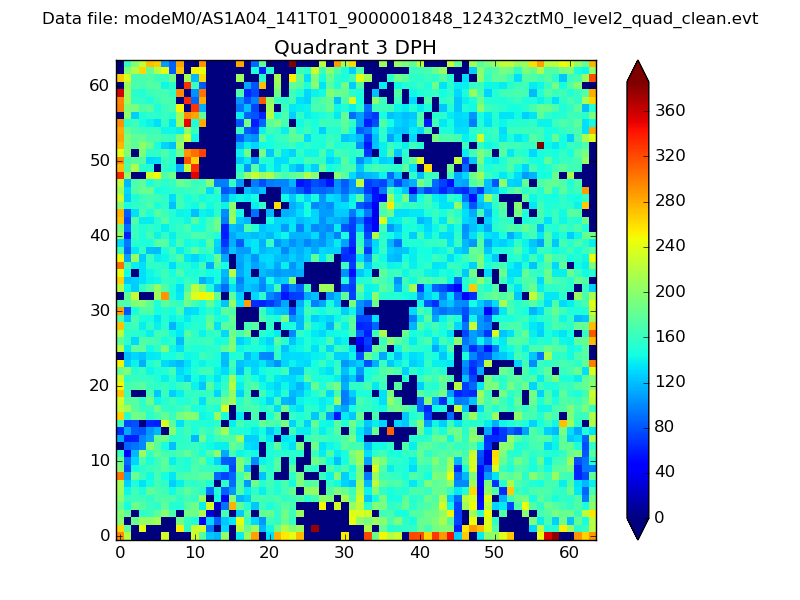 |
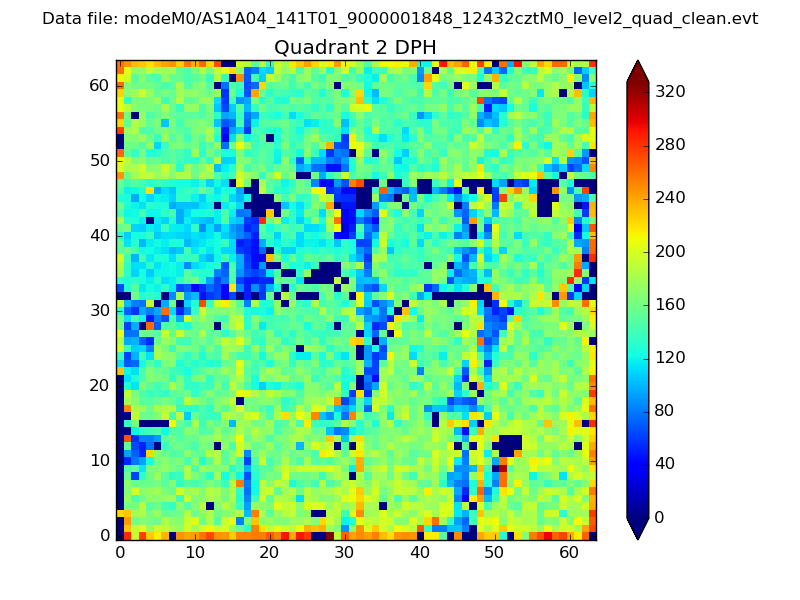 |
Quadrant C |
| Plot type | Count rate plots | Images |
|---|---|---|
| Comparison with Poisson distribution Blue bars denote a histogram of data divided into 1 sec bins. Red curve is a Poisson curve with rate = median count rate of data. |
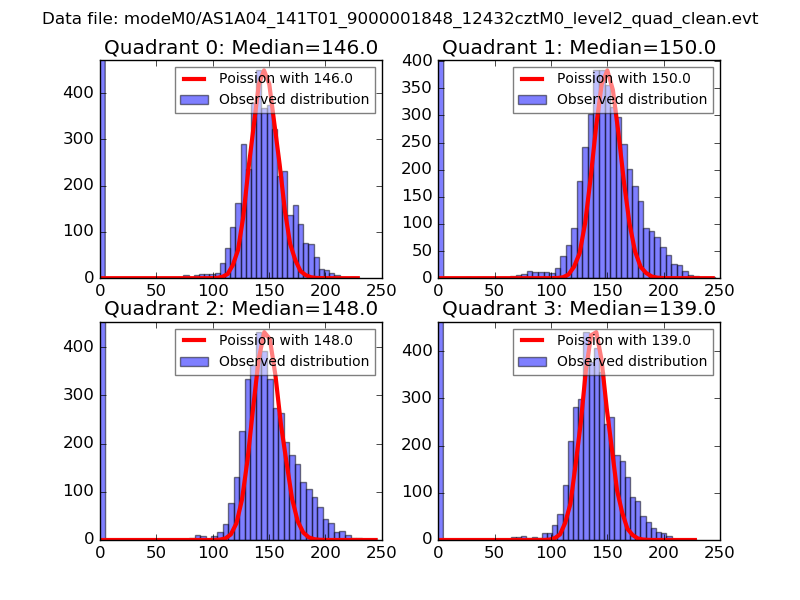 |
 |
| Quadrant-wise count rates Data is divided into 100 sec bins |
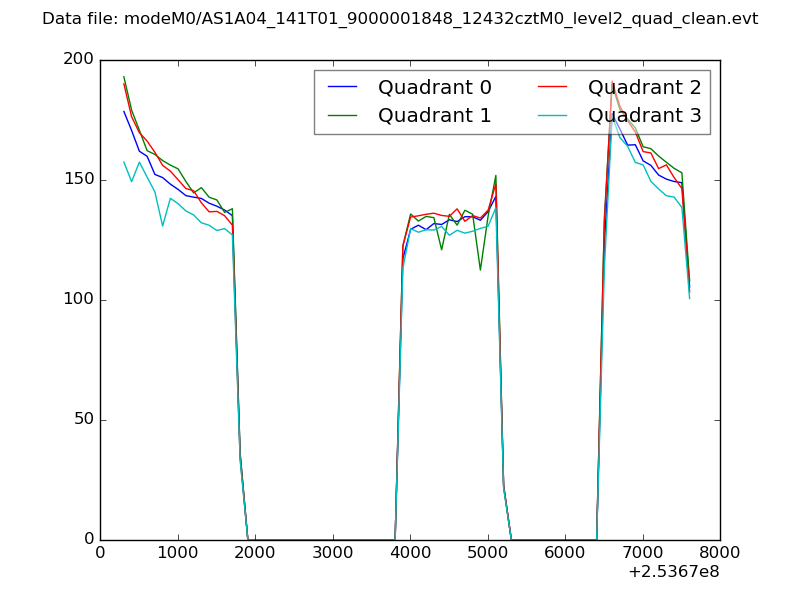 |
|
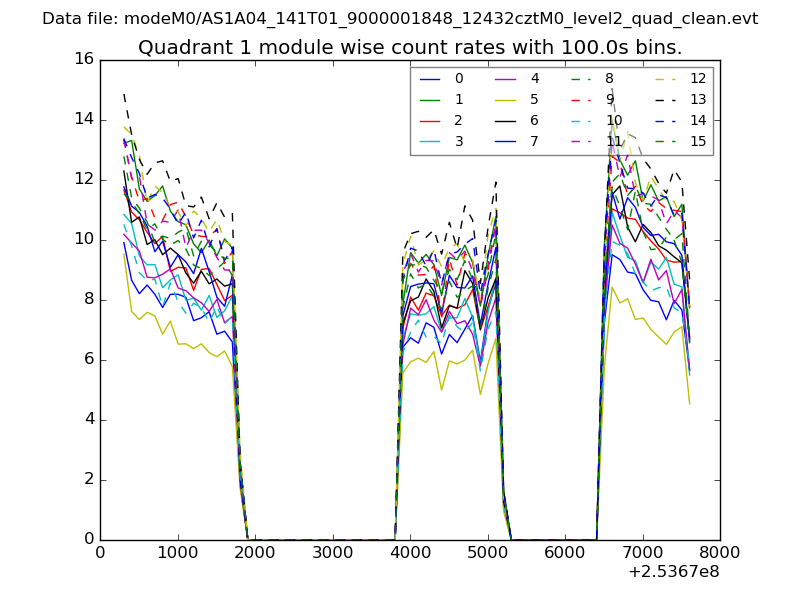
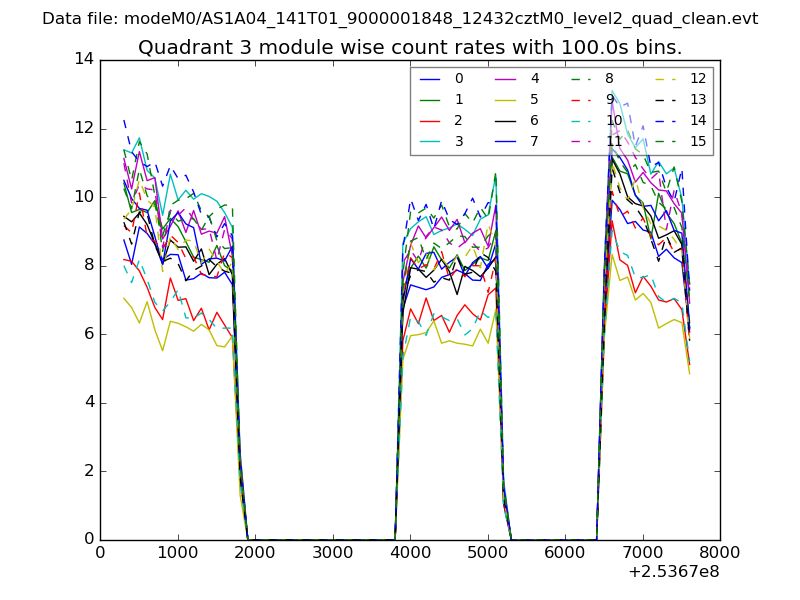
| Module-wise count rates for Quadrant A Data is divided into 100 sec bins |
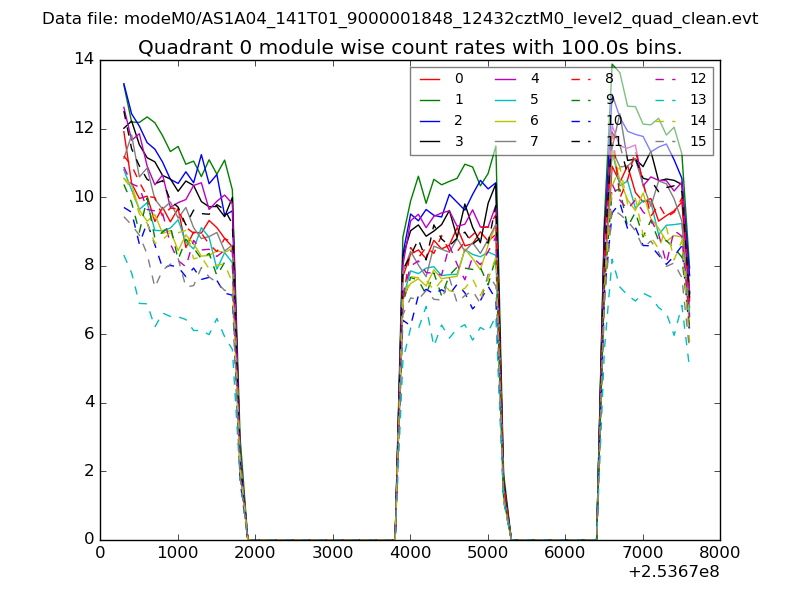 |
 |
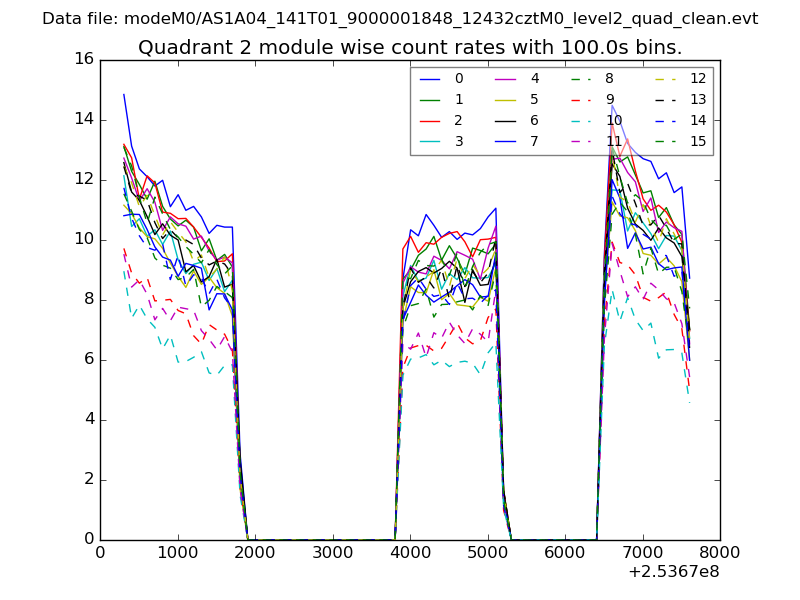
| Module-wise count rates for Quadrant B Data is divided into 100 sec bins |
 |
 |
| Module-wise count rates for Quadrant C Data is divided into 100 sec bins |
 |
 |
| Module-wise count rates for Quadrant D Data is divided into 100 sec bins |
 |
 |
| Parameter | Plot |
|---|---|
| CZT HV Monitor | 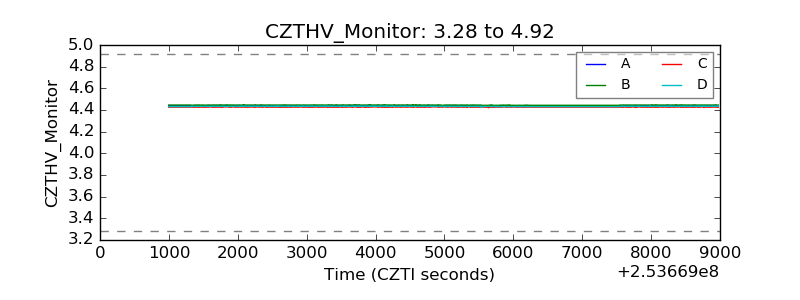 |
| D_VDD | 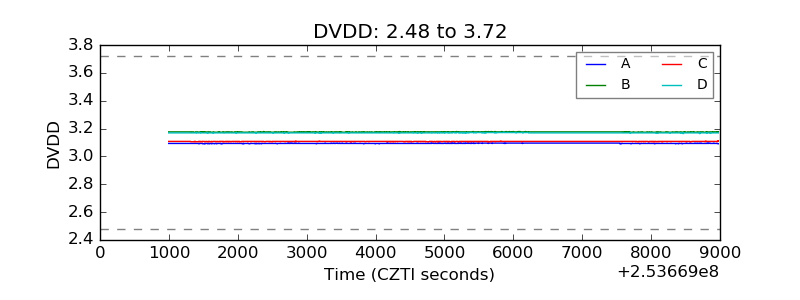 |
| Temperature 1 | 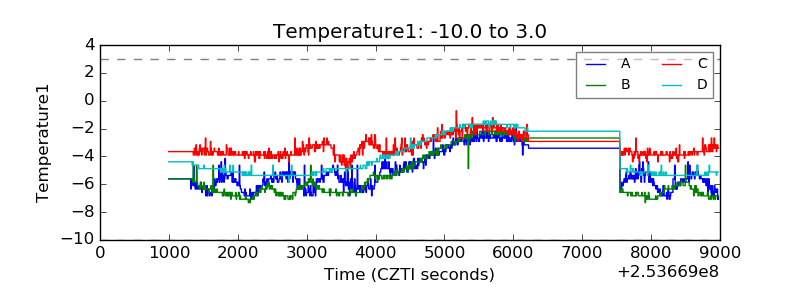 |
| Veto HV Monitor | 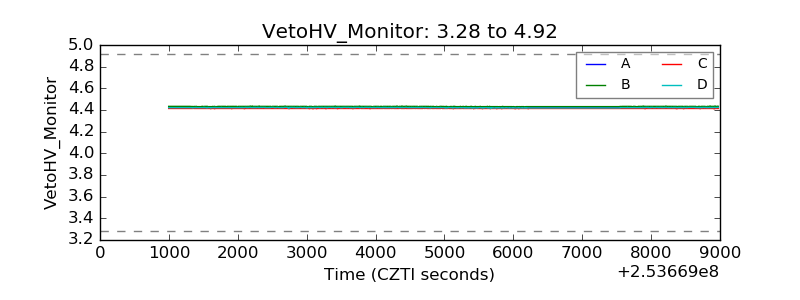 |
| Veto LLD | 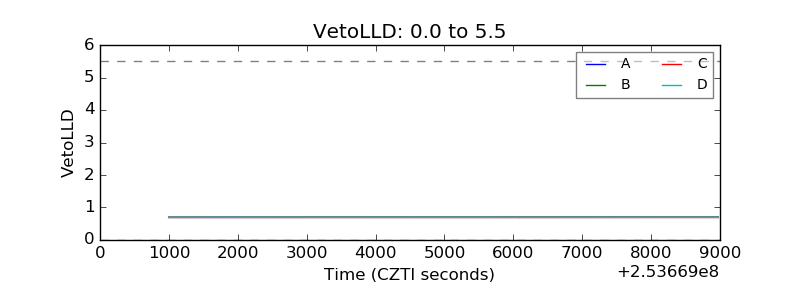 |
| Alpha Counter | 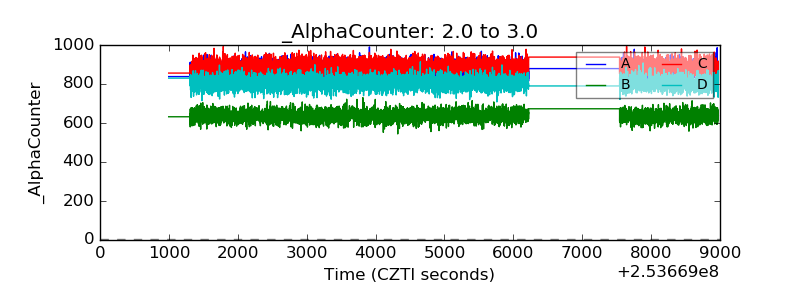 |
| _CPM_Rate | 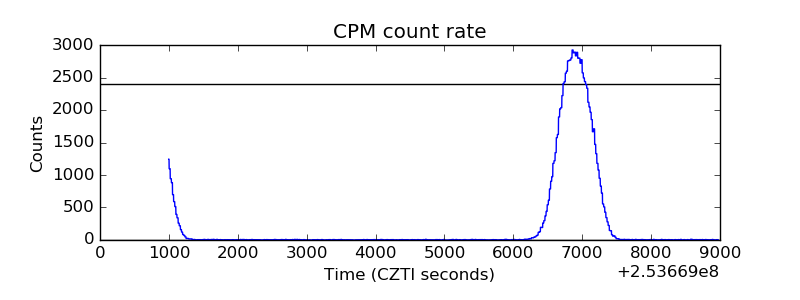 |
| CZT Counter | 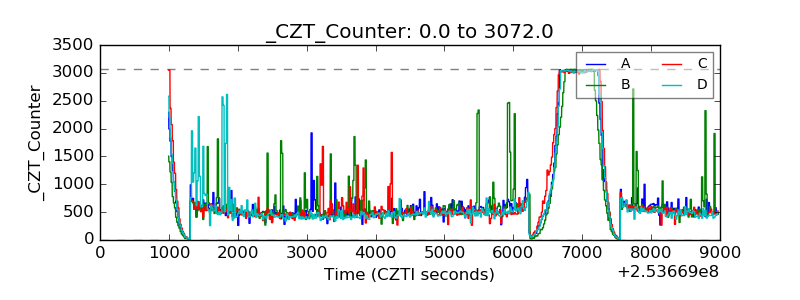 |
| +2.5 Volts monitor |  |
| +5 Volts monitor |  |
| _ROLL_ROT | 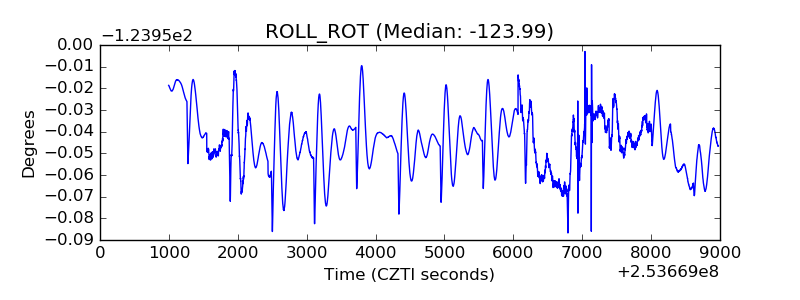 |
| _Roll_DEC | 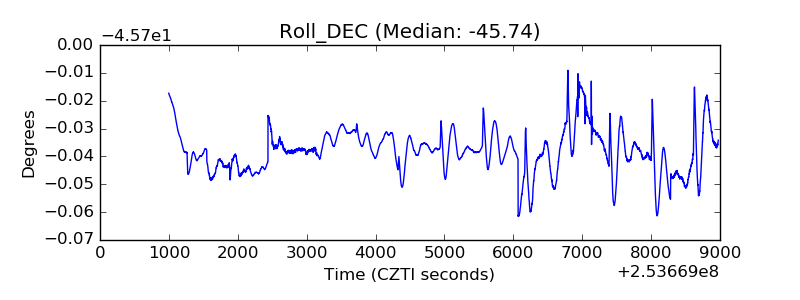 |
| _Roll_RA | 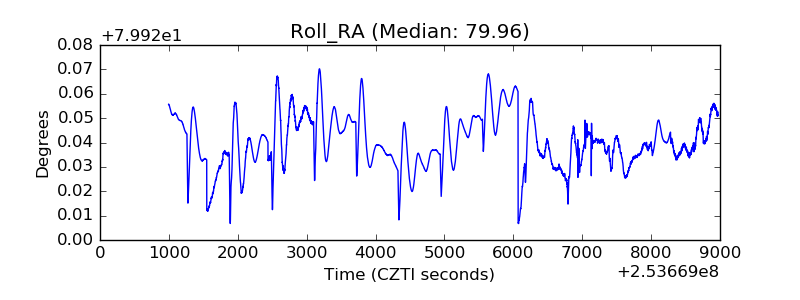 |
| Veto Counter | 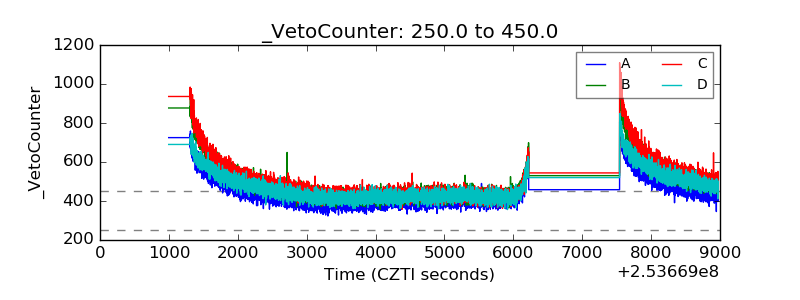 |