| Param | Original file | Final file |
|---|---|---|
| Filename | modeM0/AS1A04_141T01_9000001848_12433cztM0_level2.evt | modeM0/AS1A04_141T01_9000001848_12433cztM0_level2_quad_clean.evt |
| Size (bytes) | 463,115,520 | 84,744,000 |
| Size | 441.7 MB | 80.8 MB |
| Events in quadrant A | 3,535,606 | 527,293 |
| Events in quadrant B | 3,764,161 | 540,247 |
| Events in quadrant C | 3,170,295 | 543,821 |
| Events in quadrant D | 3,124,644 | 512,463 |
| Mode M9 | |||
|---|---|---|---|
| Quadrant | BADHDUFLAG | Total packets | Discarded packets |
| A | 0 | 14 | 0 |
| B | 0 | 14 | 0 |
| C | 0 | 14 | 0 |
| D | 0 | 15 | 0 |
| Mode M0 | |||
|---|---|---|---|
| Quadrant | BADHDUFLAG | Total packets | Discarded packets |
| A | 0 | 14357 | 3 |
| B | 0 | 15010 | 2 |
| C | 0 | 13129 | 2 |
| D | 0 | 13261 | 2 |
| Mode SS | |||
|---|---|---|---|
| Quadrant | BADHDUFLAG | Total packets | Discarded packets |
| A | 0 | 130 | 0 |
| B | 0 | 130 | 0 |
| C | 0 | 130 | 0 |
| D | 0 | 130 | 0 |
| Quadrant | Total seconds | Saturated seconds | Saturation percentage |
|---|---|---|---|
| A | 6337 | 28 | 0.441849% |
| B | 6337 | 158 | 2.493293% |
| C | 6337 | 8 | 0.126243% |
| D | 6337 | 15 | 0.236705% |
Noise dominated data is calculated using 1-second bins in cleaned event files. If a bin has >2000 counts, and if more than 50% of those come from <1% of pixels, then it is considered to be noise-dominated and hence unusable.
| Quadrant | # 1 sec bins | Bins with >0 counts | Bins with >2000 counts | High rate bins dominated by noise | Noise dominated (total time) | Noise dominated (detector-on time) | Marked lightcurve |
|---|---|---|---|---|---|---|---|
| A | 7688 | 6338 | 6 | 6 | 0.08% | 0.09% | 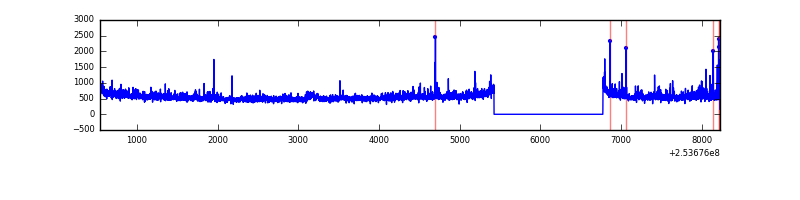 |
| B | 7688 | 6338 | 94 | 94 | 1.22% | 1.48% | 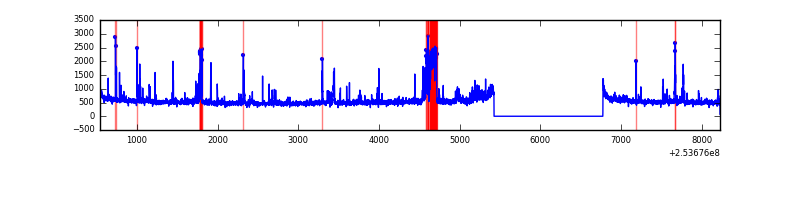 |
| C | 7688 | 6339 | 0 | 0 | 0.00% | 0.00% | 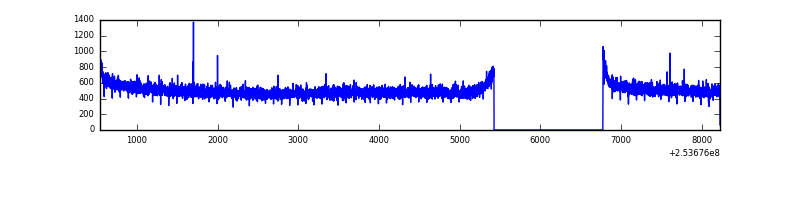 |
| D | 7688 | 6339 | 6 | 6 | 0.08% | 0.09% | 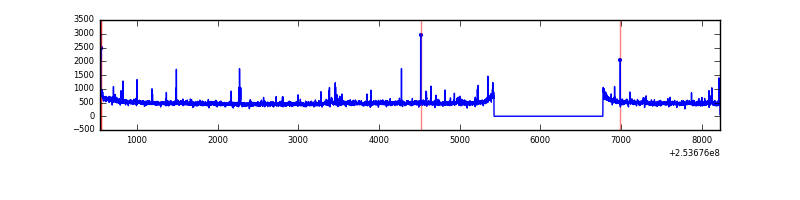 |
Top three noisy pixels from each quadrant. If the there are fewer than three noisy pixels in the level2.evt file, extra rows are filled as -1
| Pixel properties | Quadrant properties | ||||||
|---|---|---|---|---|---|---|---|
| Quadrant | DetID | PixID | Counts | Sigma | Mean | Median | Sigma |
| A | 13 | 251 | 140933 | 863.49 | 807 | 792 | 162.3 |
| A | 1 | 162 | 95159 | 581.45 | 807 | 792 | 162.3 |
| A | 1 | 178 | 47721 | 289.16 | 807 | 792 | 162.3 |
| B | 4 | 239 | 503317 | 3320.35 | 815 | 796 | 151.3 |
| B | 11 | 51 | 22948 | 146.37 | 815 | 796 | 151.3 |
| B | 3 | 64 | 18512 | 117.06 | 815 | 796 | 151.3 |
| C | 13 | 61 | 6063 | 28.38 | 812 | 814 | 184.9 |
| C | 15 | 208 | 4033 | 17.41 | 812 | 814 | 184.9 |
| C | 3 | 202 | 1998 | 6.4 | 812 | 814 | 184.9 |
| D | 1 | 52 | 27472 | 142.56 | 793 | 772 | 187.3 |
| D | 2 | 234 | 18815 | 96.34 | 793 | 772 | 187.3 |
| D | 8 | 195 | 18662 | 95.52 | 793 | 772 | 187.3 |
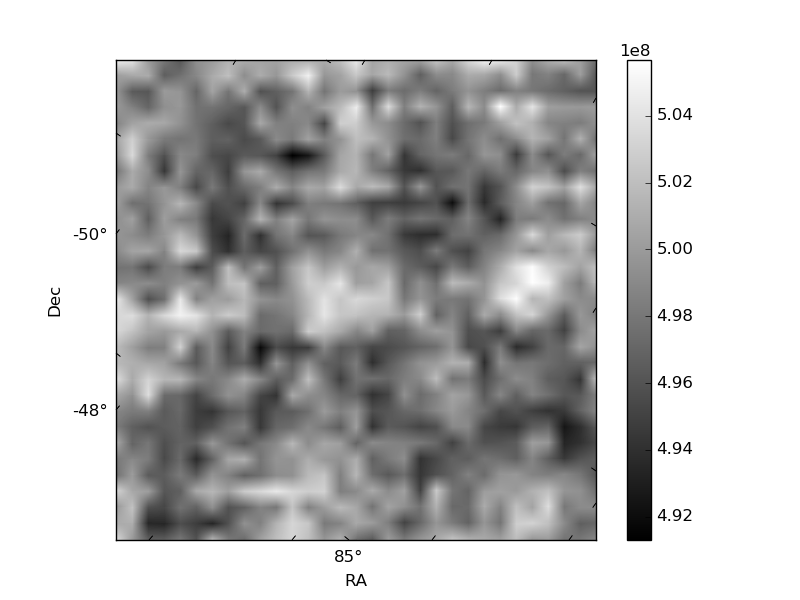
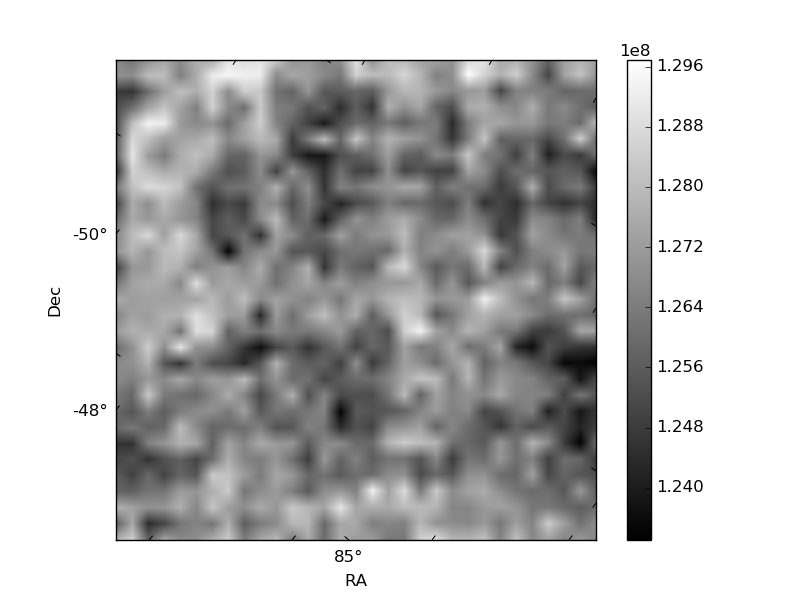
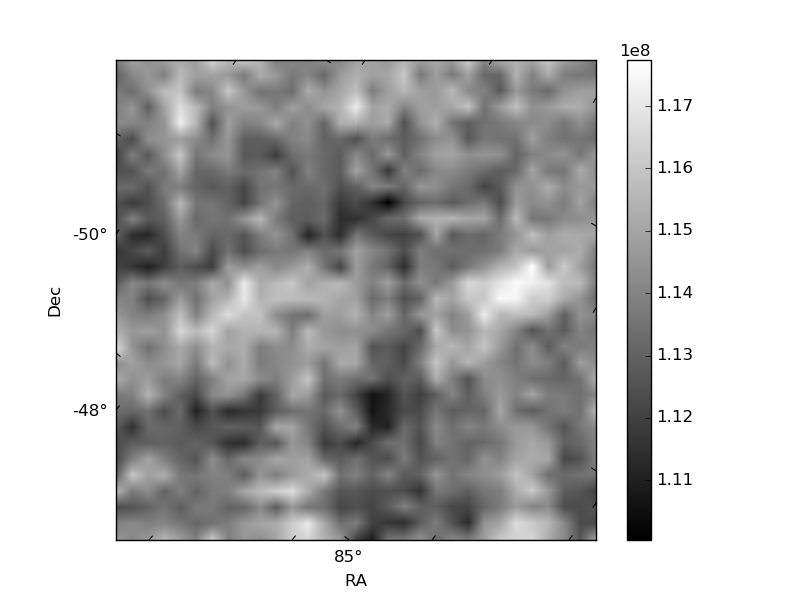
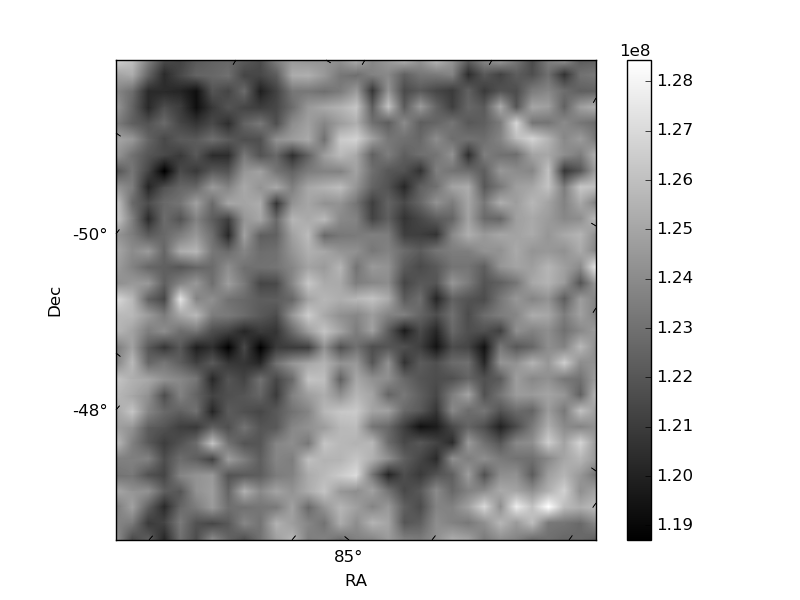
Histogram calculated using DETX and DETY for each event in the final _common_clean file
| Quadrant A | 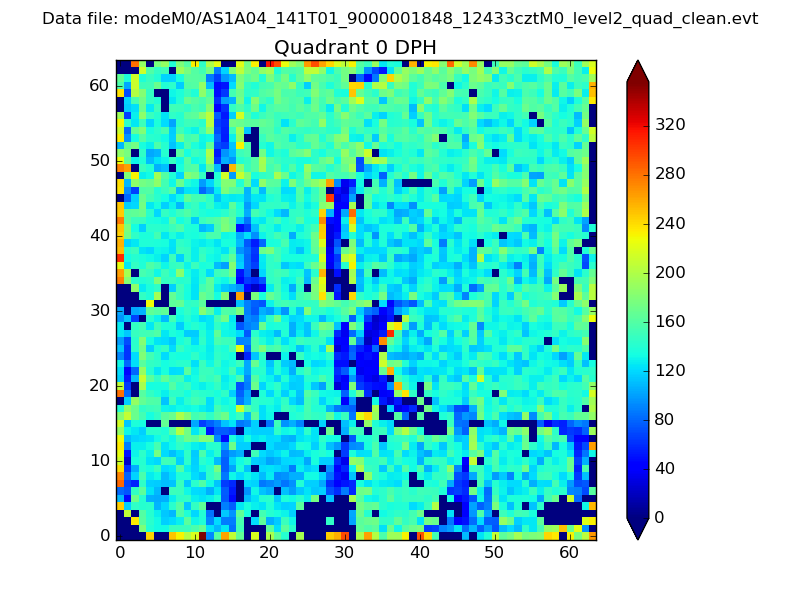 |
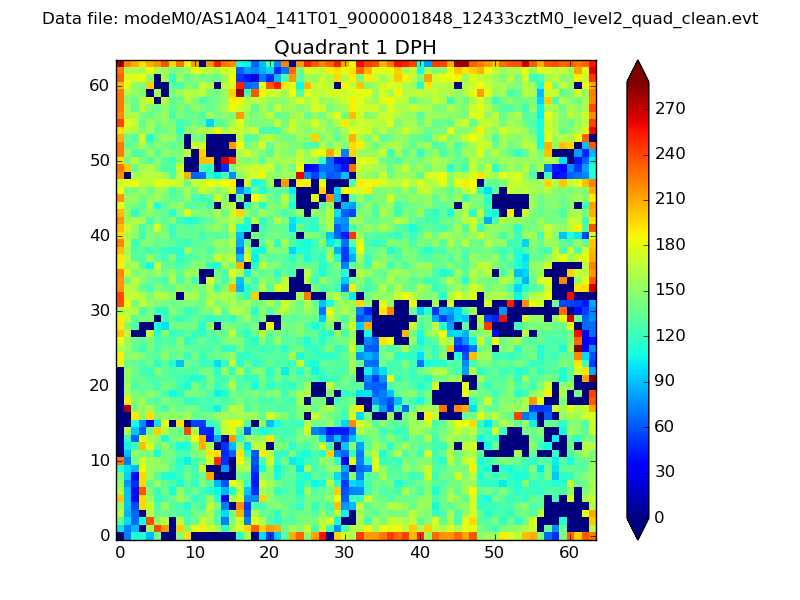 |
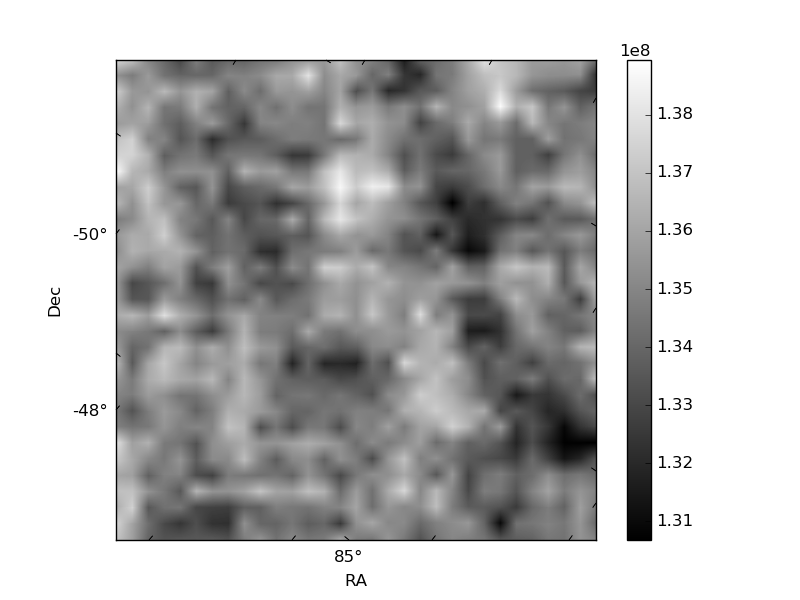
Quadrant B |
|---|---|---|---|
| Quadrant D | 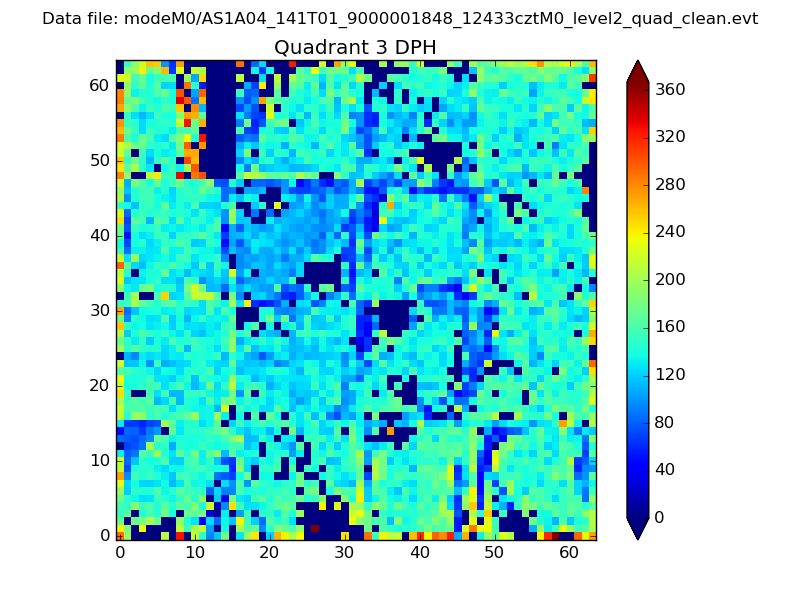 |
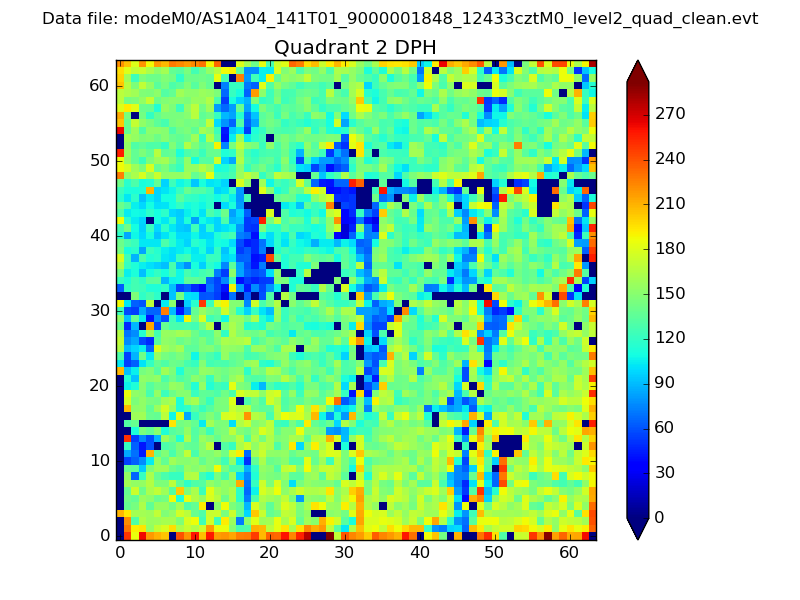 |
Quadrant C |
| Plot type | Count rate plots | Images |
|---|---|---|
| Comparison with Poisson distribution Blue bars denote a histogram of data divided into 1 sec bins. Red curve is a Poisson curve with rate = median count rate of data. |
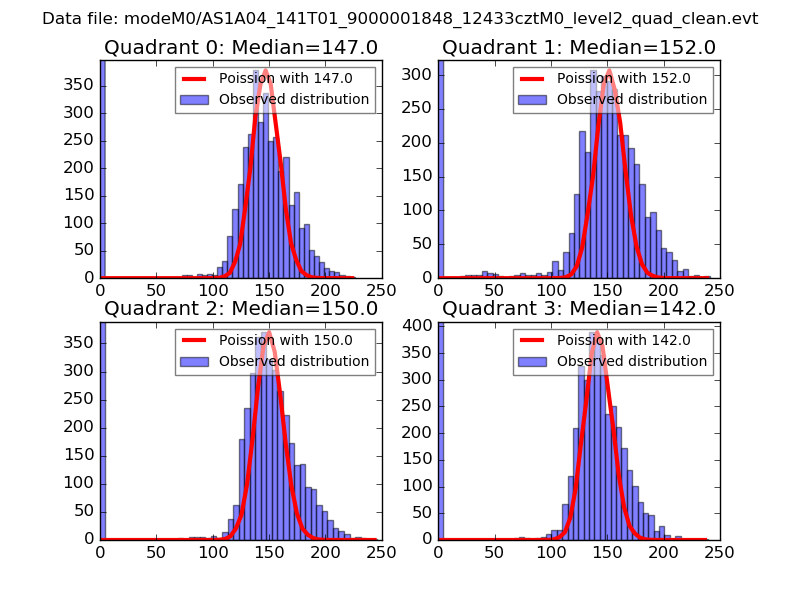 |
 |
| Quadrant-wise count rates Data is divided into 100 sec bins |
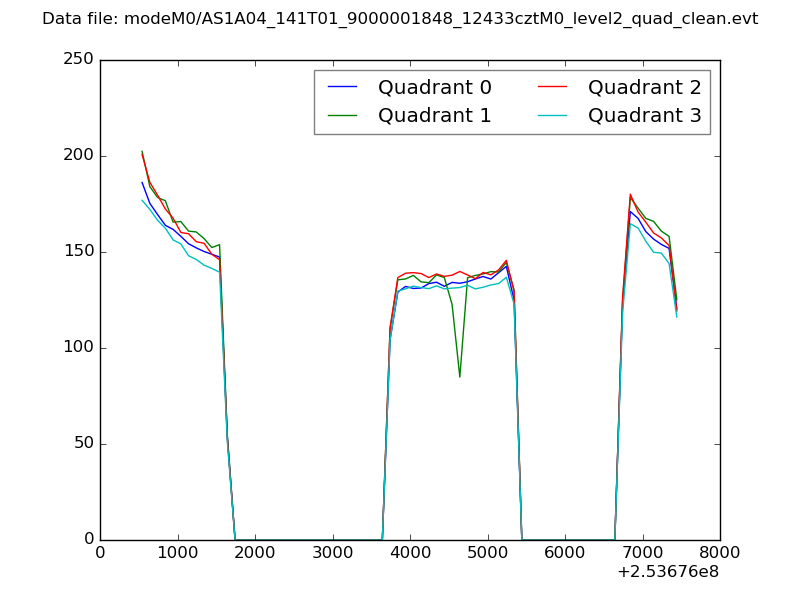 |
|
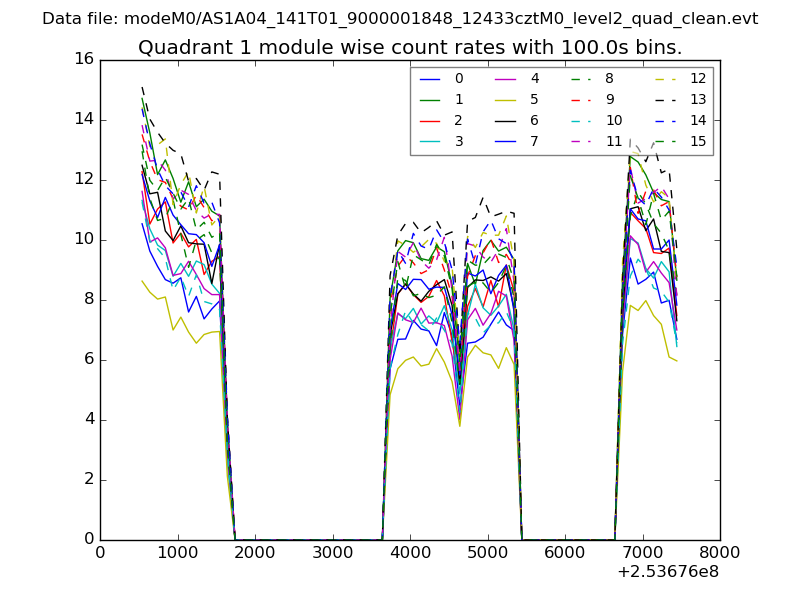
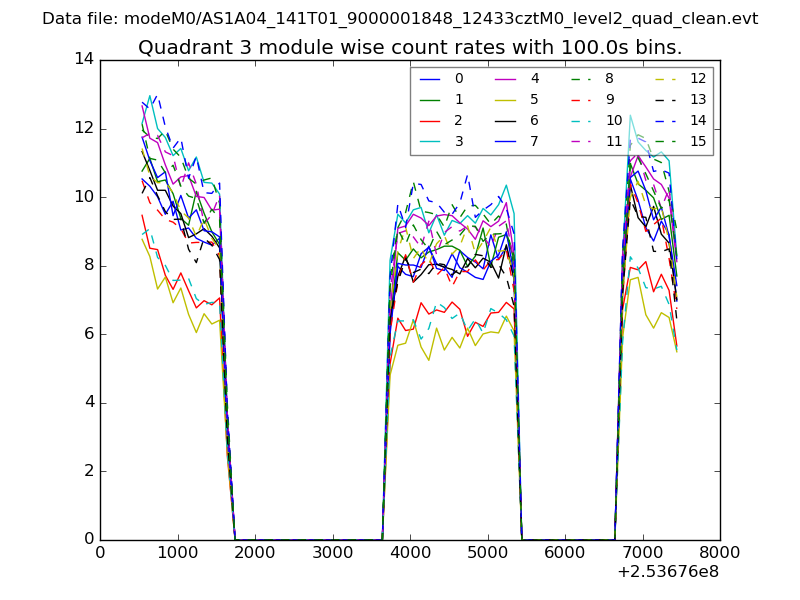
| Module-wise count rates for Quadrant A Data is divided into 100 sec bins |
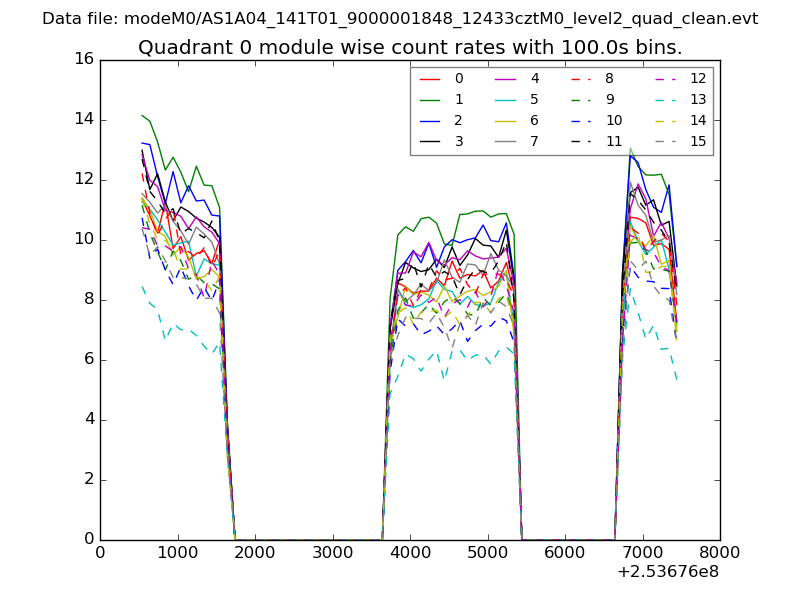 |
 |
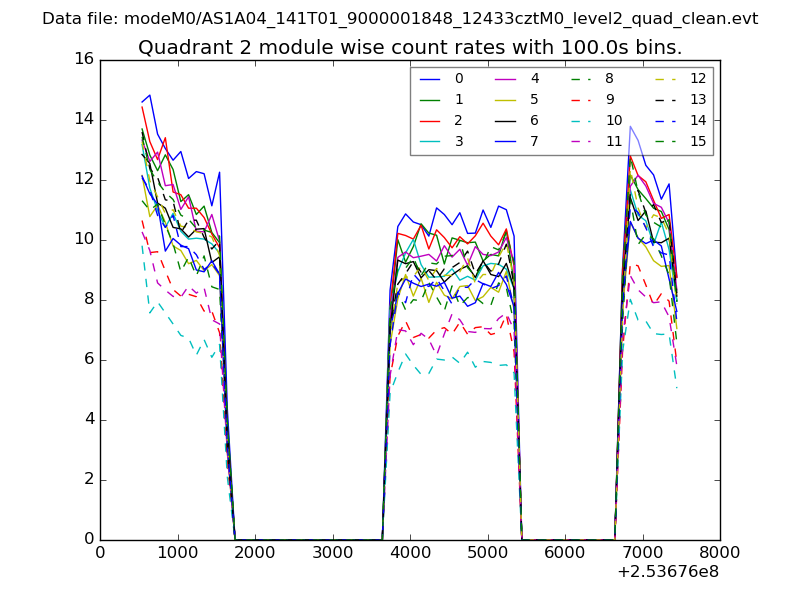
| Module-wise count rates for Quadrant B Data is divided into 100 sec bins |
 |
 |
| Module-wise count rates for Quadrant C Data is divided into 100 sec bins |
 |
 |
| Module-wise count rates for Quadrant D Data is divided into 100 sec bins |
 |
 |
| Parameter | Plot |
|---|---|
| CZT HV Monitor | 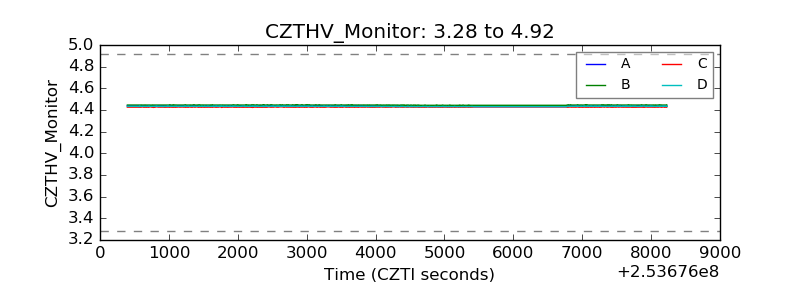 |
| D_VDD | 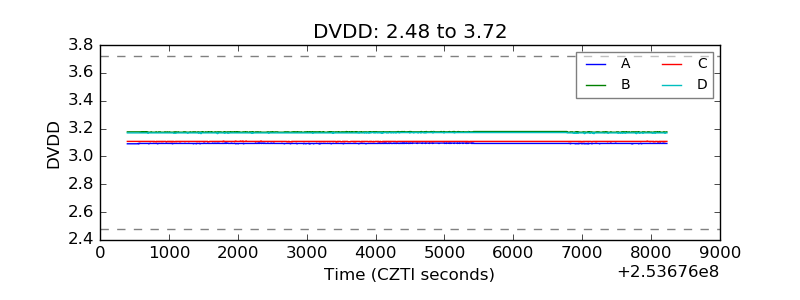 |
| Temperature 1 | 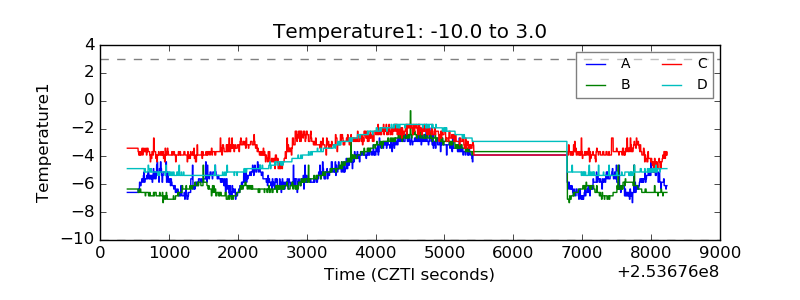 |
| Veto HV Monitor | 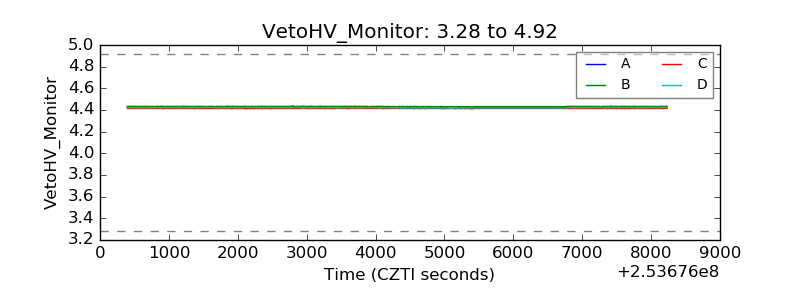 |
| Veto LLD | 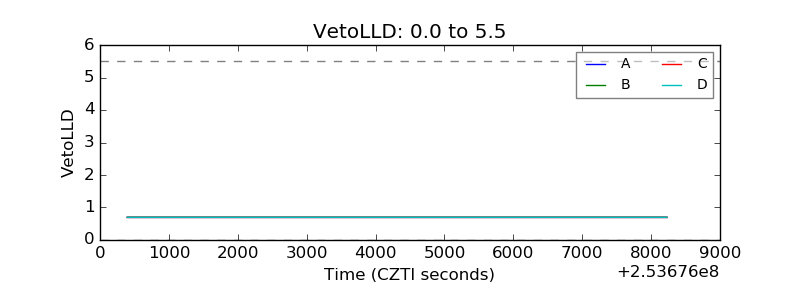 |
| Alpha Counter | 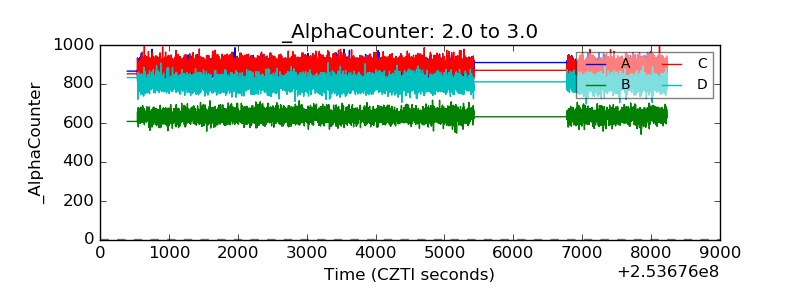 |
| _CPM_Rate | 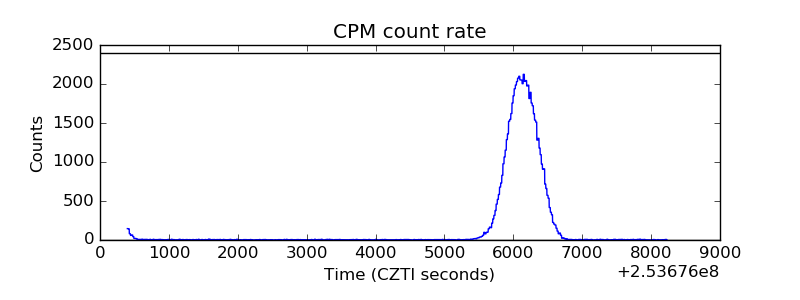 |
| CZT Counter | 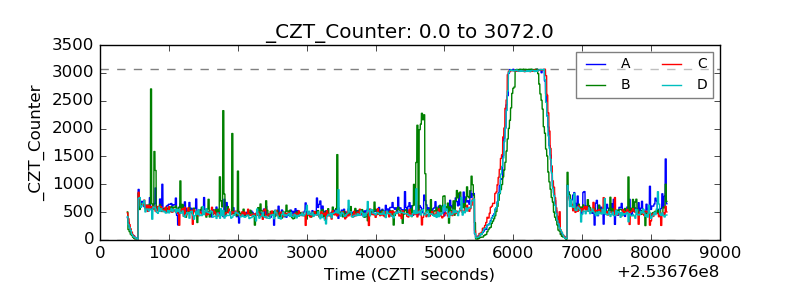 |
| +2.5 Volts monitor |  |
| +5 Volts monitor | 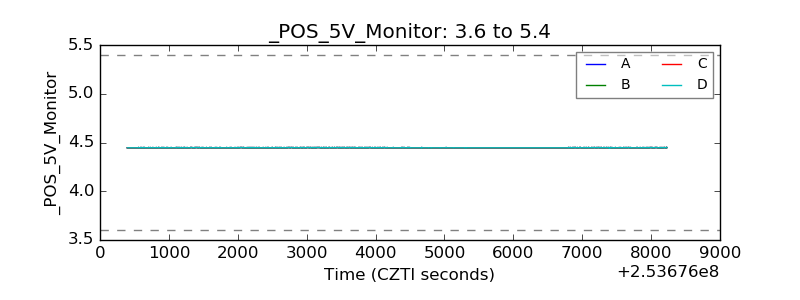 |
| _ROLL_ROT | 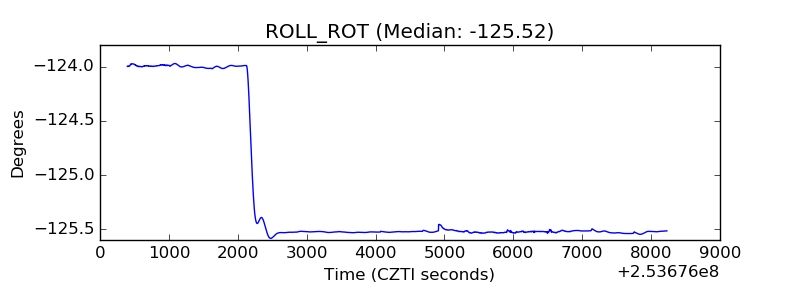 |
| _Roll_DEC | 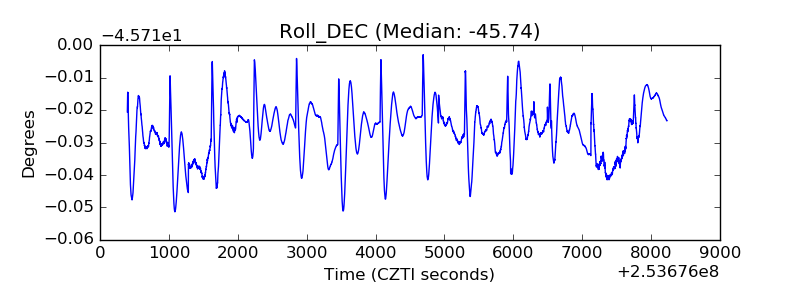 |
| _Roll_RA | 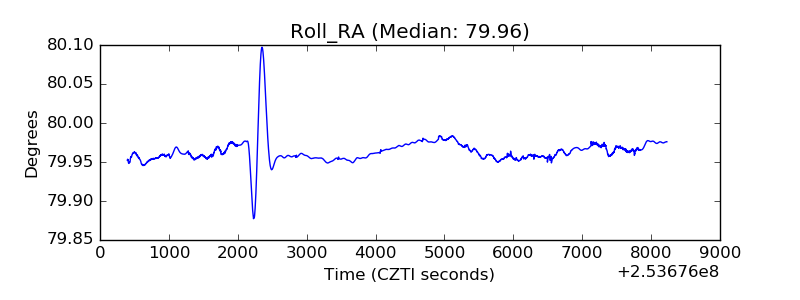 |
| Veto Counter | 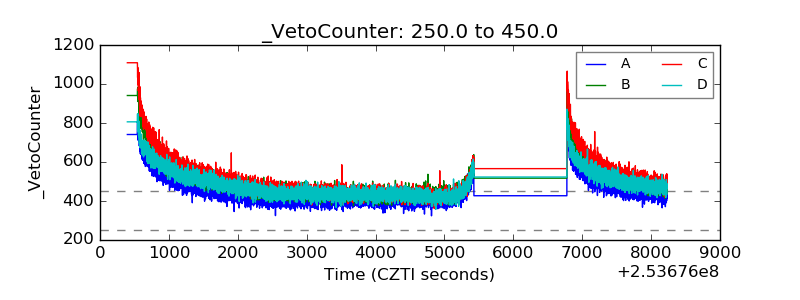 |