| Param | Original file | Final file |
|---|---|---|
| Filename | modeM0/AS1A04_141T01_9000001848_12434cztM0_level2.evt | modeM0/AS1A04_141T01_9000001848_12434cztM0_level2_quad_clean.evt |
| Size (bytes) | 489,277,440 | 76,368,960 |
| Size | 466.6 MB | 72.8 MB |
| Events in quadrant A | 3,690,610 | 466,245 |
| Events in quadrant B | 3,944,911 | 472,940 |
| Events in quadrant C | 3,189,155 | 478,056 |
| Events in quadrant D | 3,559,169 | 449,097 |
| Mode M9 | |||
|---|---|---|---|
| Quadrant | BADHDUFLAG | Total packets | Discarded packets |
| A | 0 | 26 | 0 |
| B | 0 | 26 | 0 |
| C | 0 | 26 | 0 |
| D | 0 | 26 | 0 |
| Mode M0 | |||
|---|---|---|---|
| Quadrant | BADHDUFLAG | Total packets | Discarded packets |
| A | 0 | 14927 | 3 |
| B | 0 | 15646 | 2 |
| C | 0 | 13347 | 2 |
| D | 0 | 14667 | 2 |
| Mode SS | |||
|---|---|---|---|
| Quadrant | BADHDUFLAG | Total packets | Discarded packets |
| A | 0 | 134 | 0 |
| B | 0 | 134 | 0 |
| C | 0 | 134 | 0 |
| D | 0 | 134 | 0 |
| Quadrant | Total seconds | Saturated seconds | Saturation percentage |
|---|---|---|---|
| A | 6385 | 62 | 0.971026% |
| B | 6385 | 204 | 3.194988% |
| C | 6385 | 45 | 0.704777% |
| D | 6385 | 91 | 1.425215% |
Noise dominated data is calculated using 1-second bins in cleaned event files. If a bin has >2000 counts, and if more than 50% of those come from <1% of pixels, then it is considered to be noise-dominated and hence unusable.
| Quadrant | # 1 sec bins | Bins with >0 counts | Bins with >2000 counts | High rate bins dominated by noise | Noise dominated (total time) | Noise dominated (detector-on time) | Marked lightcurve |
|---|---|---|---|---|---|---|---|
| A | 9011 | 6387 | 5 | 5 | 0.06% | 0.08% | 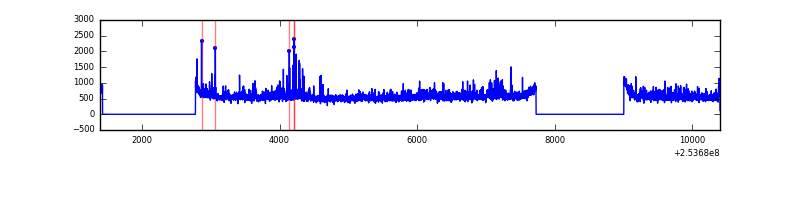 |
| B | 9011 | 6386 | 71 | 71 | 0.79% | 1.11% | 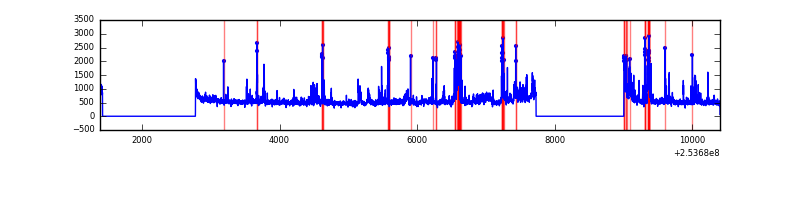 |
| C | 9011 | 6387 | 4 | 4 | 0.04% | 0.06% | 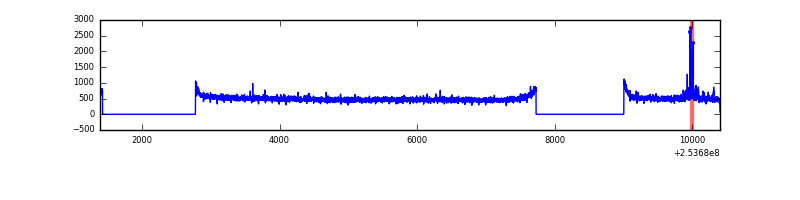 |
| D | 9011 | 6388 | 61 | 61 | 0.68% | 0.95% | 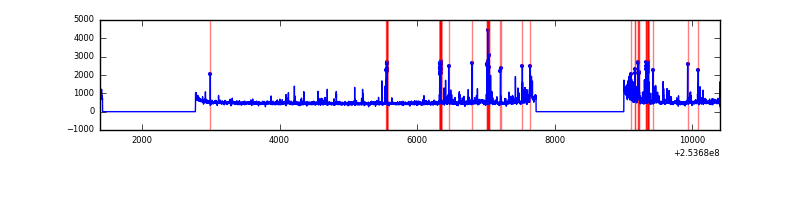 |
Top three noisy pixels from each quadrant. If the there are fewer than three noisy pixels in the level2.evt file, extra rows are filled as -1
| Pixel properties | Quadrant properties | ||||||
|---|---|---|---|---|---|---|---|
| Quadrant | DetID | PixID | Counts | Sigma | Mean | Median | Sigma |
| A | 13 | 251 | 193818 | 1195.8 | 808 | 793 | 161.4 |
| A | 1 | 162 | 132446 | 815.6 | 808 | 793 | 161.4 |
| A | 1 | 178 | 68019 | 416.47 | 808 | 793 | 161.4 |
| B | 4 | 239 | 451229 | 2979.79 | 812 | 795 | 151.2 |
| B | 3 | 64 | 220622 | 1454.24 | 812 | 795 | 151.2 |
| B | 0 | 187 | 40872 | 265.12 | 812 | 795 | 151.2 |
| C | 15 | 208 | 46223 | 248.31 | 806 | 810 | 182.9 |
| C | 13 | 61 | 5932 | 28.01 | 806 | 810 | 182.9 |
| C | 3 | 202 | 2097 | 7.04 | 806 | 810 | 182.9 |
| D | 1 | 52 | 460618 | 2440.16 | 790 | 767 | 188.5 |
| D | 7 | 80 | 52376 | 273.86 | 790 | 767 | 188.5 |
| D | 8 | 195 | 29931 | 154.76 | 790 | 767 | 188.5 |
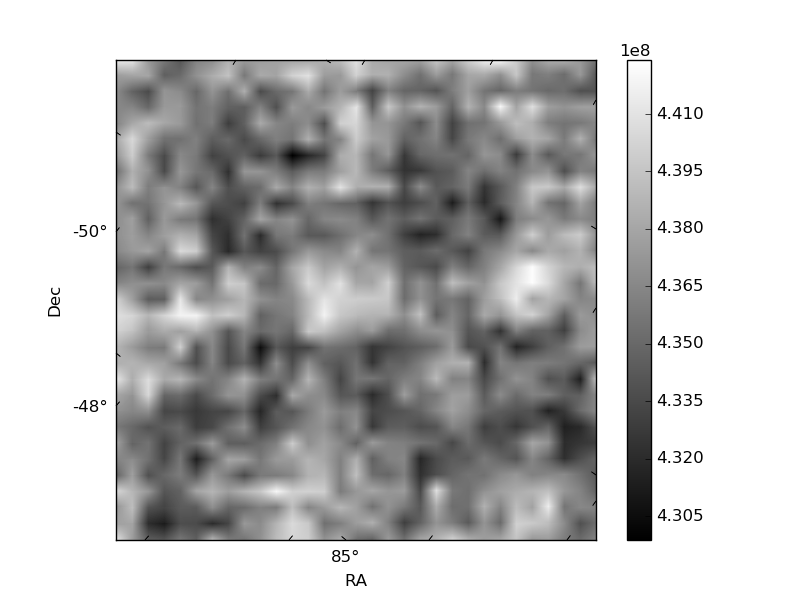
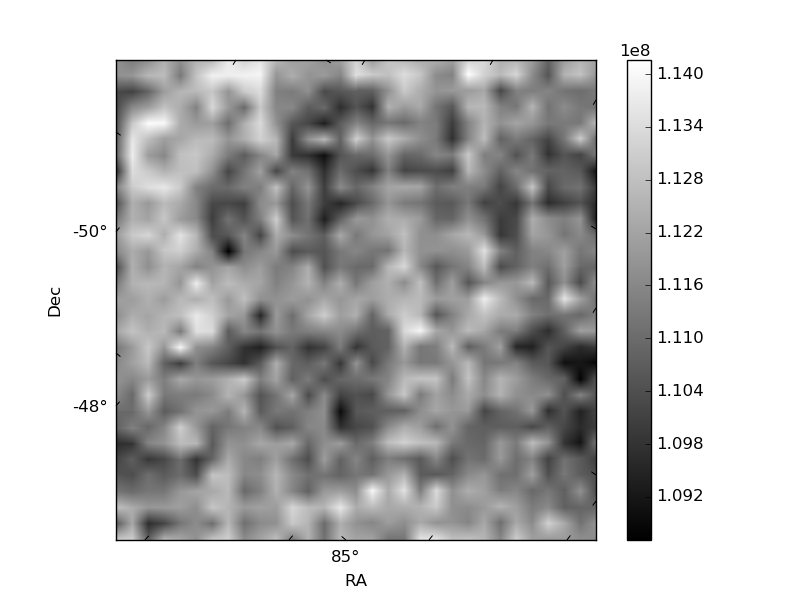
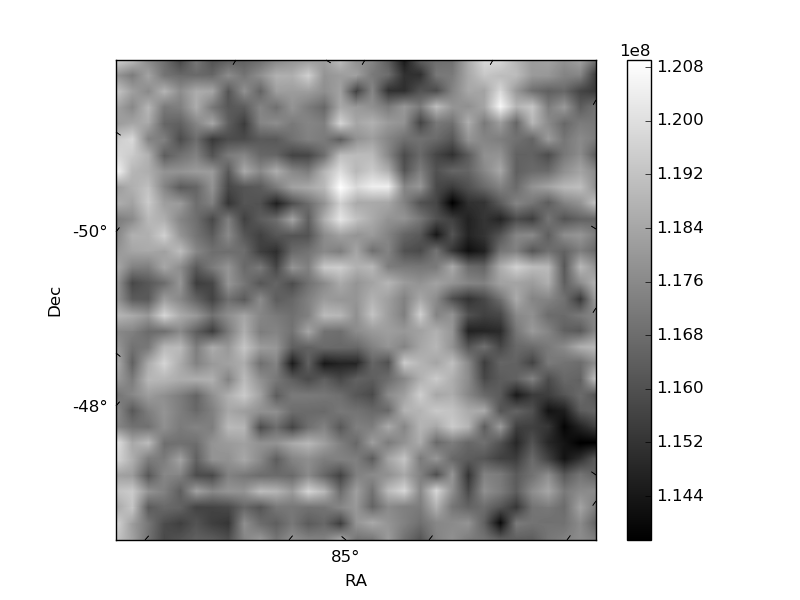
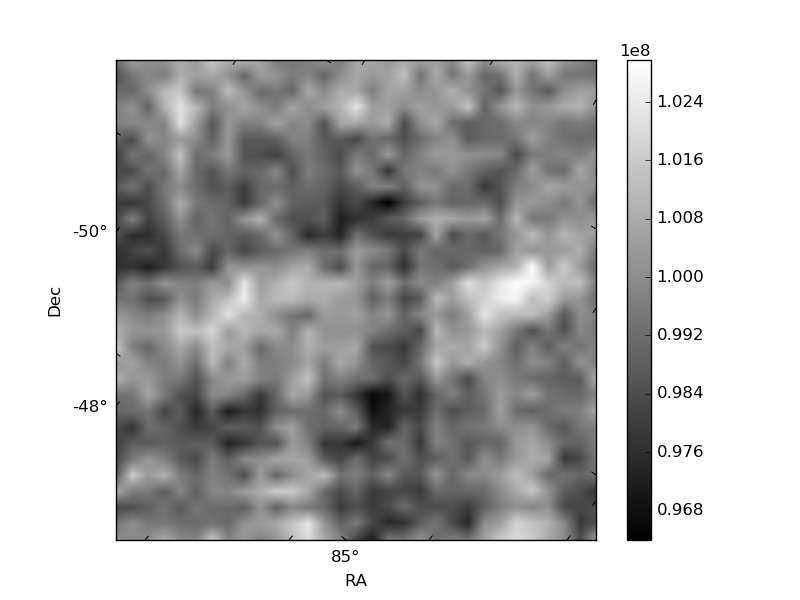
Histogram calculated using DETX and DETY for each event in the final _common_clean file
| Quadrant A | 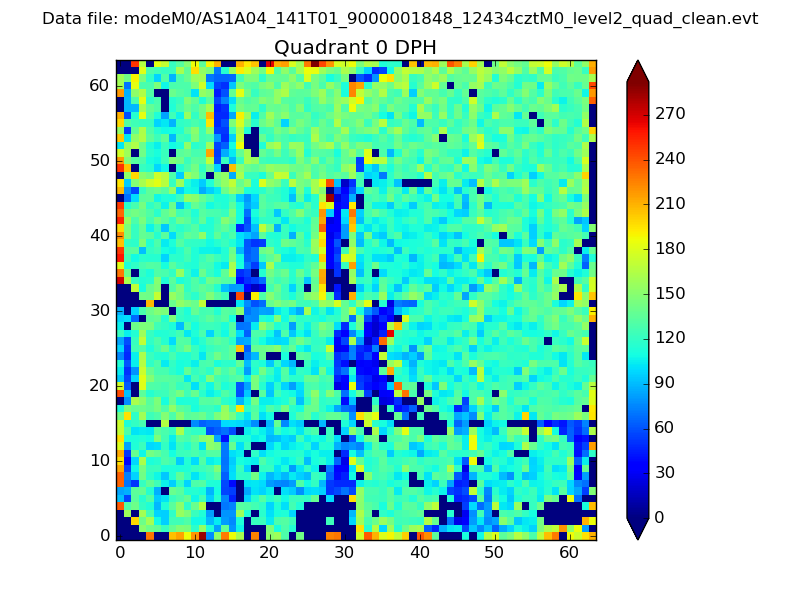 |
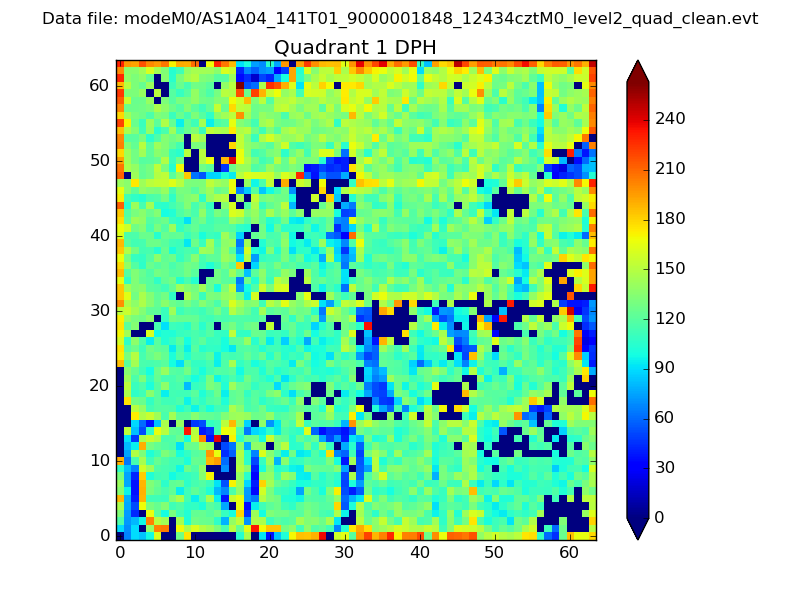 |
Quadrant B |
|---|---|---|---|
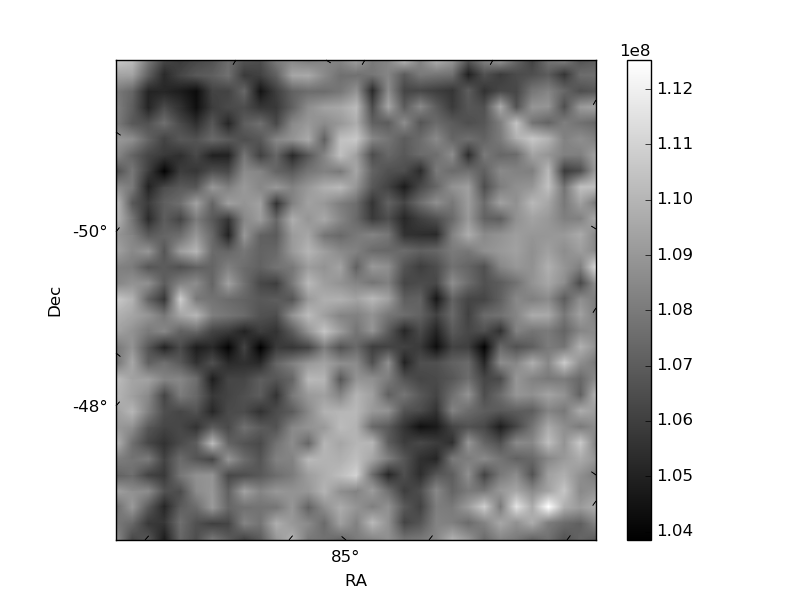
| Quadrant D | 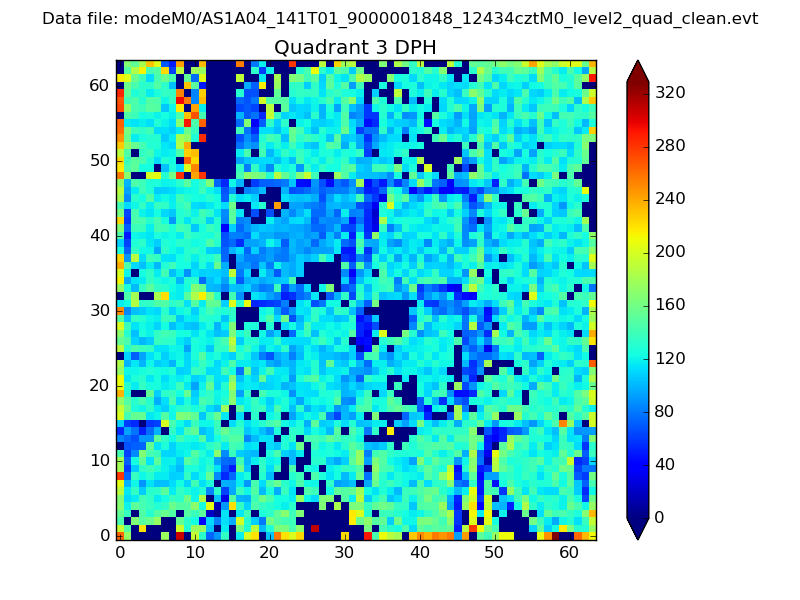 |
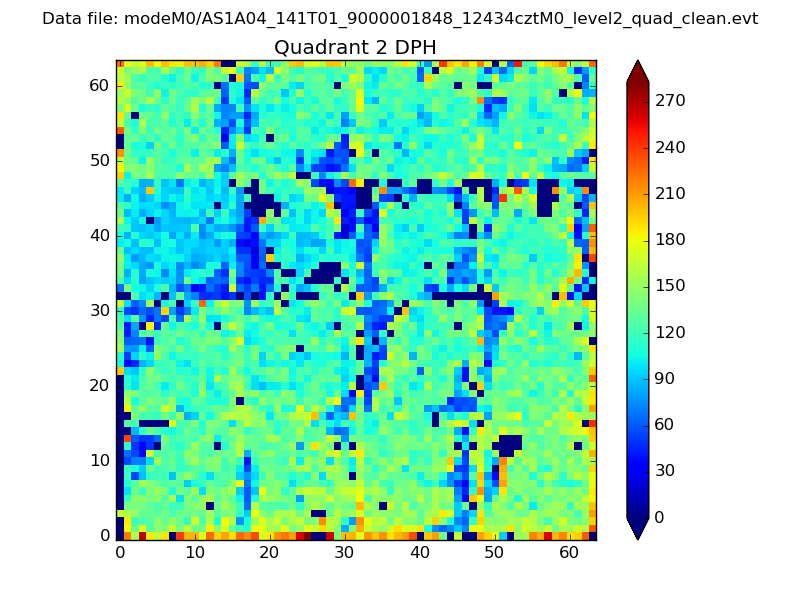 |
Quadrant C |
| Plot type | Count rate plots | Images |
|---|---|---|
| Comparison with Poisson distribution Blue bars denote a histogram of data divided into 1 sec bins. Red curve is a Poisson curve with rate = median count rate of data. |
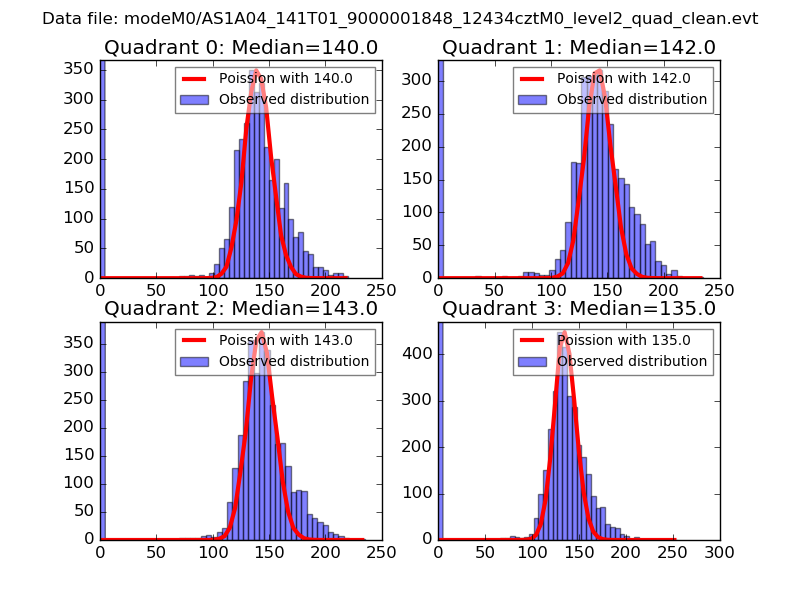 |
 |
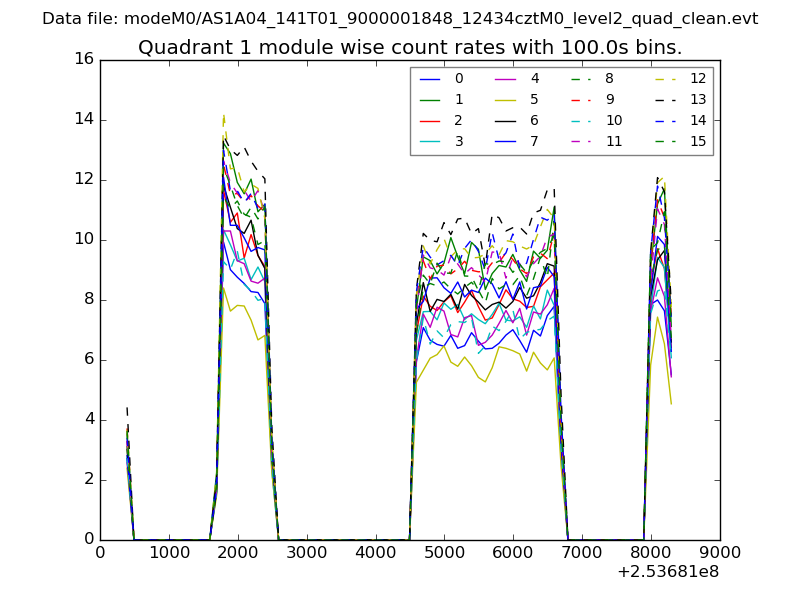
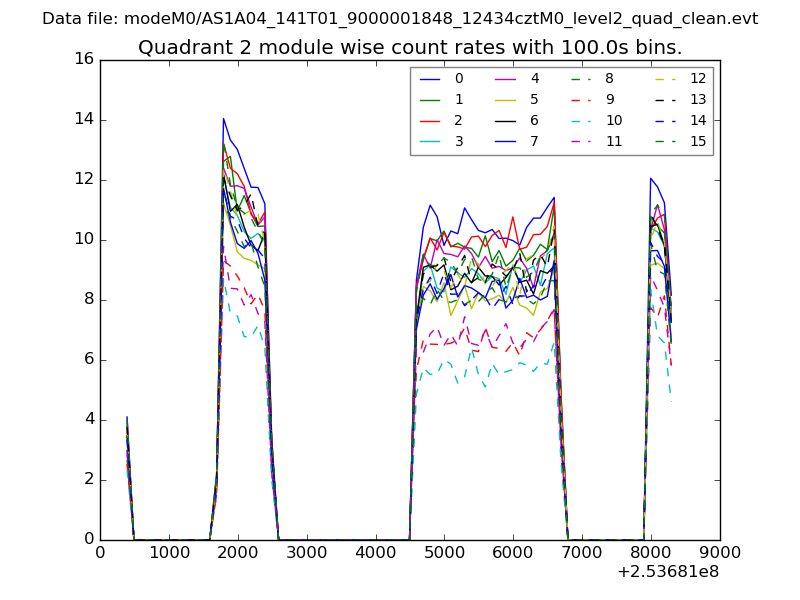
| Quadrant-wise count rates Data is divided into 100 sec bins |
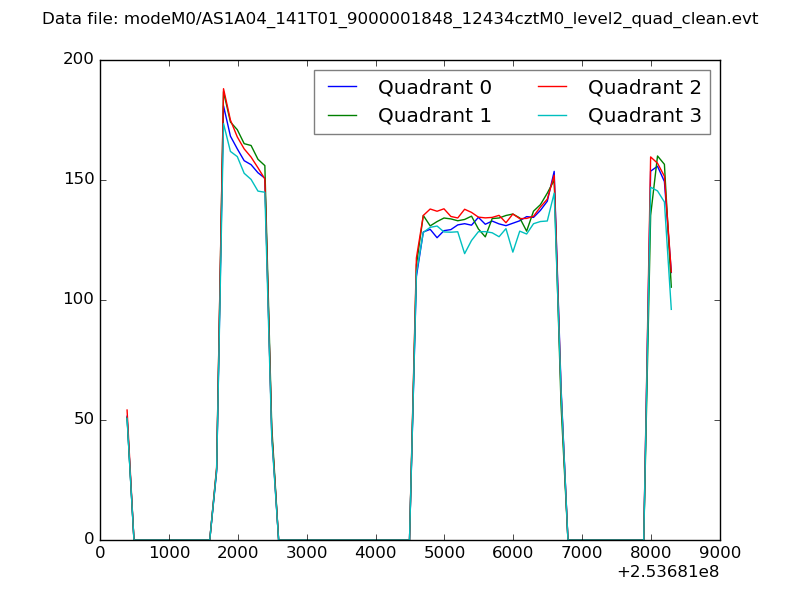 |
|
| Module-wise count rates for Quadrant A Data is divided into 100 sec bins |
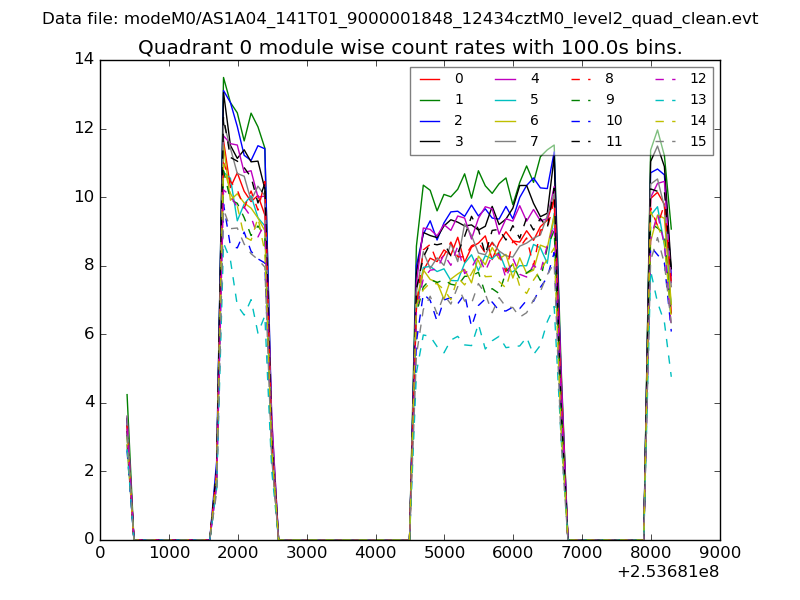 |
 |
| Module-wise count rates for Quadrant B Data is divided into 100 sec bins |
 |
 |
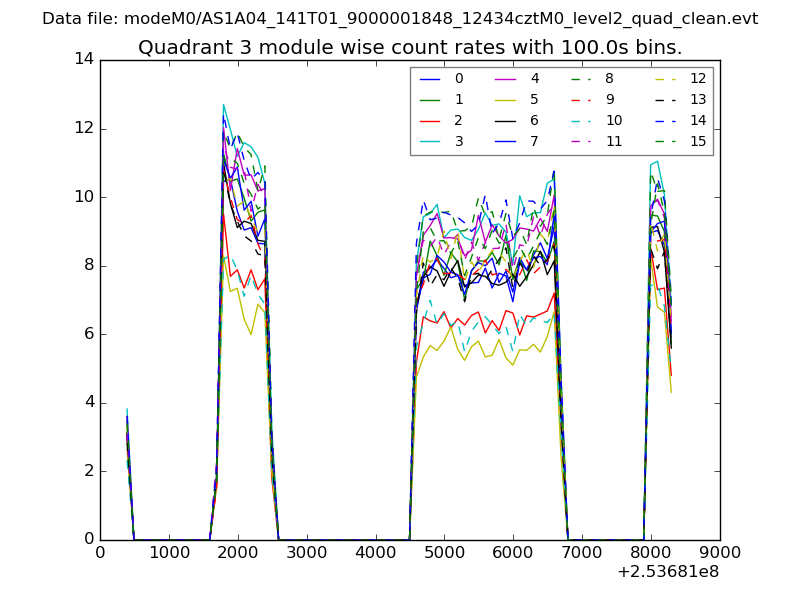
| Module-wise count rates for Quadrant C Data is divided into 100 sec bins |
 |
 |
| Module-wise count rates for Quadrant D Data is divided into 100 sec bins |
 |
 |
| Parameter | Plot |
|---|---|
| CZT HV Monitor | 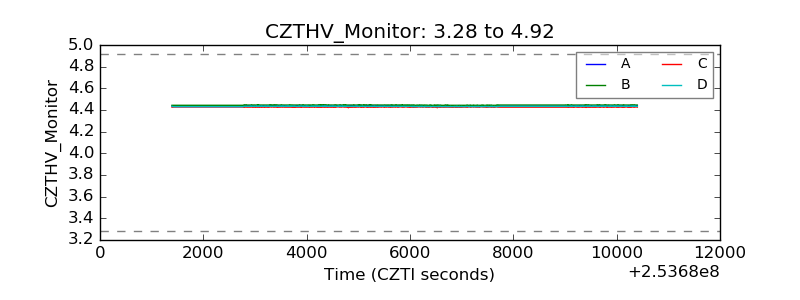 |
| D_VDD |  |
| Temperature 1 | 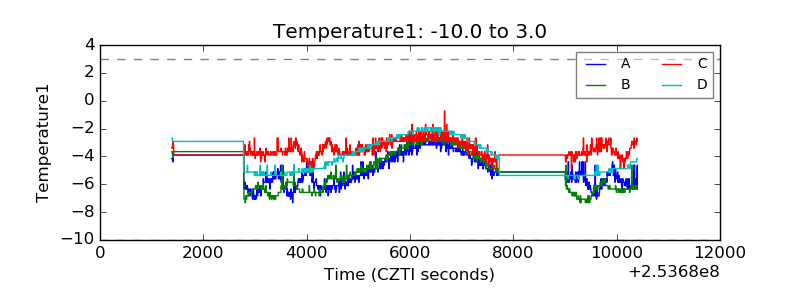 |
| Veto HV Monitor | 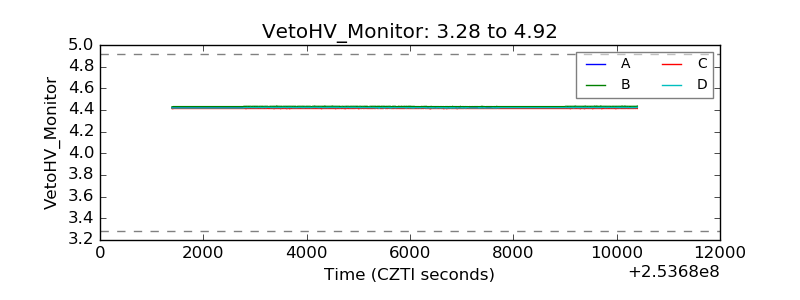 |
| Veto LLD | 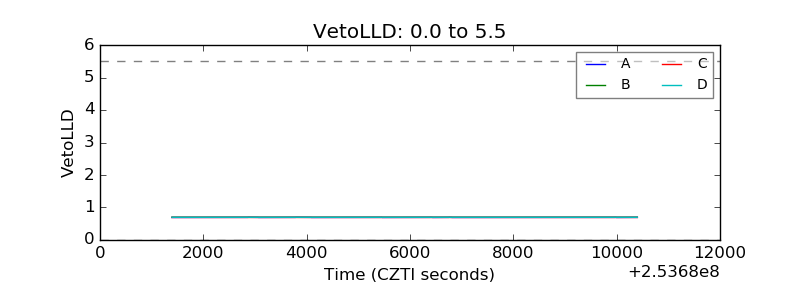 |
| Alpha Counter | 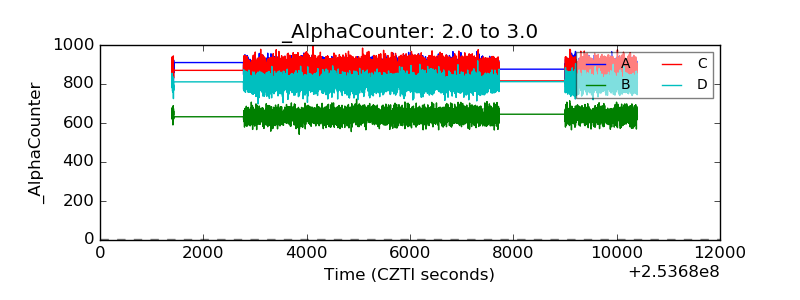 |
| _CPM_Rate | 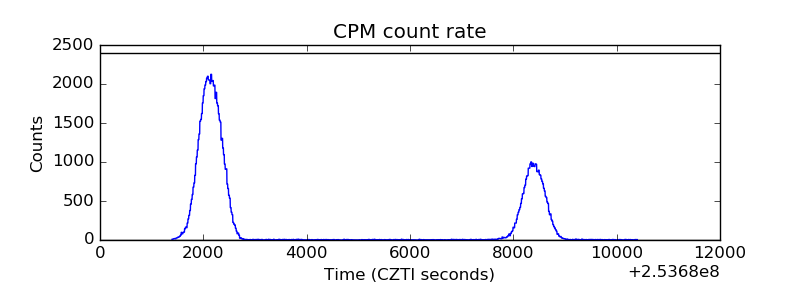 |
| CZT Counter | 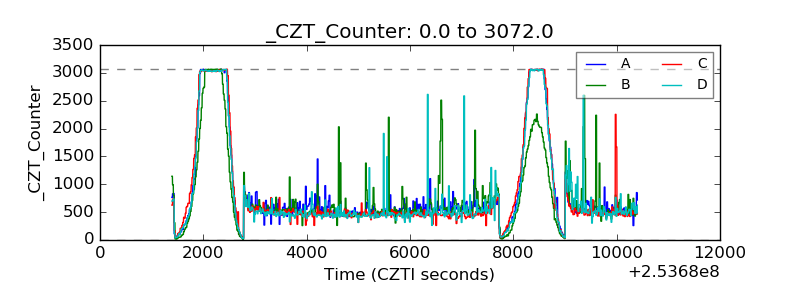 |
| +2.5 Volts monitor |  |
| +5 Volts monitor |  |
| _ROLL_ROT | 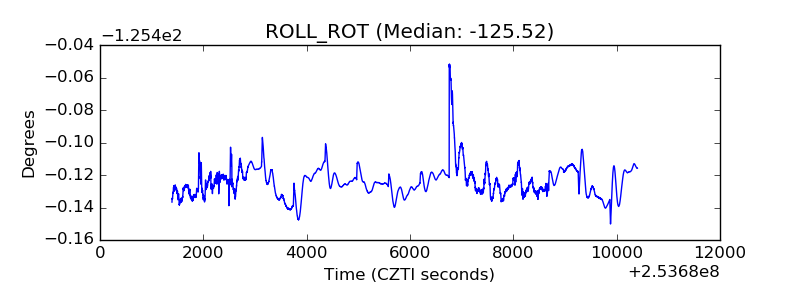 |
| _Roll_DEC |  |
| _Roll_RA | 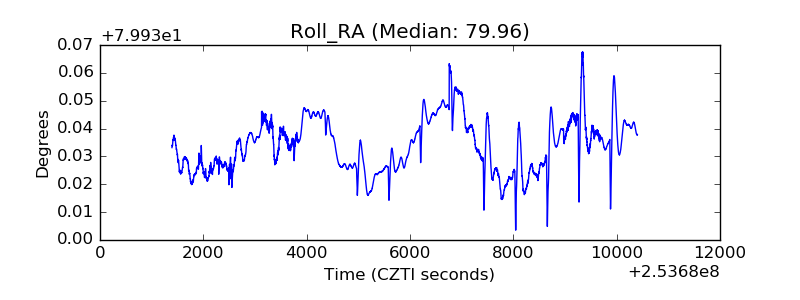 |
| Veto Counter | 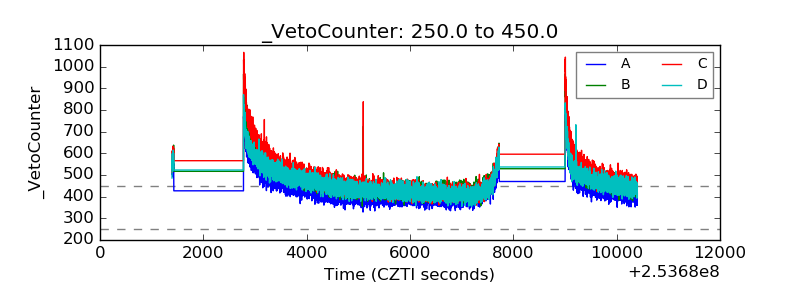 |