| Param | Original file | Final file |
|---|---|---|
| Filename | modeM0/AS1A04_141T01_9000001848_12435cztM0_level2.evt | modeM0/AS1A04_141T01_9000001848_12435cztM0_level2_quad_clean.evt |
| Size (bytes) | 592,943,040 | 68,405,760 |
| Size | 565.5 MB | 65.2 MB |
| Events in quadrant A | 4,770,111 | 410,727 |
| Events in quadrant B | 5,308,317 | 382,248 |
| Events in quadrant C | 3,169,752 | 426,294 |
| Events in quadrant D | 4,272,133 | 401,253 |
| Mode M9 | |||
|---|---|---|---|
| Quadrant | BADHDUFLAG | Total packets | Discarded packets |
| A | 0 | 18 | 0 |
| B | 0 | 18 | 0 |
| C | 0 | 18 | 0 |
| D | 0 | 19 | 0 |
| Mode M0 | |||
|---|---|---|---|
| Quadrant | BADHDUFLAG | Total packets | Discarded packets |
| A | 0 | 18753 | 3 |
| B | 0 | 19828 | 2 |
| C | 0 | 13564 | 2 |
| D | 0 | 16904 | 2 |
| Mode SS | |||
|---|---|---|---|
| Quadrant | BADHDUFLAG | Total packets | Discarded packets |
| A | 0 | 130 | 0 |
| B | 0 | 130 | 0 |
| C | 0 | 130 | 0 |
| D | 0 | 130 | 0 |
| Quadrant | Total seconds | Saturated seconds | Saturation percentage |
|---|---|---|---|
| A | 6459 | 165 | 2.554575% |
| B | 6459 | 832 | 12.881251% |
| C | 6459 | 88 | 1.362440% |
| D | 6459 | 206 | 3.189348% |
Noise dominated data is calculated using 1-second bins in cleaned event files. If a bin has >2000 counts, and if more than 50% of those come from <1% of pixels, then it is considered to be noise-dominated and hence unusable.
| Quadrant | # 1 sec bins | Bins with >0 counts | Bins with >2000 counts | High rate bins dominated by noise | Noise dominated (total time) | Noise dominated (detector-on time) | Marked lightcurve |
|---|---|---|---|---|---|---|---|
| A | 7480 | 6460 | 3 | 3 | 0.04% | 0.05% | 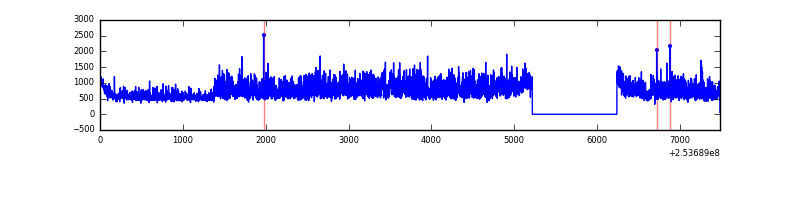 |
| B | 7480 | 6460 | 550 | 550 | 7.35% | 8.51% | 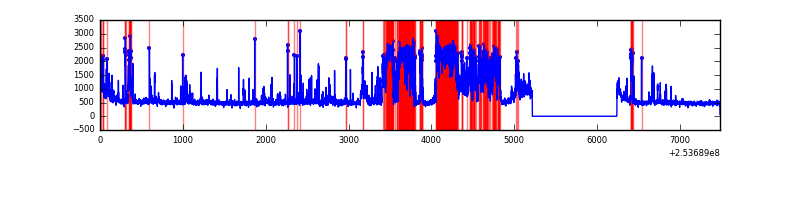 |
| C | 7480 | 6460 | 7 | 7 | 0.09% | 0.11% | 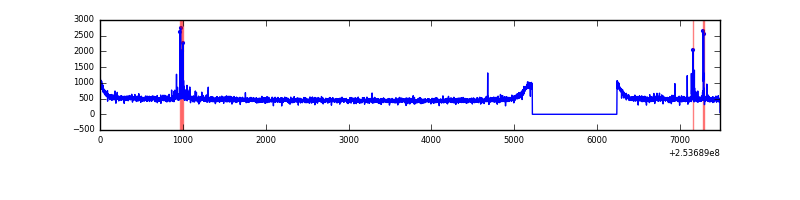 |
| D | 7480 | 6460 | 94 | 94 | 1.26% | 1.46% | 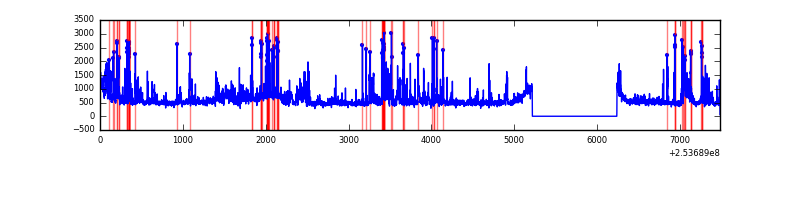 |
Top three noisy pixels from each quadrant. If the there are fewer than three noisy pixels in the level2.evt file, extra rows are filled as -1
| Pixel properties | Quadrant properties | ||||||
|---|---|---|---|---|---|---|---|
| Quadrant | DetID | PixID | Counts | Sigma | Mean | Median | Sigma |
| A | 15 | 239 | 1189170 | 7303.12 | 798 | 780 | 162.7 |
| A | 13 | 251 | 180716 | 1105.78 | 798 | 780 | 162.7 |
| A | 1 | 162 | 117284 | 715.96 | 798 | 780 | 162.7 |
| B | 4 | 239 | 2093688 | 14398.68 | 774 | 757 | 145.4 |
| B | 3 | 64 | 97855 | 668.0 | 774 | 757 | 145.4 |
| B | 0 | 187 | 53057 | 359.81 | 774 | 757 | 145.4 |
| C | 15 | 208 | 67992 | 367.38 | 795 | 801 | 182.9 |
| C | 13 | 61 | 6043 | 28.66 | 795 | 801 | 182.9 |
| C | 14 | 234 | 2643 | 10.07 | 795 | 801 | 182.9 |
| D | 1 | 52 | 1122150 | 6037.09 | 779 | 757 | 185.8 |
| D | 13 | 104 | 143833 | 770.26 | 779 | 757 | 185.8 |
| D | 2 | 234 | 20765 | 107.71 | 779 | 757 | 185.8 |
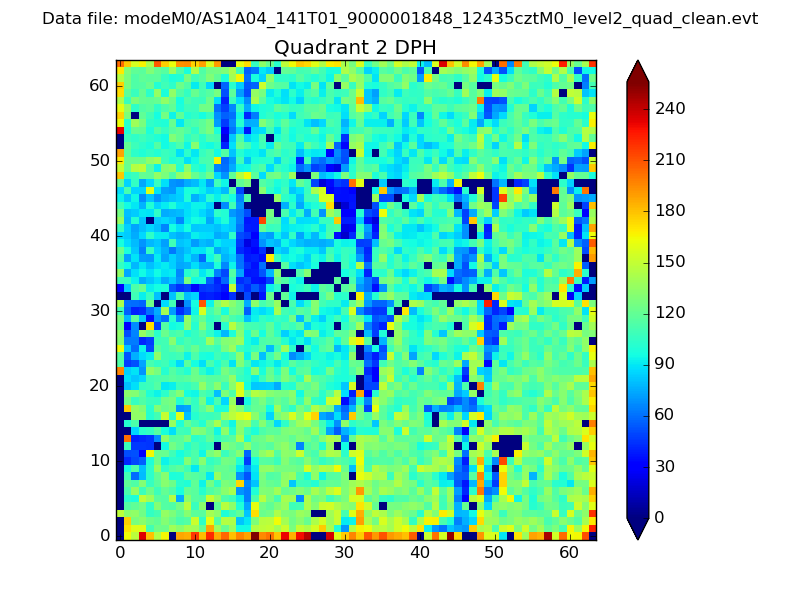
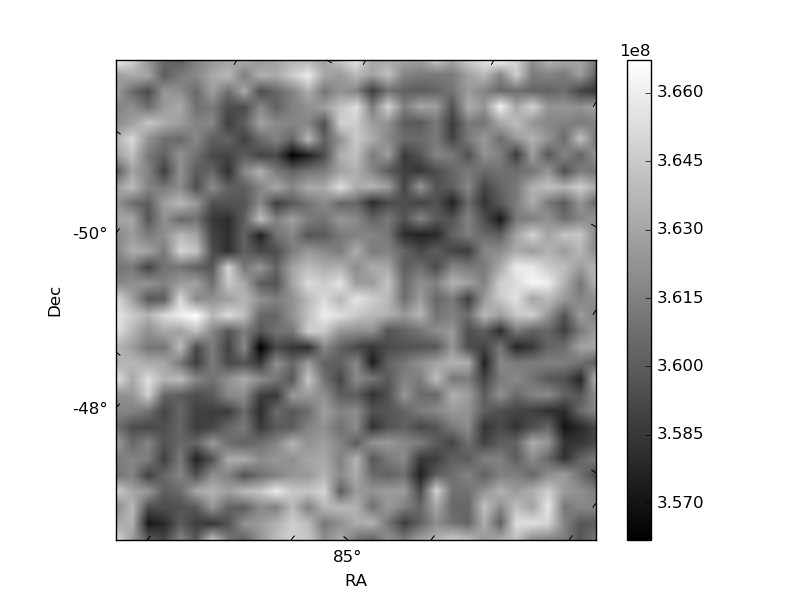
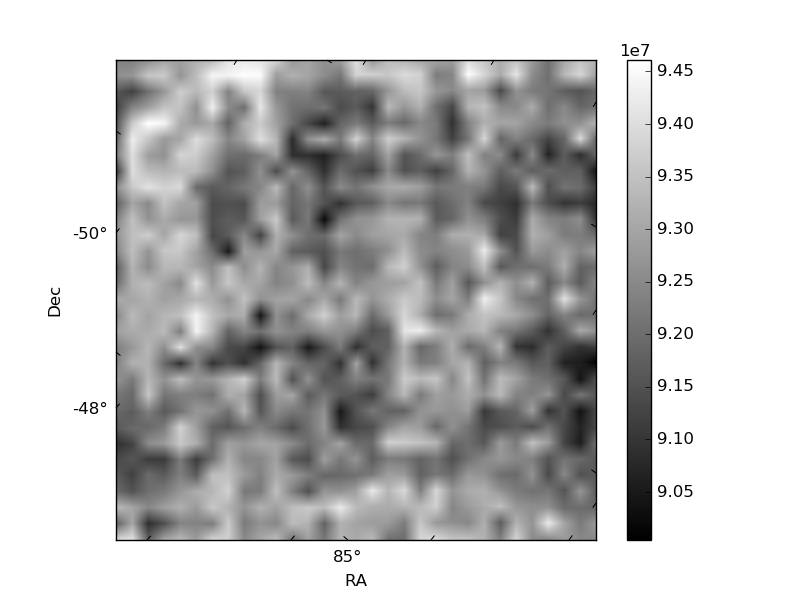
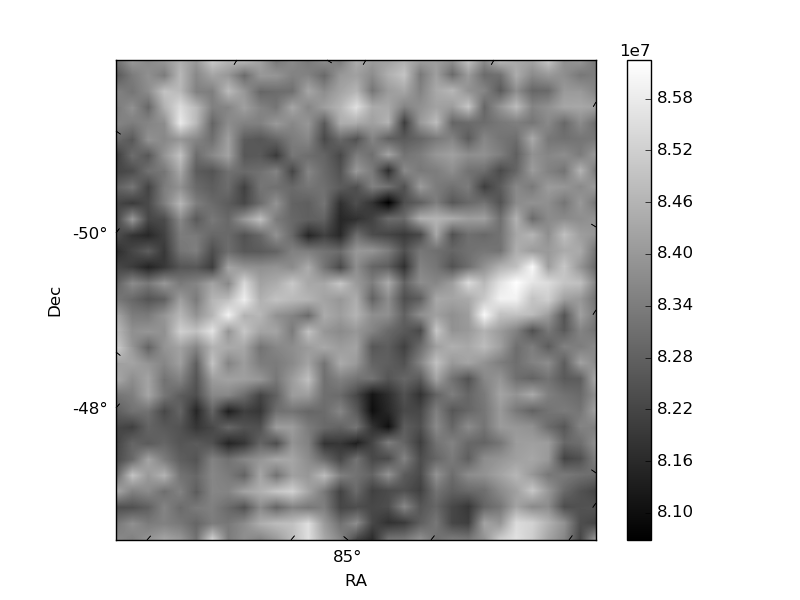
Histogram calculated using DETX and DETY for each event in the final _common_clean file
| Quadrant A | 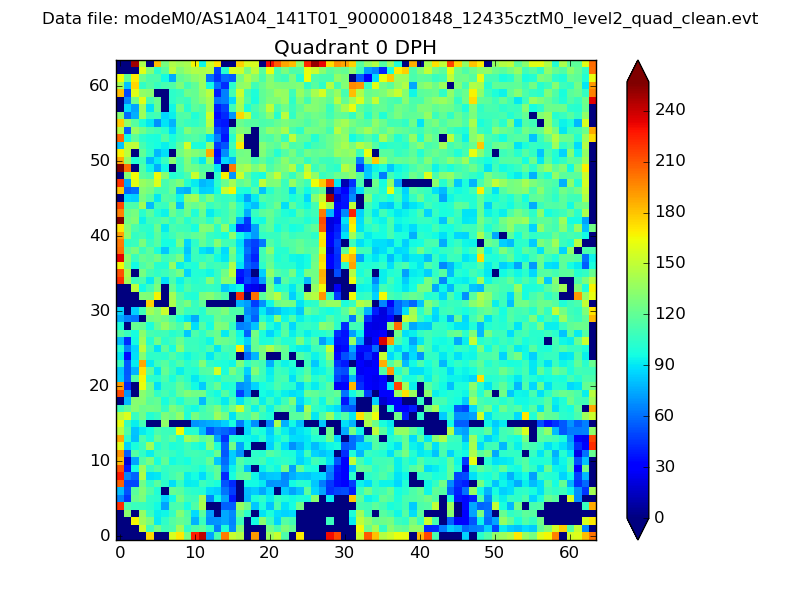 |
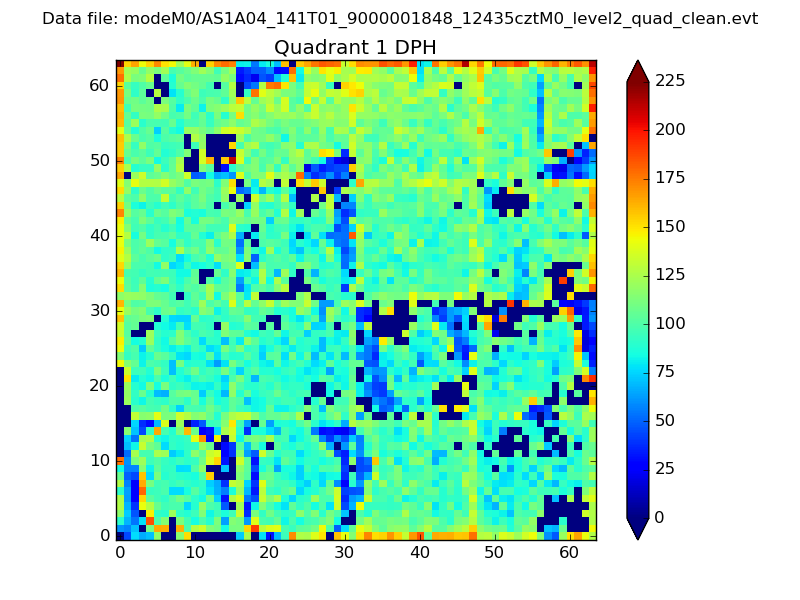 |
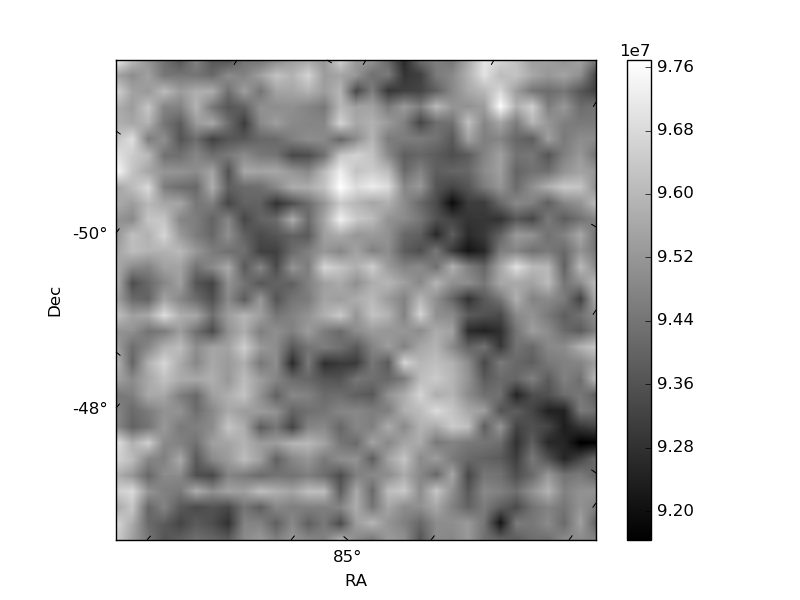
Quadrant B |
|---|---|---|---|
| Quadrant D | 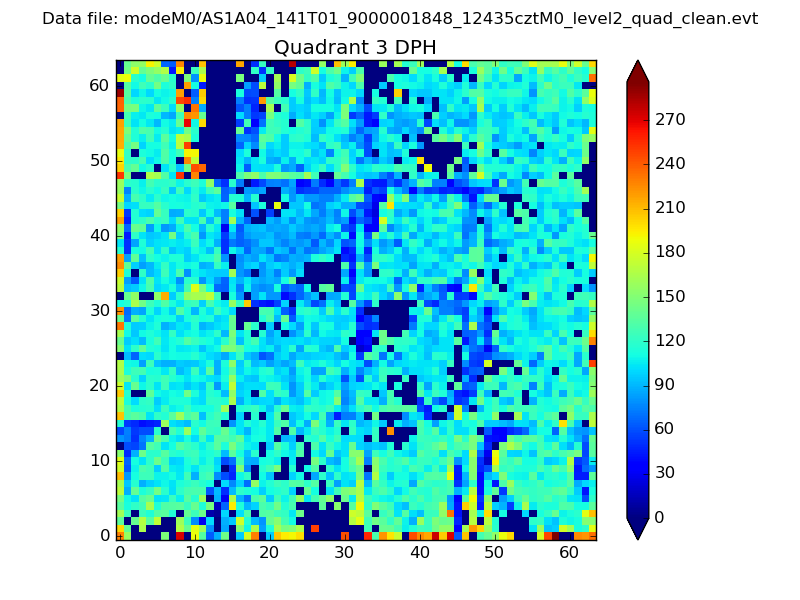 |
 |
Quadrant C |
| Plot type | Count rate plots | Images |
|---|---|---|
| Comparison with Poisson distribution Blue bars denote a histogram of data divided into 1 sec bins. Red curve is a Poisson curve with rate = median count rate of data. |
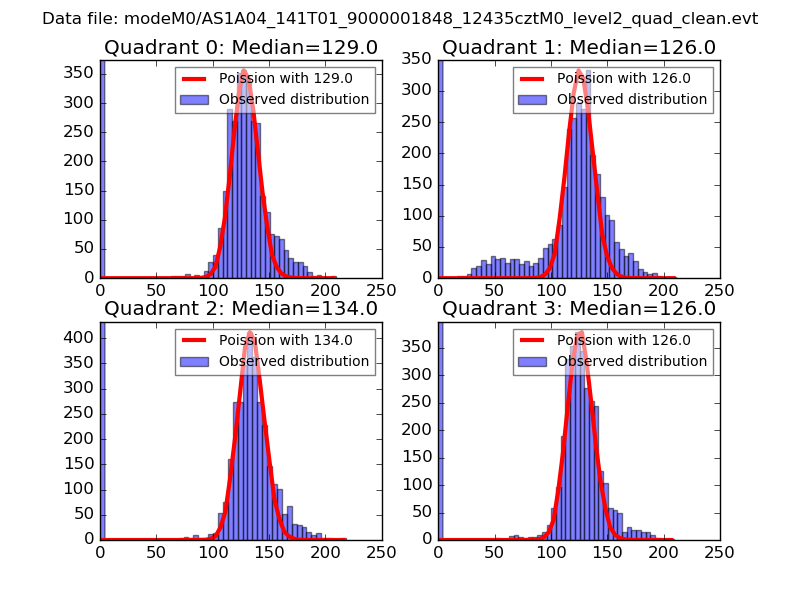 |
 |
| Quadrant-wise count rates Data is divided into 100 sec bins |
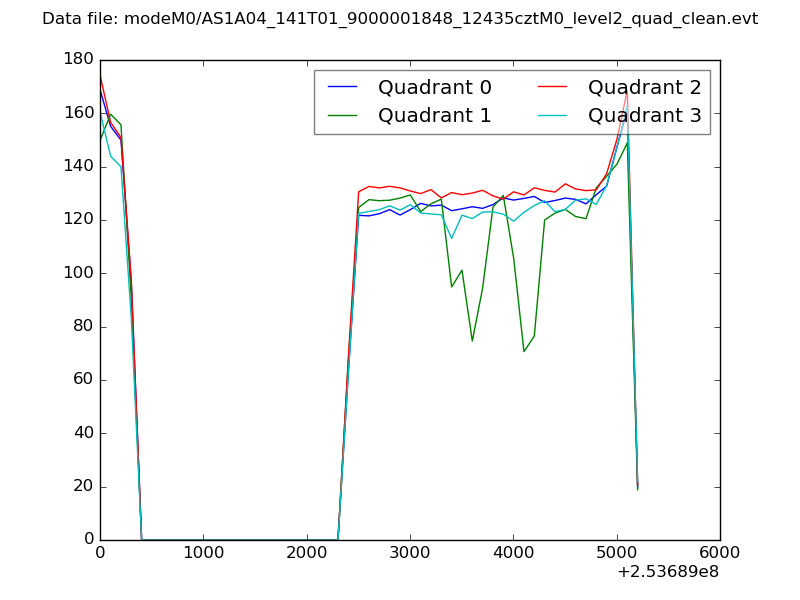 |
|
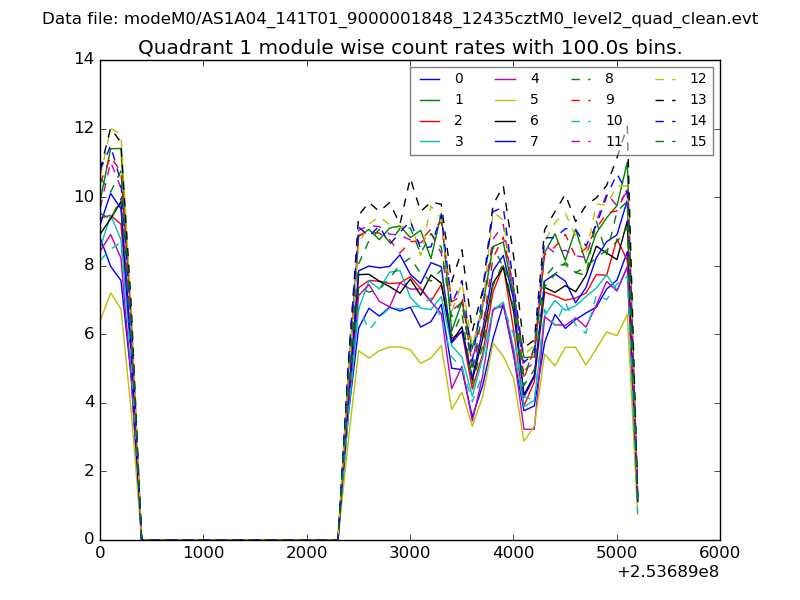
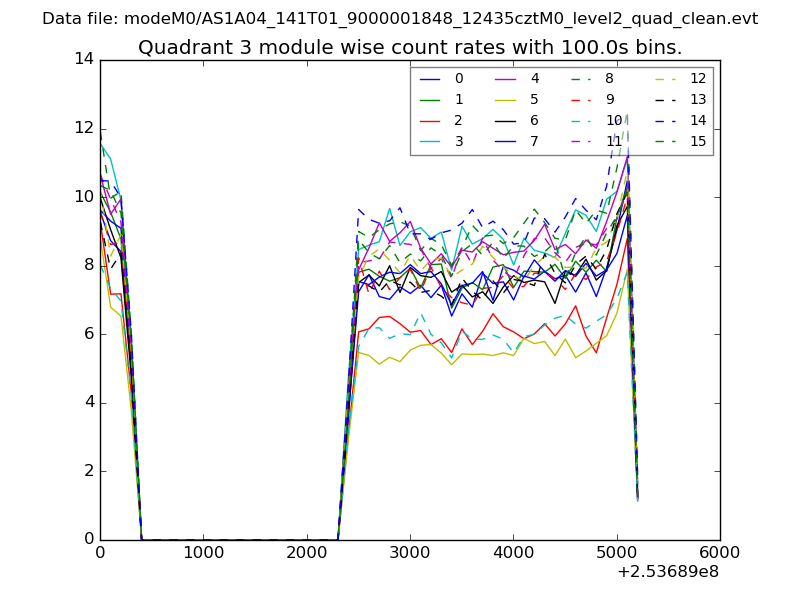
| Module-wise count rates for Quadrant A Data is divided into 100 sec bins |
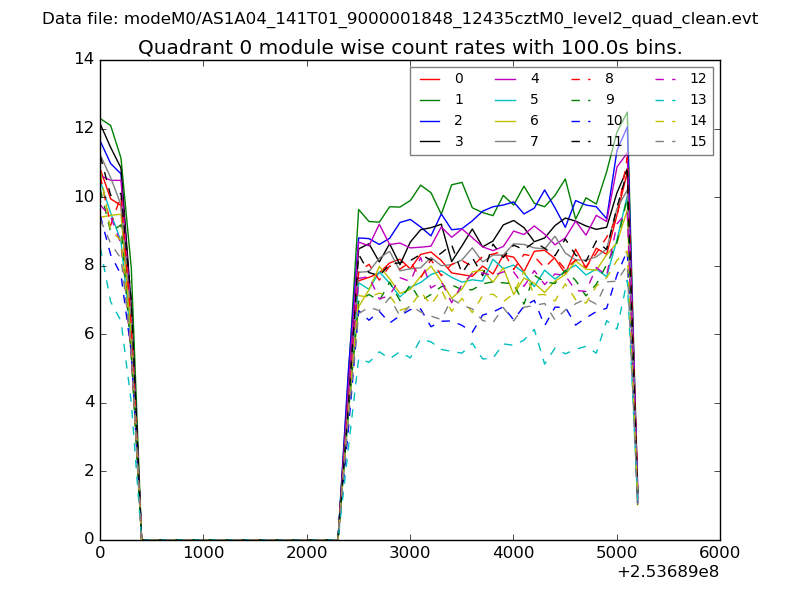 |
 |
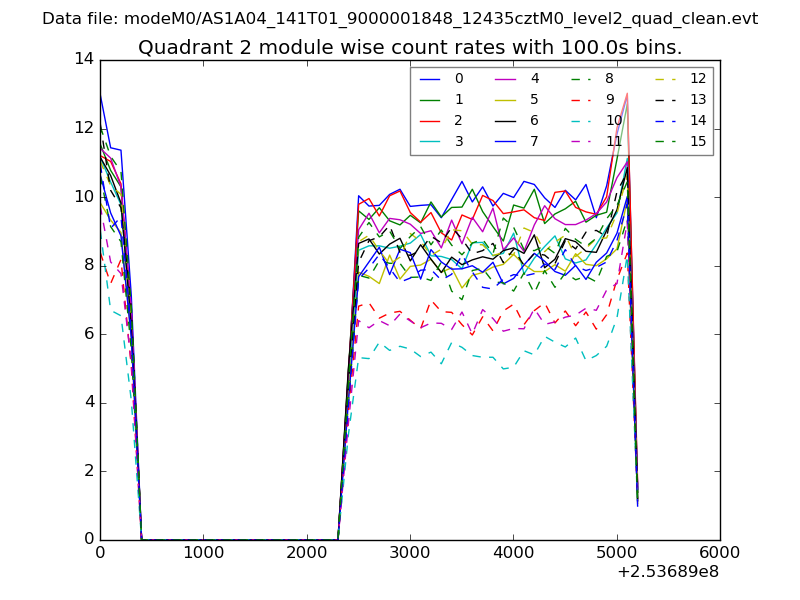
| Module-wise count rates for Quadrant B Data is divided into 100 sec bins |
 |
 |
| Module-wise count rates for Quadrant C Data is divided into 100 sec bins |
 |
 |
| Module-wise count rates for Quadrant D Data is divided into 100 sec bins |
 |
 |
| Parameter | Plot |
|---|---|
| CZT HV Monitor | 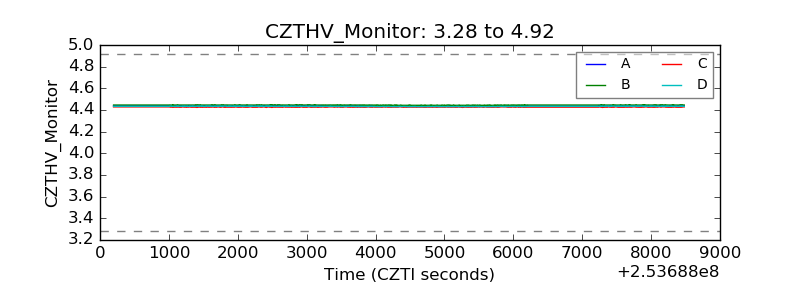 |
| D_VDD | 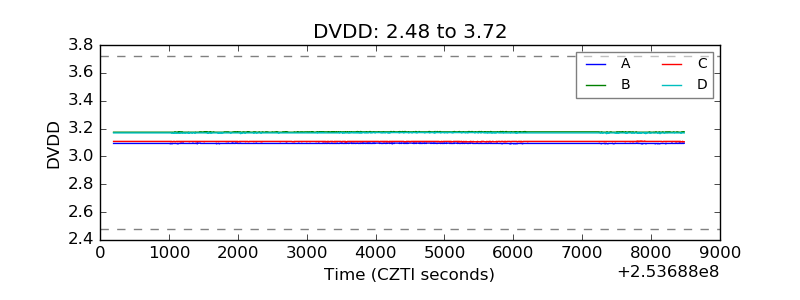 |
| Temperature 1 | 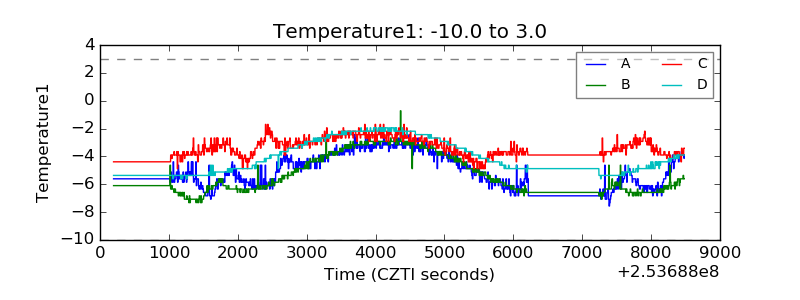 |
| Veto HV Monitor | 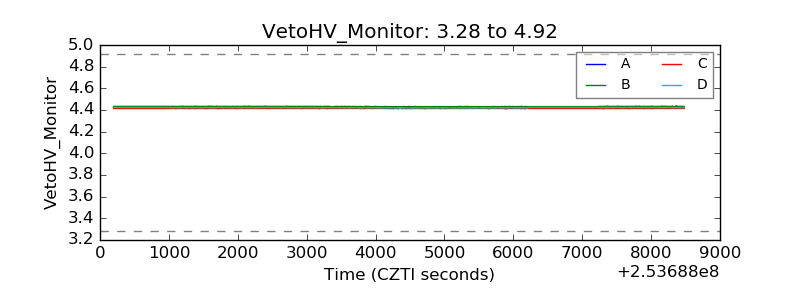 |
| Veto LLD | 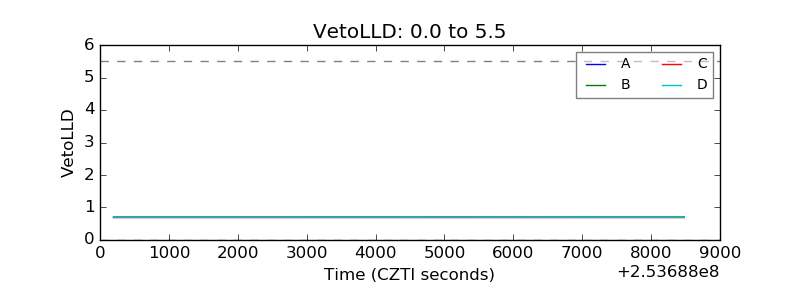 |
| Alpha Counter | 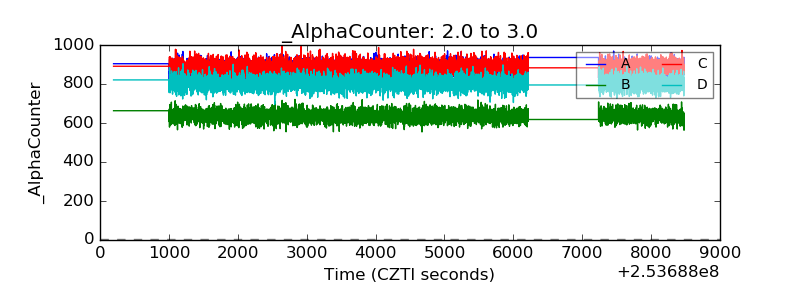 |
| _CPM_Rate | 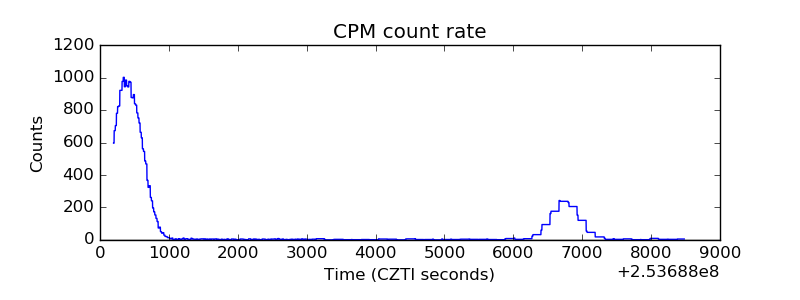 |
| CZT Counter | 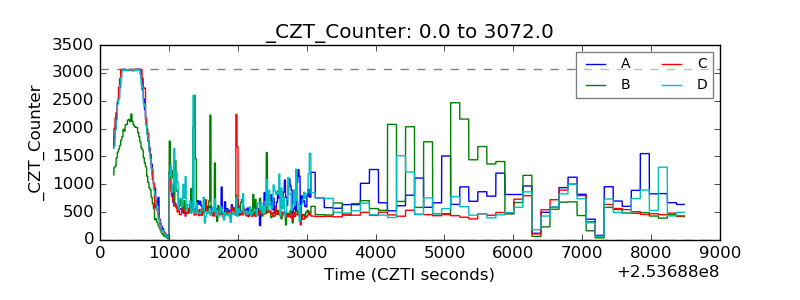 |
| +2.5 Volts monitor |  |
| +5 Volts monitor |  |
| _ROLL_ROT | 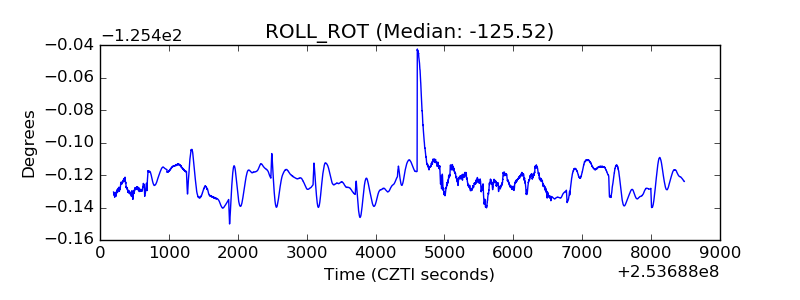 |
| _Roll_DEC | 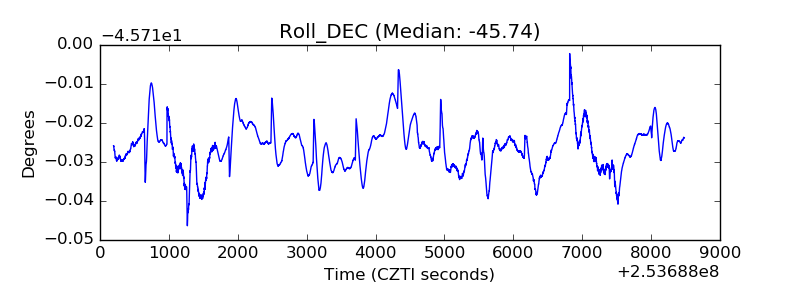 |
| _Roll_RA | 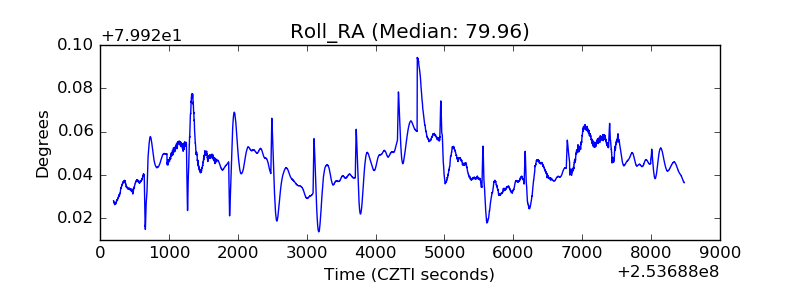 |
| Veto Counter | 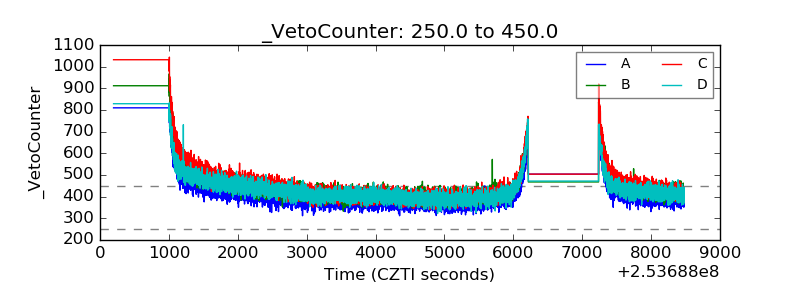 |