| Param | Original file | Final file |
|---|---|---|
| Filename | modeM0/AS1A04_141T01_9000001848_12436cztM0_level2.evt | modeM0/AS1A04_141T01_9000001848_12436cztM0_level2_quad_clean.evt |
| Size (bytes) | 728,089,920 | 71,087,040 |
| Size | 694.4 MB | 67.8 MB |
| Events in quadrant A | 4,618,598 | 435,471 |
| Events in quadrant B | 4,210,320 | 436,047 |
| Events in quadrant C | 3,517,497 | 443,940 |
| Events in quadrant D | 9,230,567 | 348,247 |
| Mode M9 | |||
|---|---|---|---|
| Quadrant | BADHDUFLAG | Total packets | Discarded packets |
| A | 0 | 13 | 0 |
| B | 0 | 13 | 0 |
| C | 0 | 13 | 0 |
| D | 0 | 14 | 0 |
| Mode M0 | |||
|---|---|---|---|
| Quadrant | BADHDUFLAG | Total packets | Discarded packets |
| A | 0 | 18464 | 3 |
| B | 0 | 16977 | 2 |
| C | 0 | 15183 | 2 |
| D | 0 | 32134 | 2 |
| Mode SS | |||
|---|---|---|---|
| Quadrant | BADHDUFLAG | Total packets | Discarded packets |
| A | 0 | 142 | 0 |
| B | 0 | 142 | 0 |
| C | 0 | 142 | 0 |
| D | 0 | 142 | 0 |
| Quadrant | Total seconds | Saturated seconds | Saturation percentage |
|---|---|---|---|
| A | 7003 | 210 | 2.998715% |
| B | 7003 | 381 | 5.440525% |
| C | 7003 | 150 | 2.141939% |
| D | 7003 | 1870 | 26.702842% |
Noise dominated data is calculated using 1-second bins in cleaned event files. If a bin has >2000 counts, and if more than 50% of those come from <1% of pixels, then it is considered to be noise-dominated and hence unusable.
| Quadrant | # 1 sec bins | Bins with >0 counts | Bins with >2000 counts | High rate bins dominated by noise | Noise dominated (total time) | Noise dominated (detector-on time) | Marked lightcurve |
|---|---|---|---|---|---|---|---|
| A | 7614 | 7004 | 8 | 8 | 0.11% | 0.11% | 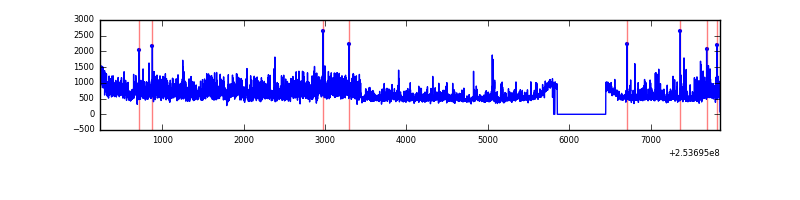 |
| B | 7614 | 7004 | 141 | 141 | 1.85% | 2.01% | 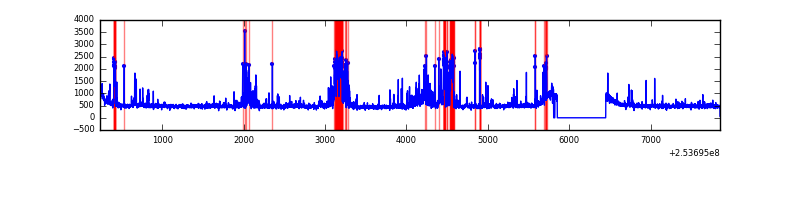 |
| C | 7614 | 7004 | 24 | 24 | 0.32% | 0.34% | 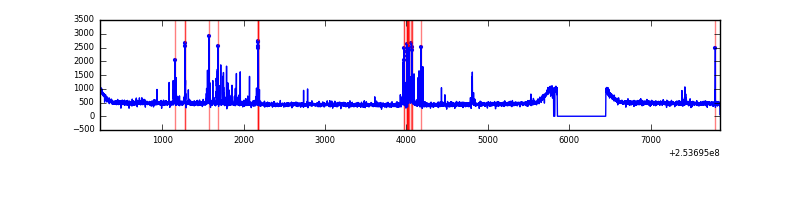 |
| D | 7614 | 7004 | 1861 | 1861 | 24.44% | 26.57% | 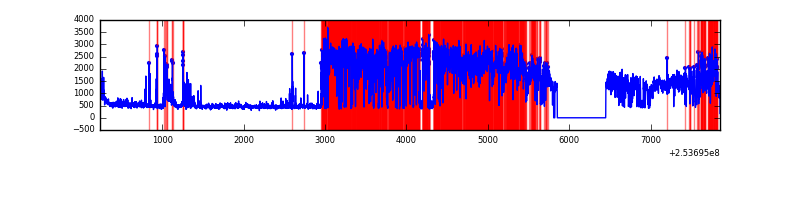 |
Top three noisy pixels from each quadrant. If the there are fewer than three noisy pixels in the level2.evt file, extra rows are filled as -1
| Pixel properties | Quadrant properties | ||||||
|---|---|---|---|---|---|---|---|
| Quadrant | DetID | PixID | Counts | Sigma | Mean | Median | Sigma |
| A | 15 | 239 | 689196 | 3972.17 | 849 | 829 | 173.3 |
| A | 13 | 251 | 256909 | 1477.69 | 849 | 829 | 173.3 |
| A | 1 | 162 | 143489 | 823.21 | 849 | 829 | 173.3 |
| B | 4 | 239 | 749763 | 4590.51 | 846 | 824 | 163.1 |
| B | 3 | 64 | 64842 | 392.39 | 846 | 824 | 163.1 |
| B | 11 | 51 | 44379 | 266.96 | 846 | 824 | 163.1 |
| C | 15 | 208 | 221432 | 1134.57 | 840 | 843 | 194.4 |
| C | 14 | 234 | 23261 | 115.3 | 840 | 843 | 194.4 |
| C | 13 | 61 | 6171 | 27.4 | 840 | 843 | 194.4 |
| D | 1 | 52 | 6124121 | 33235.41 | 771 | 749 | 184.2 |
| D | 13 | 104 | 134076 | 723.65 | 771 | 749 | 184.2 |
| D | 2 | 234 | 22821 | 119.8 | 771 | 749 | 184.2 |
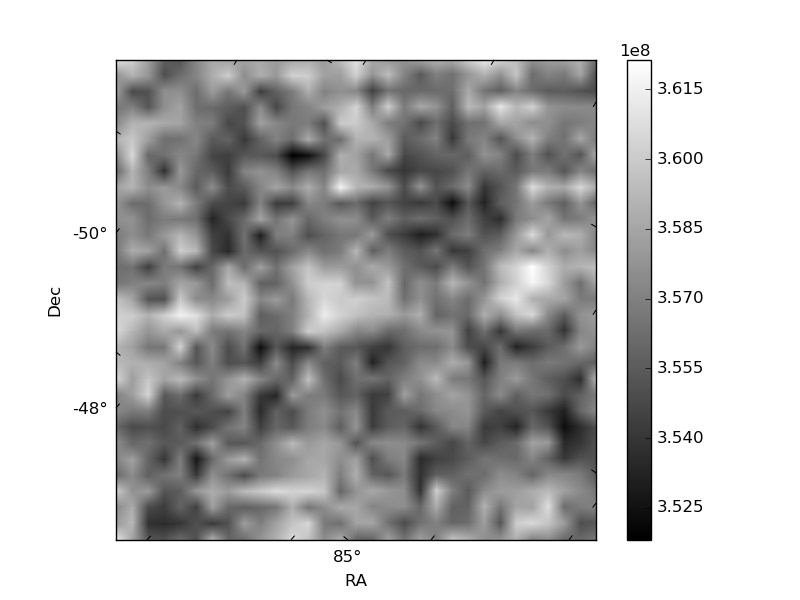
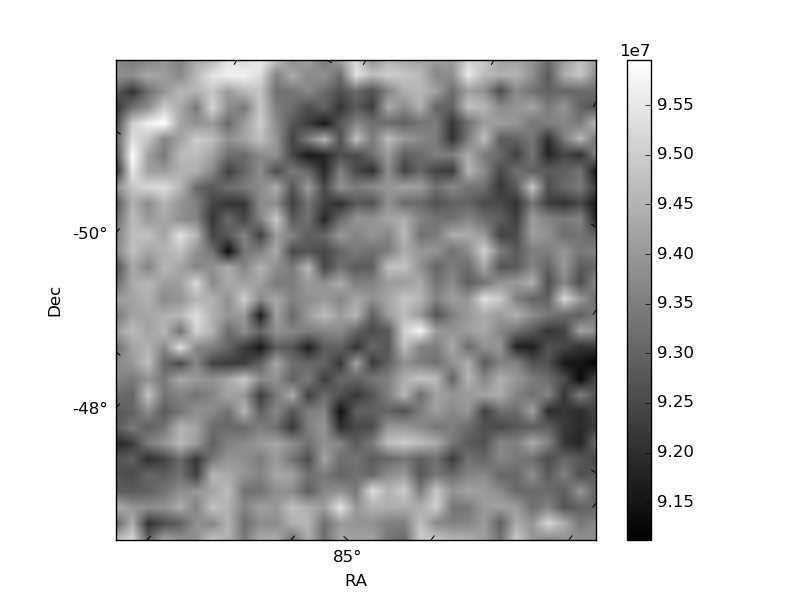
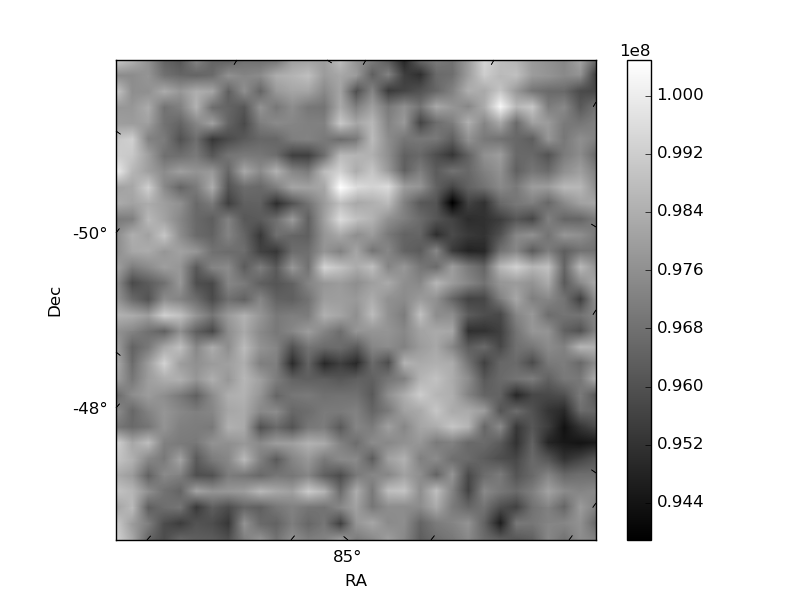
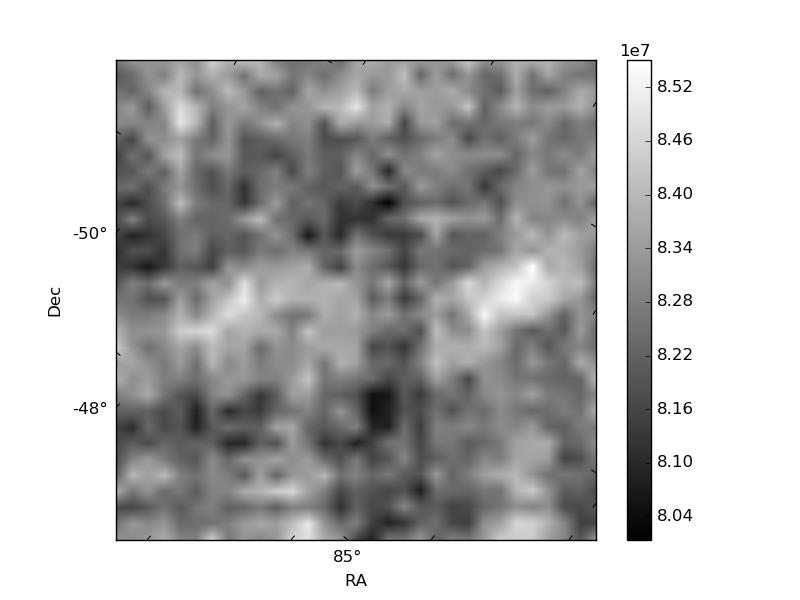
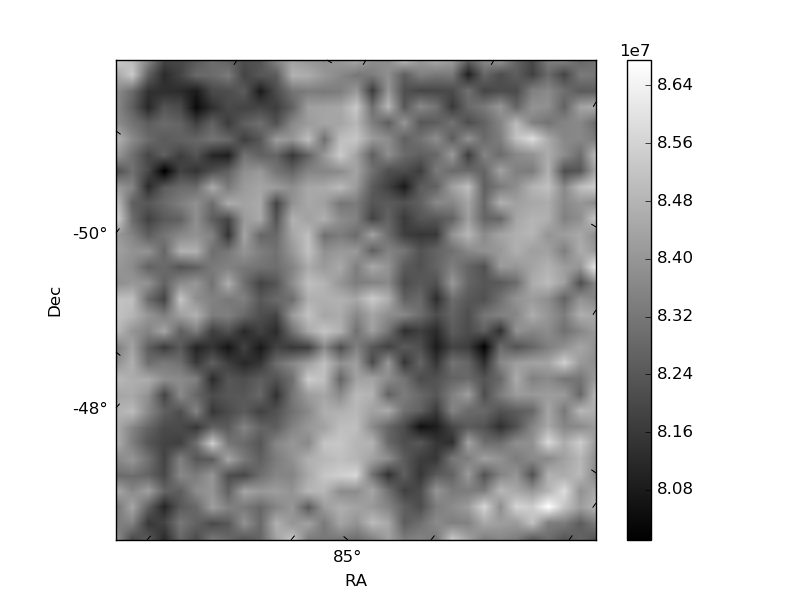
Histogram calculated using DETX and DETY for each event in the final _common_clean file
| Quadrant A | 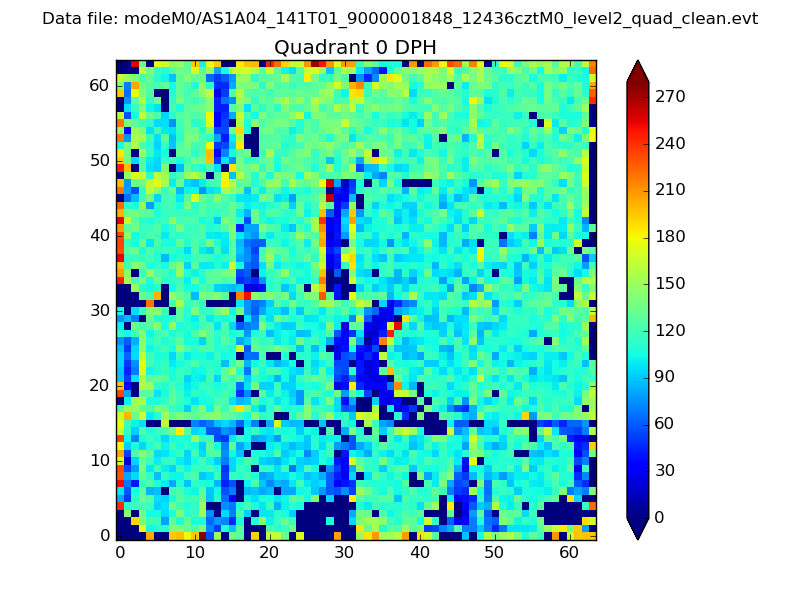 |
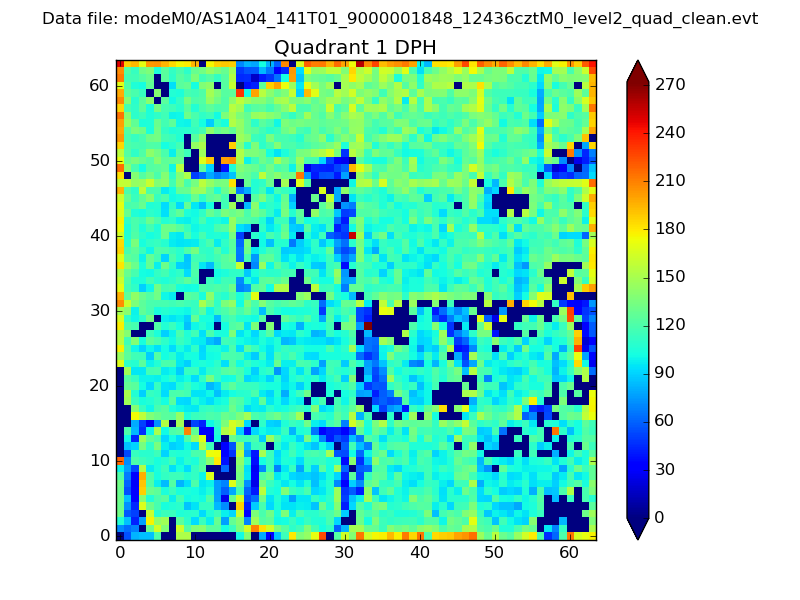 |
Quadrant B |
|---|---|---|---|
| Quadrant D | 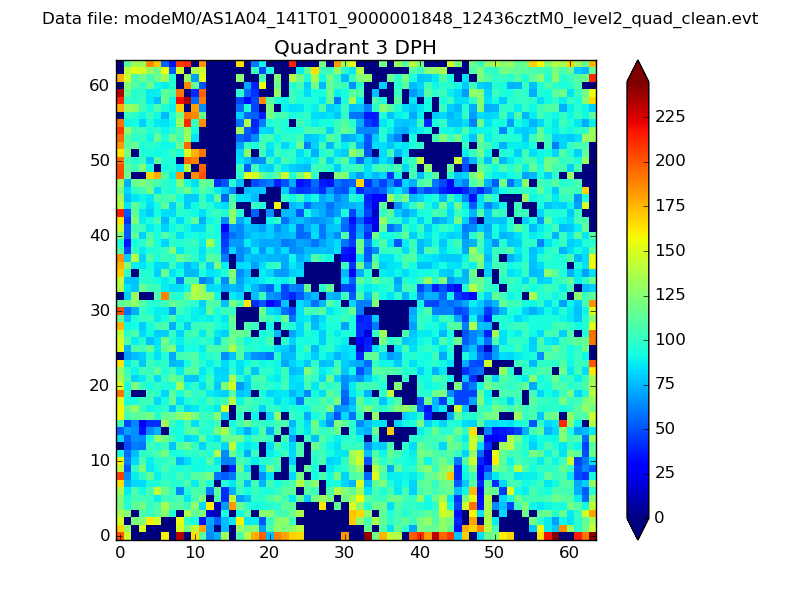 |
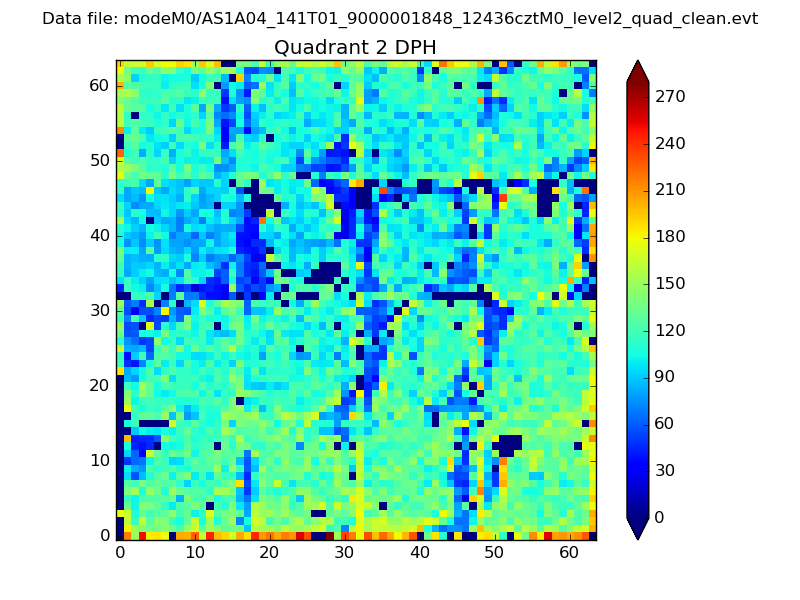 |
Quadrant C |
| Plot type | Count rate plots | Images |
|---|---|---|
| Comparison with Poisson distribution Blue bars denote a histogram of data divided into 1 sec bins. Red curve is a Poisson curve with rate = median count rate of data. |
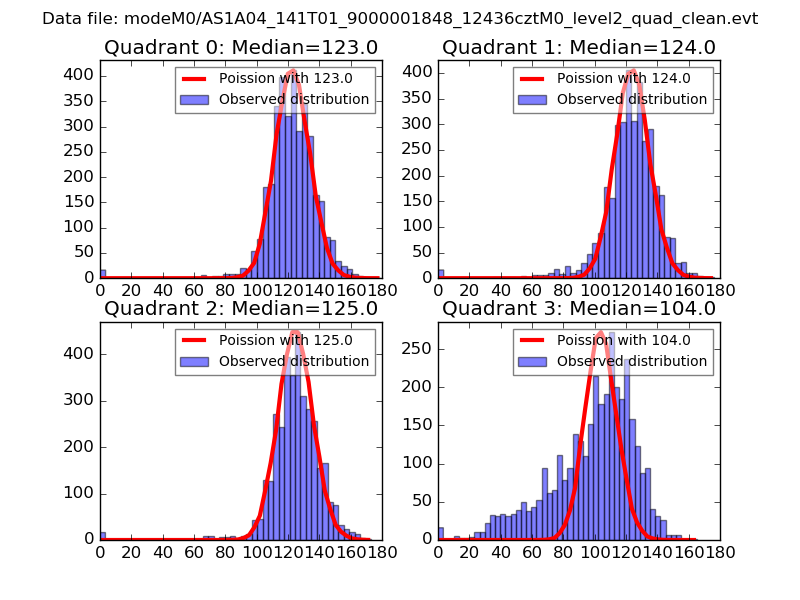 |
 |
| Quadrant-wise count rates Data is divided into 100 sec bins |
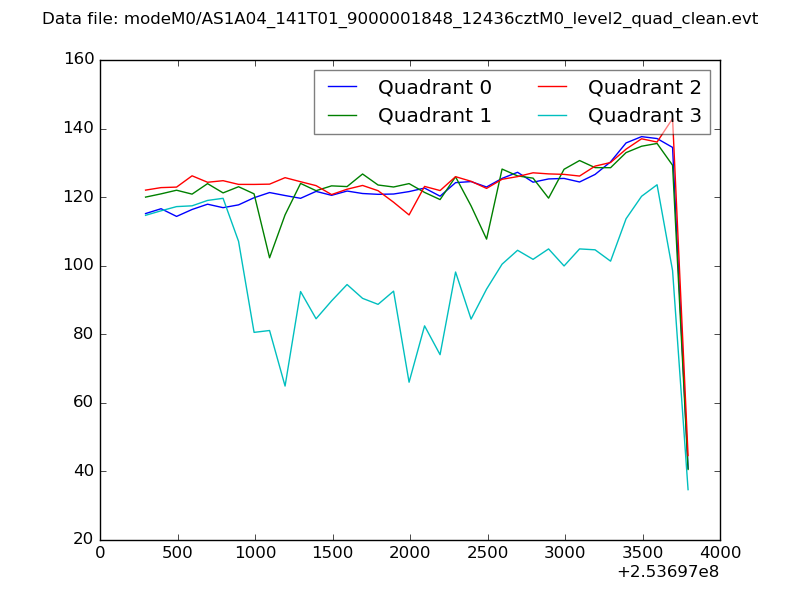 |
|
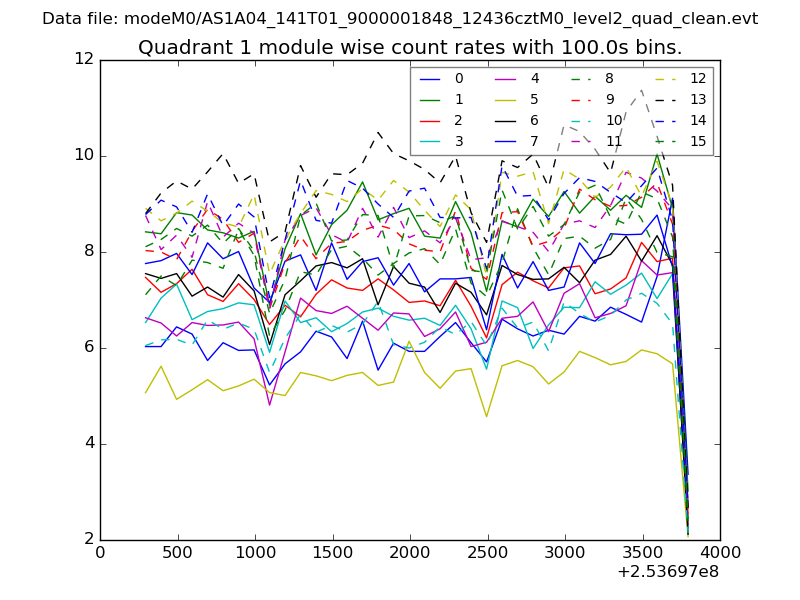
| Module-wise count rates for Quadrant A Data is divided into 100 sec bins |
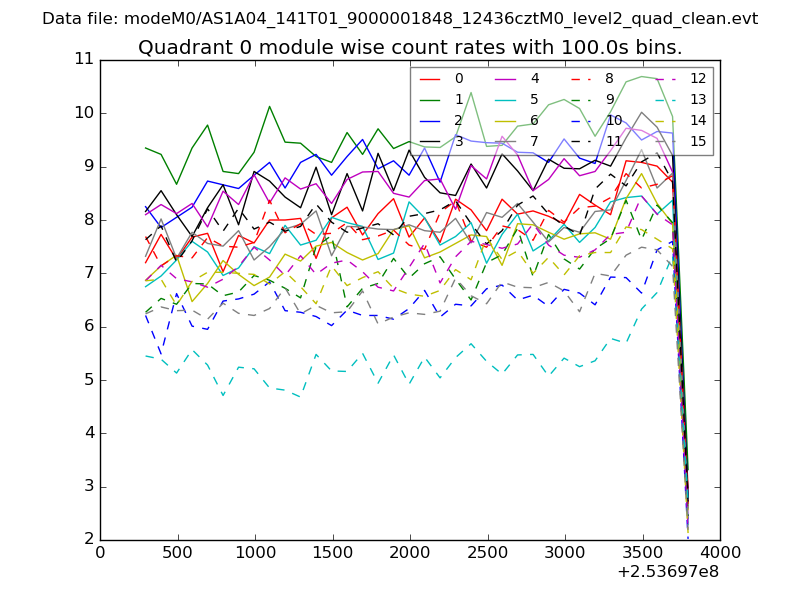 |
 |
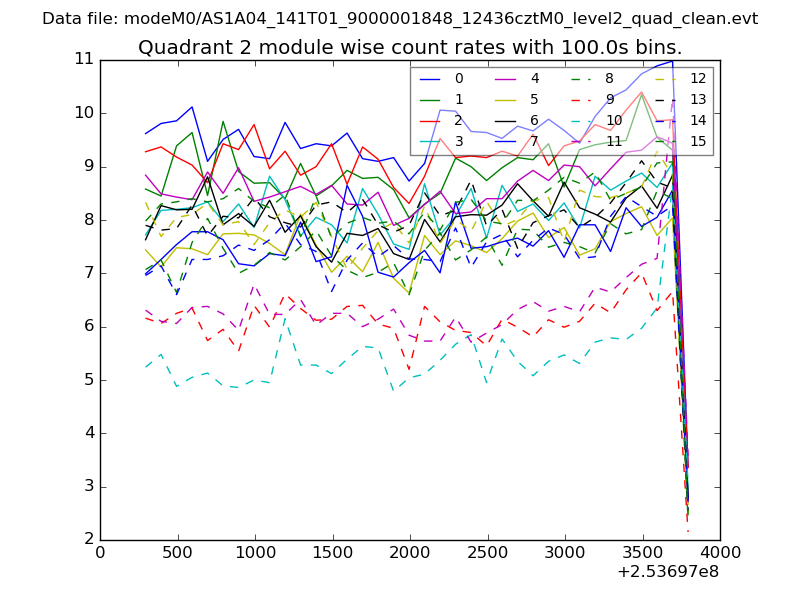
| Module-wise count rates for Quadrant B Data is divided into 100 sec bins |
 |
 |
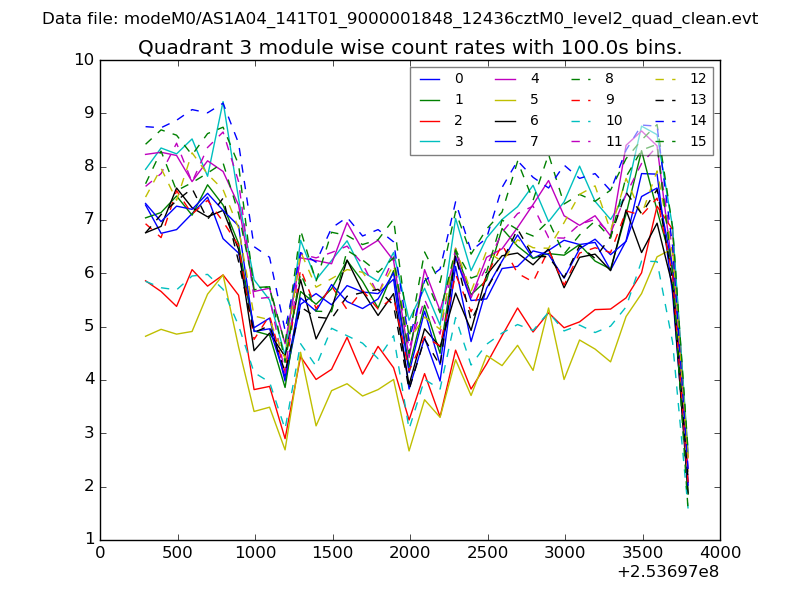
| Module-wise count rates for Quadrant C Data is divided into 100 sec bins |
 |
 |
| Module-wise count rates for Quadrant D Data is divided into 100 sec bins |
 |
 |
| Parameter | Plot |
|---|---|
| CZT HV Monitor | 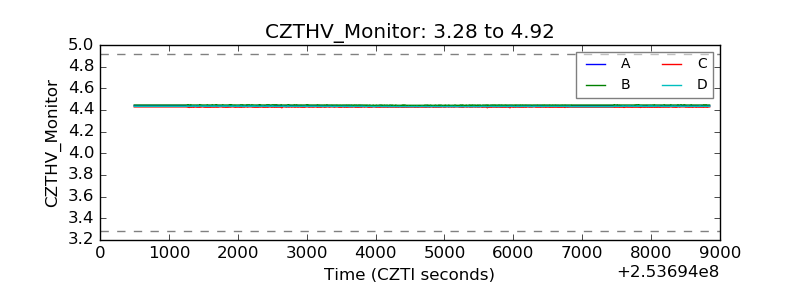 |
| D_VDD |  |
| Temperature 1 | 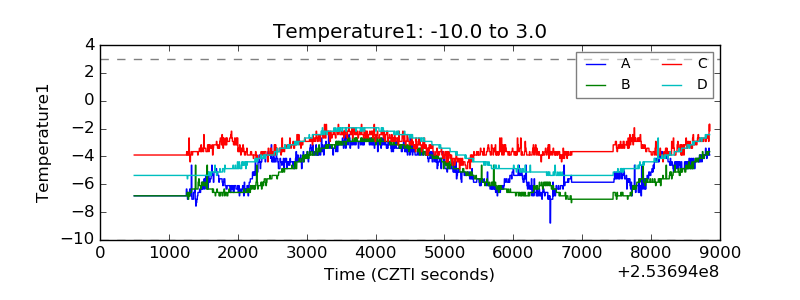 |
| Veto HV Monitor | 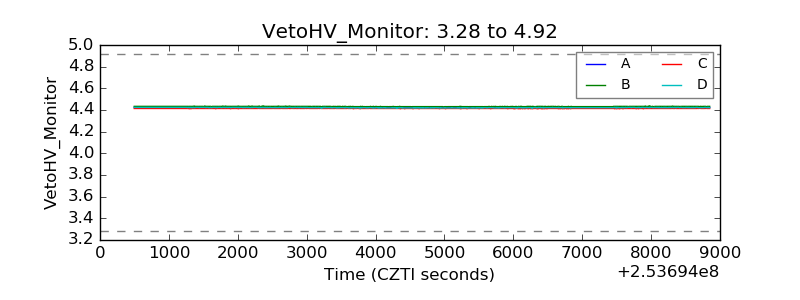 |
| Veto LLD | 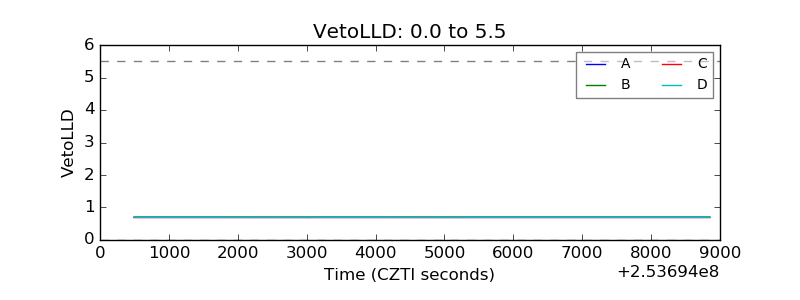 |
| Alpha Counter | 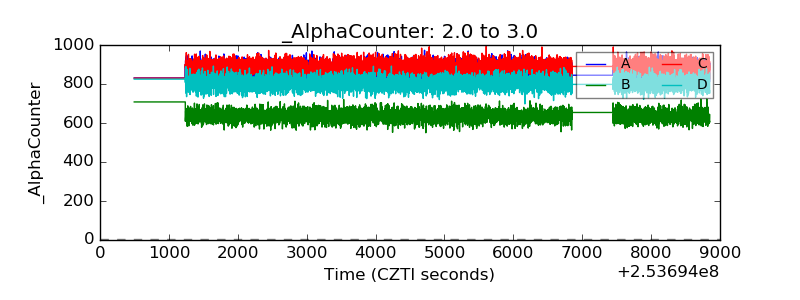 |
| _CPM_Rate | 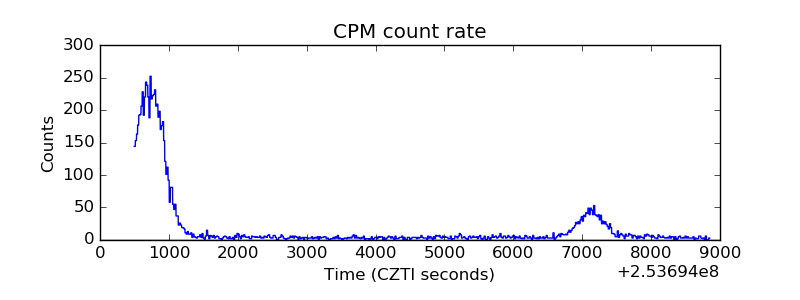 |
| CZT Counter | 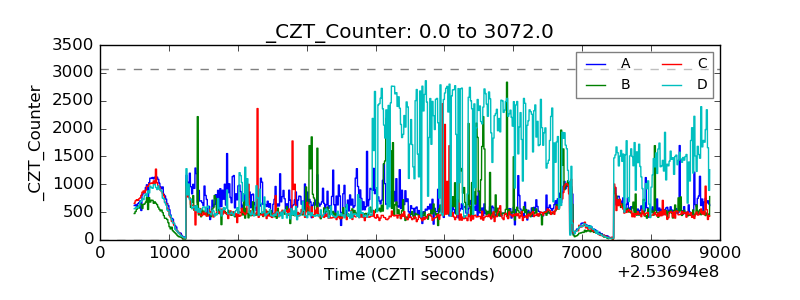 |
| +2.5 Volts monitor |  |
| +5 Volts monitor |  |
| _ROLL_ROT | 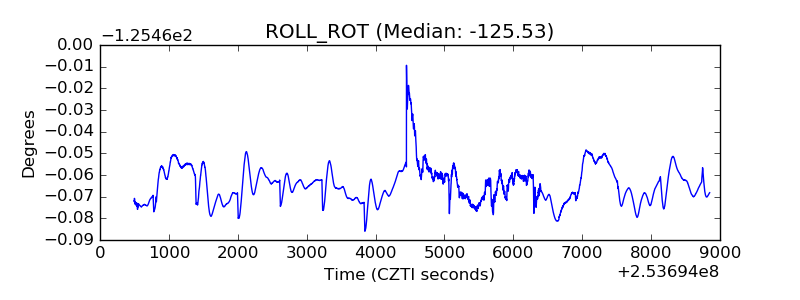 |
| _Roll_DEC | 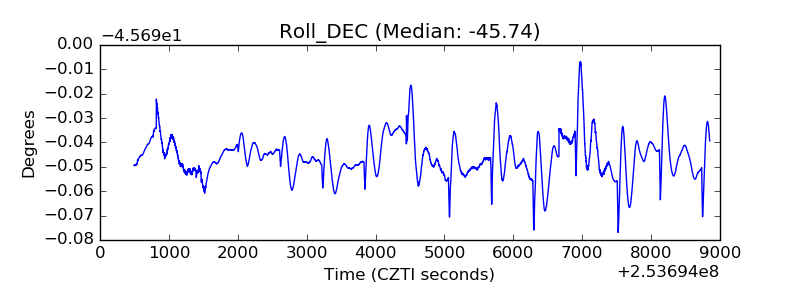 |
| _Roll_RA | 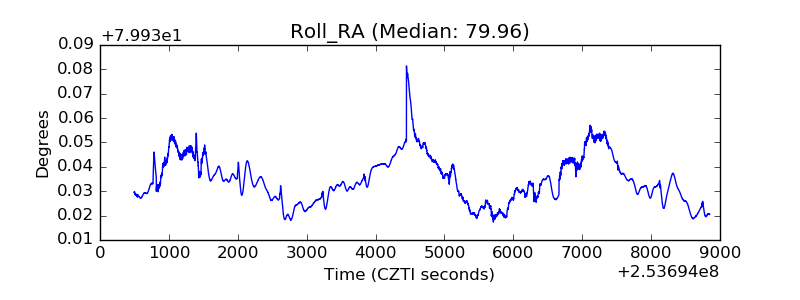 |
| Veto Counter | 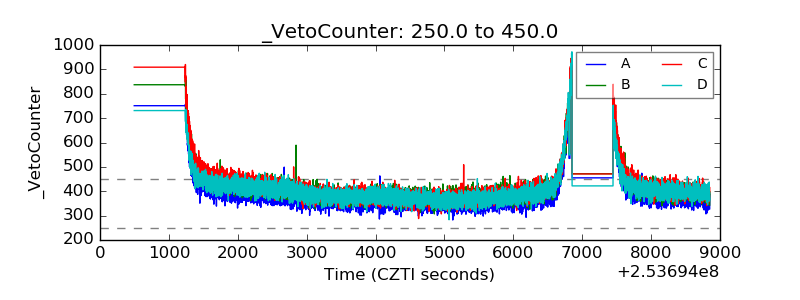 |