| Param | Original file | Final file |
|---|---|---|
| Filename | modeM0/AS1A04_141T01_9000001848_12437cztM0_level2.evt | modeM0/AS1A04_141T01_9000001848_12437cztM0_level2_quad_clean.evt |
| Size (bytes) | 778,752,000 | 84,908,160 |
| Size | 742.7 MB | 81.0 MB |
| Events in quadrant A | 5,168,695 | 520,466 |
| Events in quadrant B | 5,441,329 | 488,270 |
| Events in quadrant C | 4,011,017 | 528,578 |
| Events in quadrant D | 8,420,406 | 474,904 |
| Mode M9 | |||
|---|---|---|---|
| Quadrant | BADHDUFLAG | Total packets | Discarded packets |
| A | 0 | 7 | 0 |
| B | 0 | 7 | 0 |
| C | 0 | 7 | 0 |
| D | 0 | 7 | 0 |
| Mode M0 | |||
|---|---|---|---|
| Quadrant | BADHDUFLAG | Total packets | Discarded packets |
| A | 0 | 20621 | 3 |
| B | 0 | 21252 | 2 |
| C | 0 | 17444 | 2 |
| D | 0 | 30577 | 2 |
| Mode SS | |||
|---|---|---|---|
| Quadrant | BADHDUFLAG | Total packets | Discarded packets |
| A | 0 | 164 | 0 |
| B | 0 | 164 | 0 |
| C | 0 | 164 | 0 |
| D | 0 | 164 | 0 |
| Quadrant | Total seconds | Saturated seconds | Saturation percentage |
|---|---|---|---|
| A | 8035 | 515 | 6.409459% |
| B | 8035 | 1009 | 12.557561% |
| C | 8035 | 387 | 4.816428% |
| D | 8035 | 1265 | 15.743622% |
Noise dominated data is calculated using 1-second bins in cleaned event files. If a bin has >2000 counts, and if more than 50% of those come from <1% of pixels, then it is considered to be noise-dominated and hence unusable.
| Quadrant | # 1 sec bins | Bins with >0 counts | Bins with >2000 counts | High rate bins dominated by noise | Noise dominated (total time) | Noise dominated (detector-on time) | Marked lightcurve |
|---|---|---|---|---|---|---|---|
| A | 8721 | 8036 | 30 | 30 | 0.34% | 0.37% | 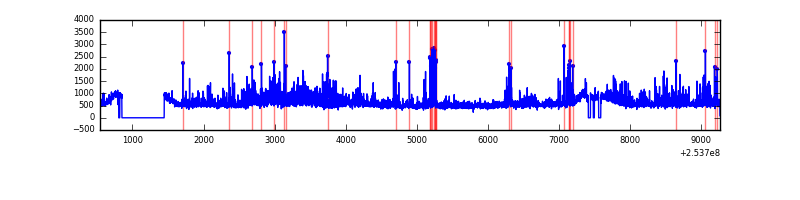 |
| B | 8721 | 8036 | 480 | 480 | 5.50% | 5.97% | 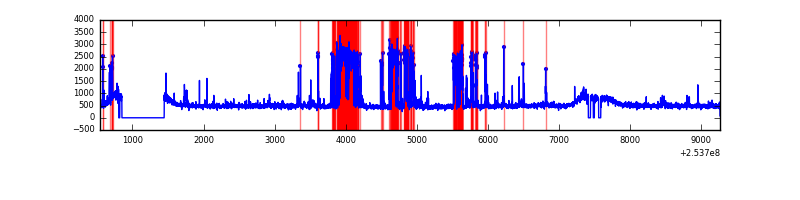 |
| C | 8721 | 8037 | 12 | 12 | 0.14% | 0.15% | 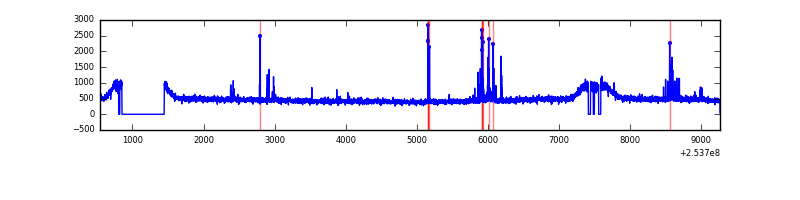 |
| D | 8721 | 8036 | 1079 | 1079 | 12.37% | 13.43% | 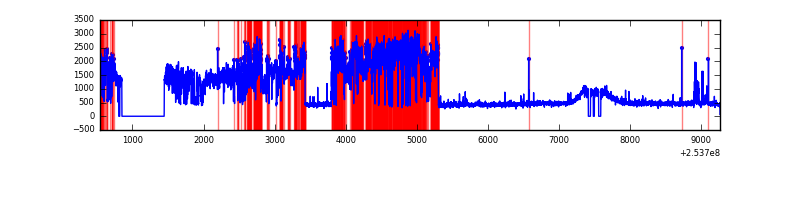 |
Top three noisy pixels from each quadrant. If the there are fewer than three noisy pixels in the level2.evt file, extra rows are filled as -1
| Pixel properties | Quadrant properties | ||||||
|---|---|---|---|---|---|---|---|
| Quadrant | DetID | PixID | Counts | Sigma | Mean | Median | Sigma |
| A | 13 | 251 | 665880 | 3255.83 | 998 | 973 | 204.2 |
| A | 15 | 239 | 242089 | 1180.67 | 998 | 973 | 204.2 |
| A | 1 | 162 | 142680 | 693.89 | 998 | 973 | 204.2 |
| B | 4 | 239 | 1501433 | 7935.43 | 970 | 942 | 189.1 |
| B | 3 | 209 | 37492 | 193.3 | 970 | 942 | 189.1 |
| B | 3 | 64 | 37427 | 192.95 | 970 | 942 | 189.1 |
| C | 15 | 208 | 104250 | 447.29 | 990 | 991 | 230.9 |
| C | 14 | 234 | 35536 | 149.64 | 990 | 991 | 230.9 |
| C | 8 | 112 | 9489 | 36.81 | 990 | 991 | 230.9 |
| D | 1 | 52 | 4700050 | 20380.77 | 958 | 928 | 230.6 |
| D | 13 | 249 | 47327 | 201.24 | 958 | 928 | 230.6 |
| D | 2 | 234 | 29138 | 122.35 | 958 | 928 | 230.6 |
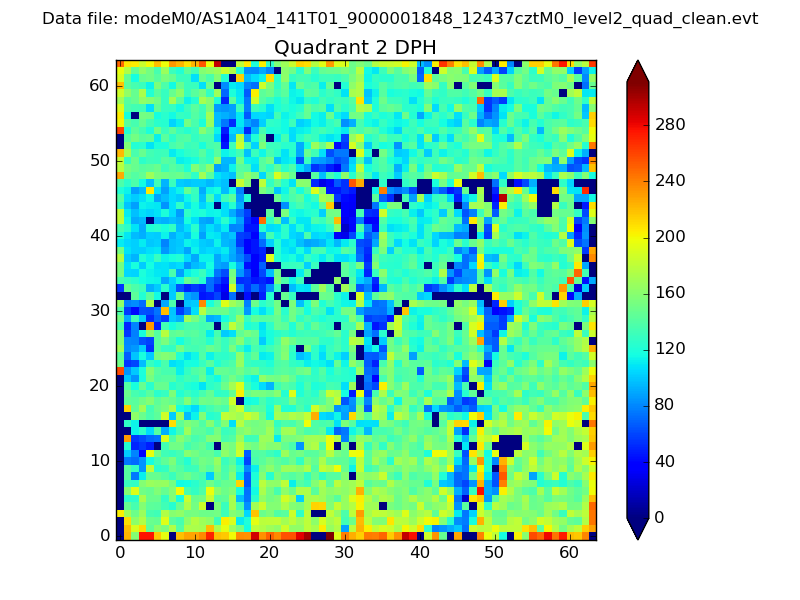
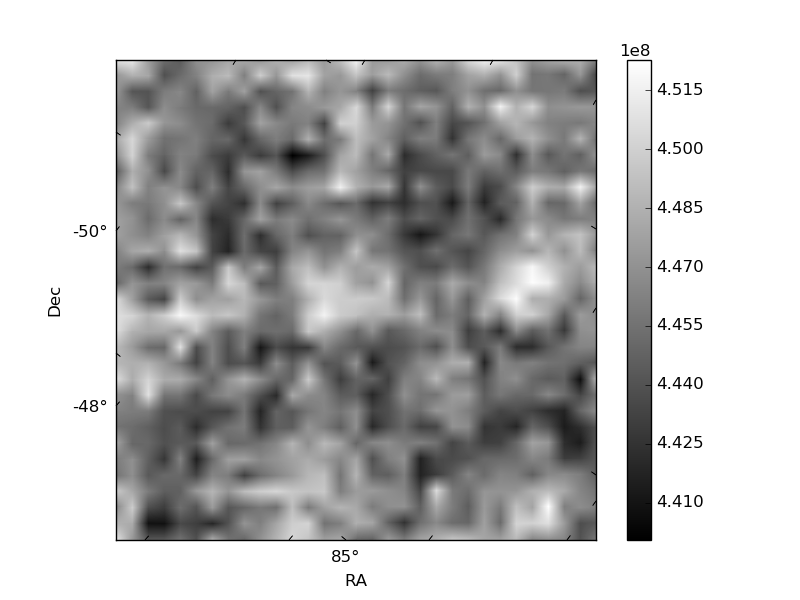
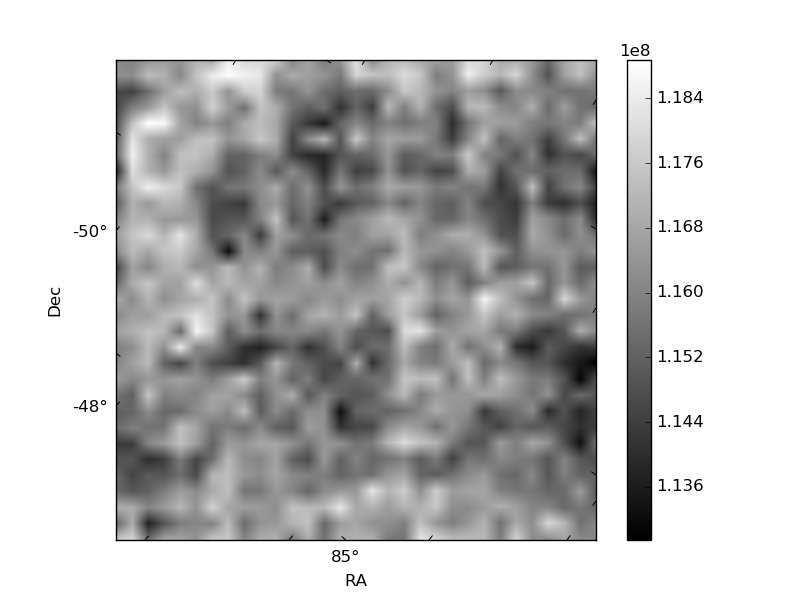
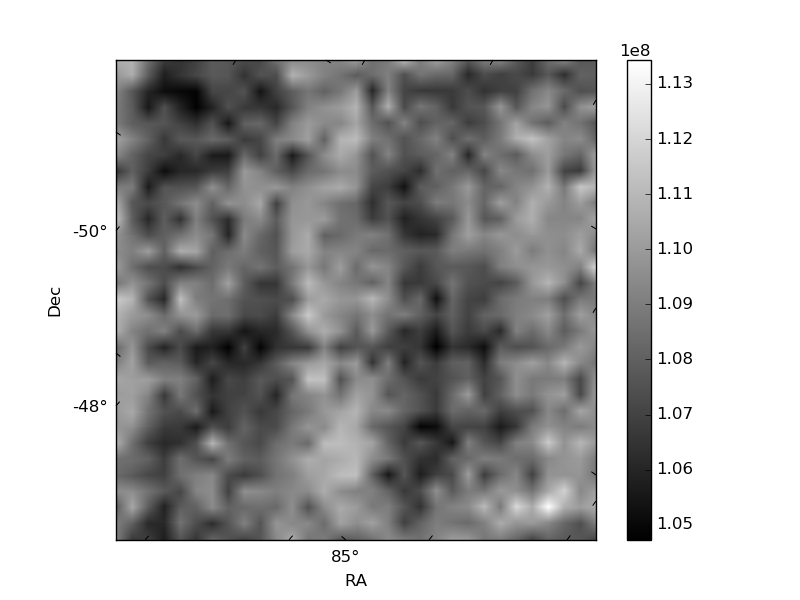
Histogram calculated using DETX and DETY for each event in the final _common_clean file
| Quadrant A | 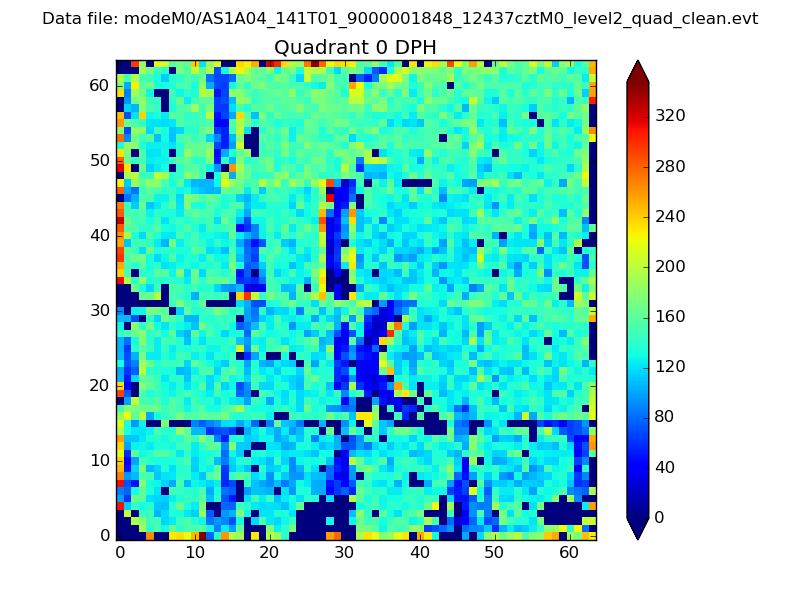 |
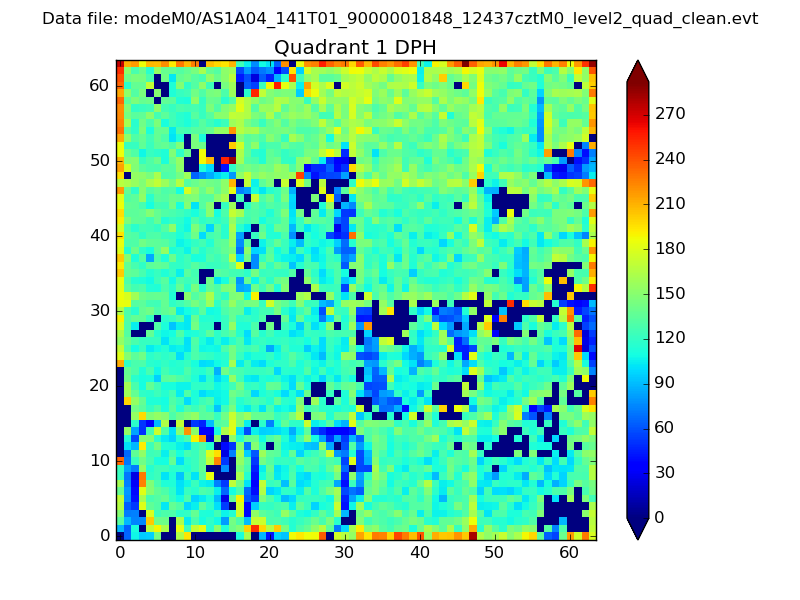 |
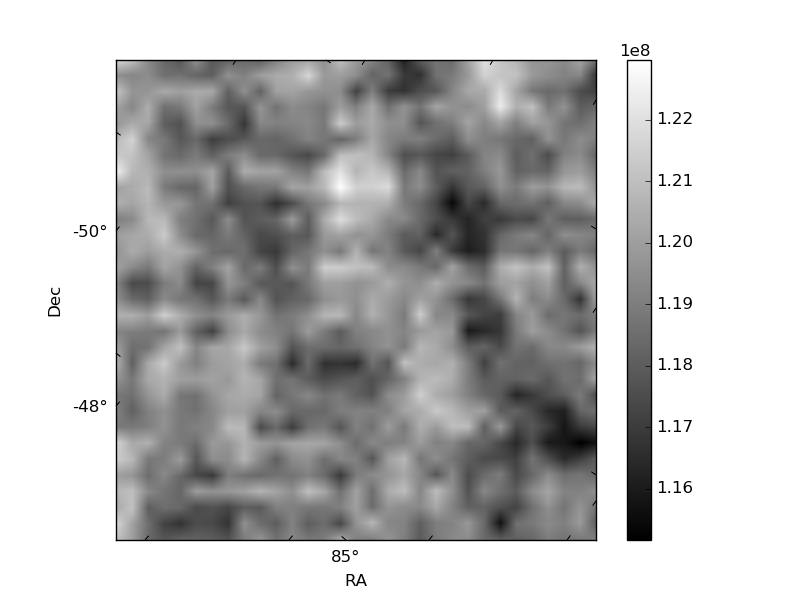
Quadrant B |
|---|---|---|---|
| Quadrant D | 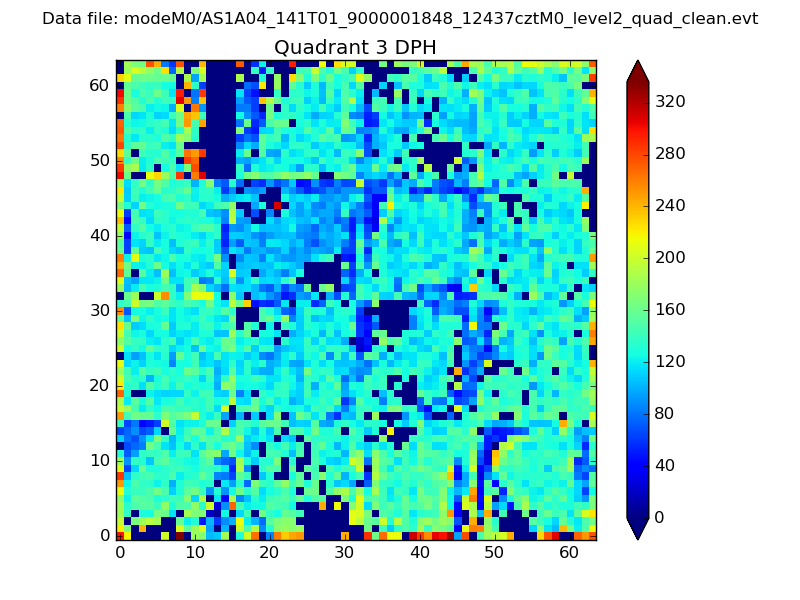 |
 |
Quadrant C |
| Plot type | Count rate plots | Images |
|---|---|---|
| Comparison with Poisson distribution Blue bars denote a histogram of data divided into 1 sec bins. Red curve is a Poisson curve with rate = median count rate of data. |
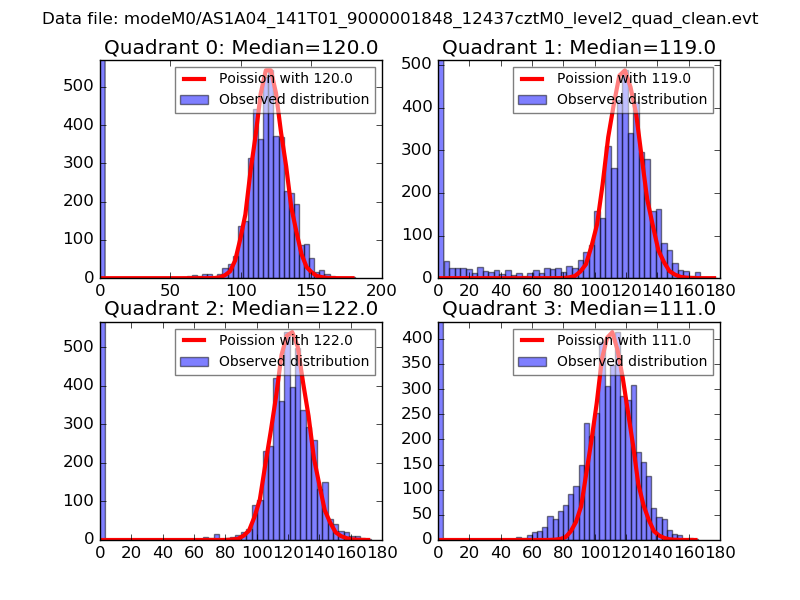 |
 |
| Quadrant-wise count rates Data is divided into 100 sec bins |
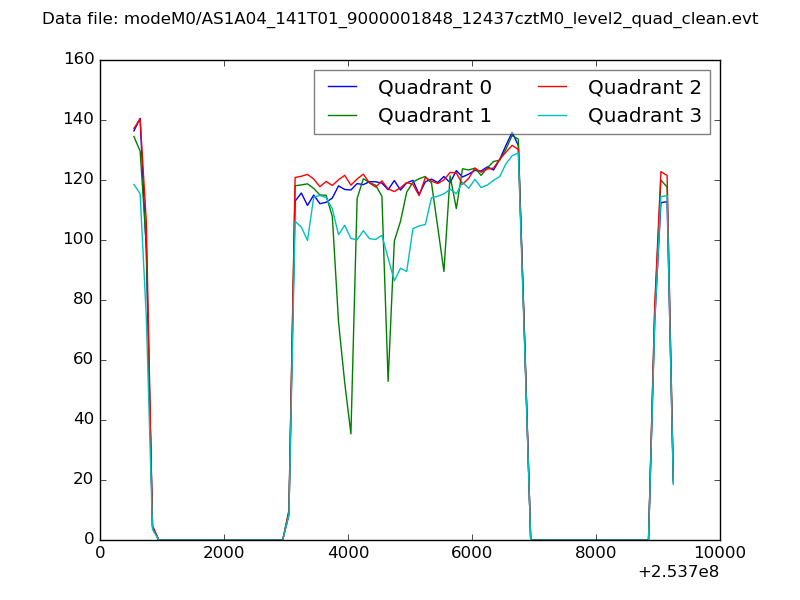 |
|
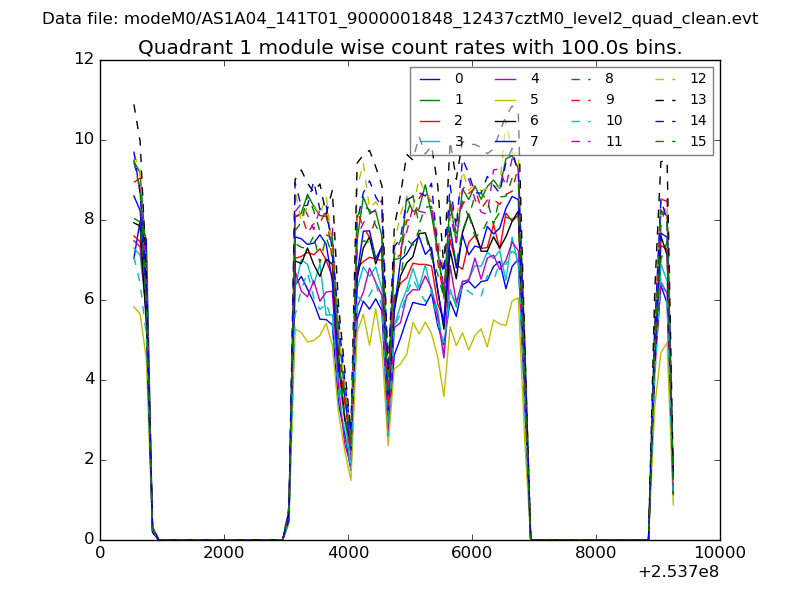
| Module-wise count rates for Quadrant A Data is divided into 100 sec bins |
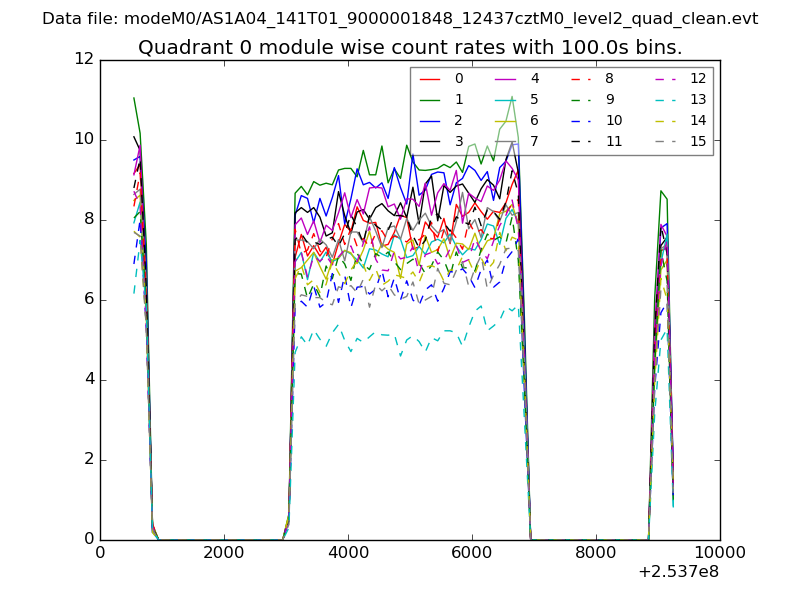 |
 |
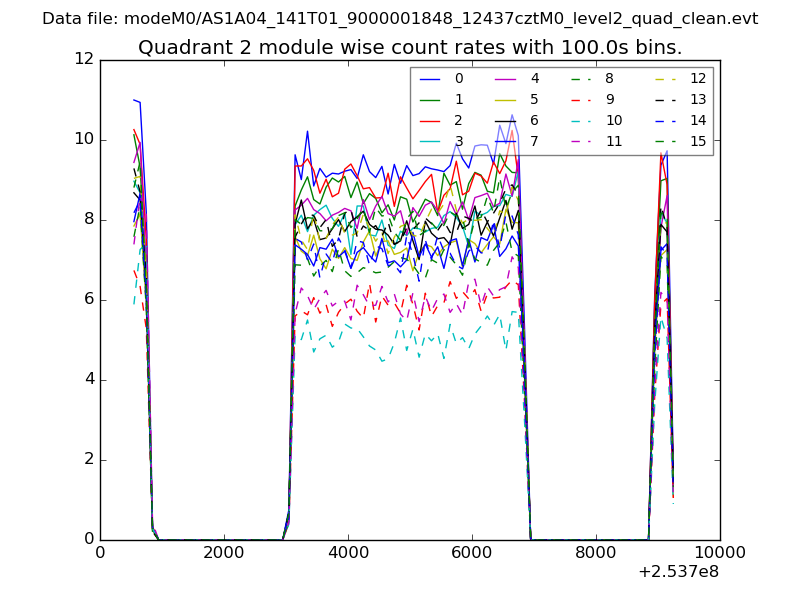
| Module-wise count rates for Quadrant B Data is divided into 100 sec bins |
 |
 |
| Module-wise count rates for Quadrant C Data is divided into 100 sec bins |
 |
 |
| Module-wise count rates for Quadrant D Data is divided into 100 sec bins |
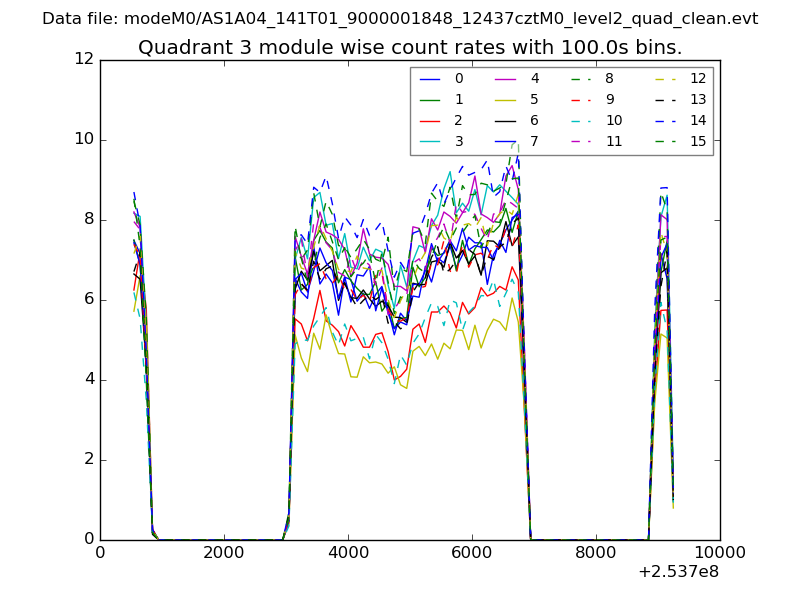 |
 |
| Parameter | Plot |
|---|---|
| CZT HV Monitor | 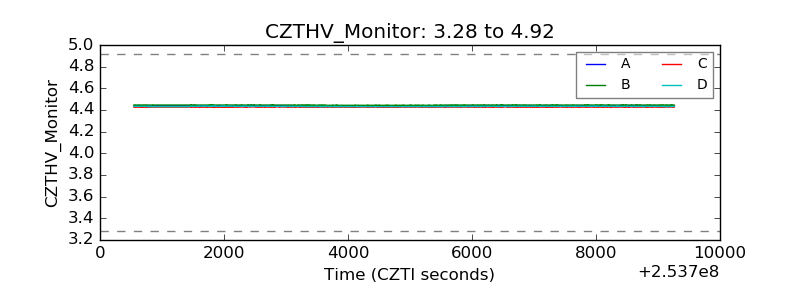 |
| D_VDD | 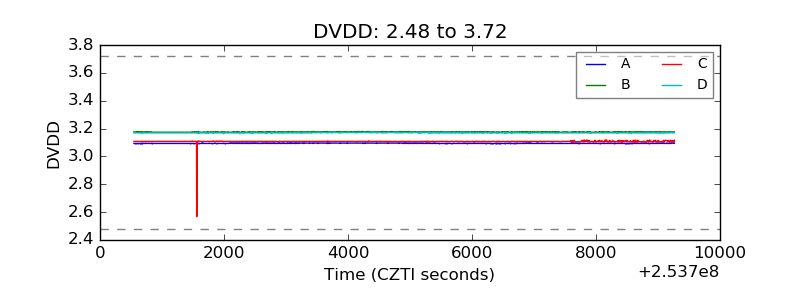 |
| Temperature 1 | 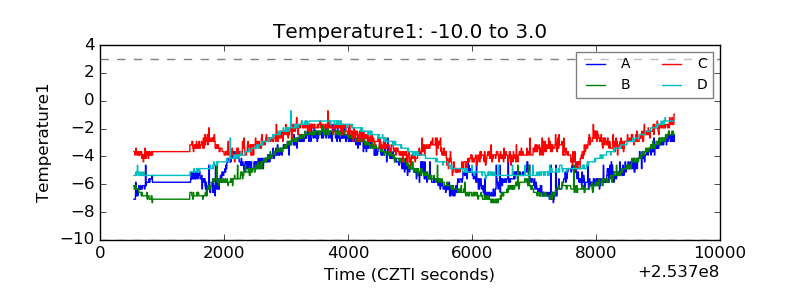 |
| Veto HV Monitor | 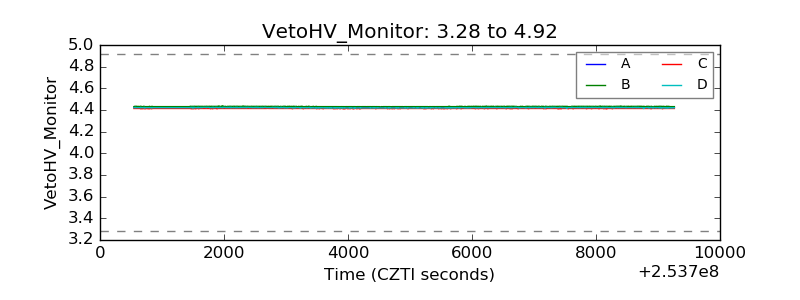 |
| Veto LLD | 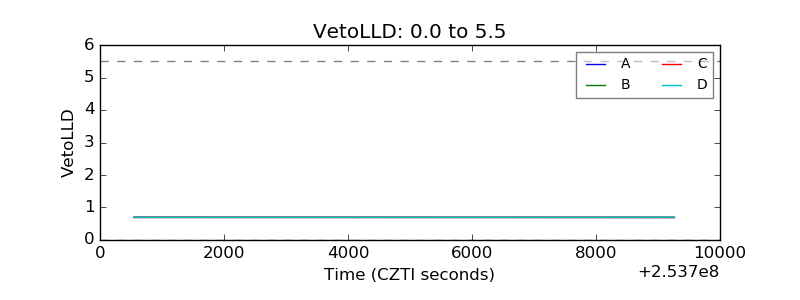 |
| Alpha Counter | 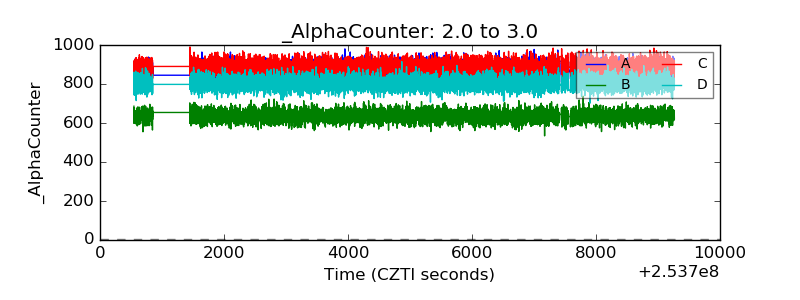 |
| _CPM_Rate | 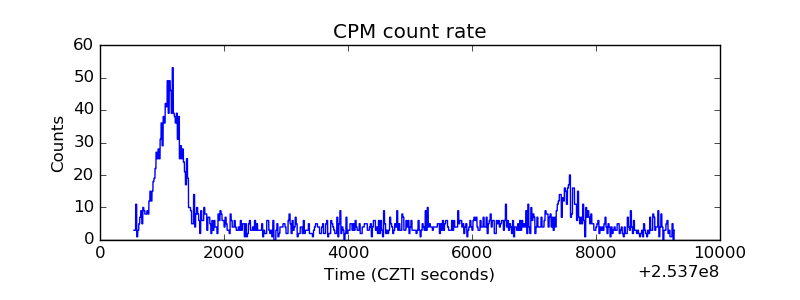 |
| CZT Counter | 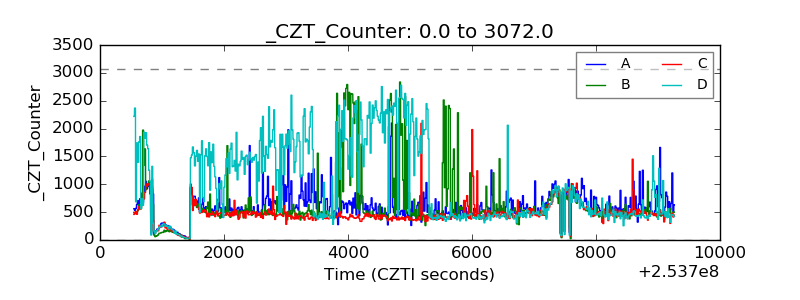 |
| +2.5 Volts monitor |  |
| +5 Volts monitor |  |
| _ROLL_ROT | 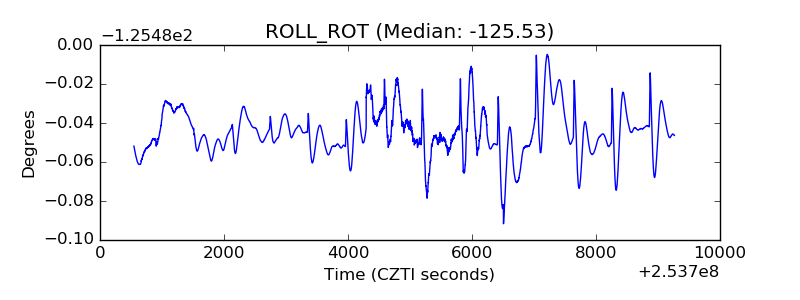 |
| _Roll_DEC | 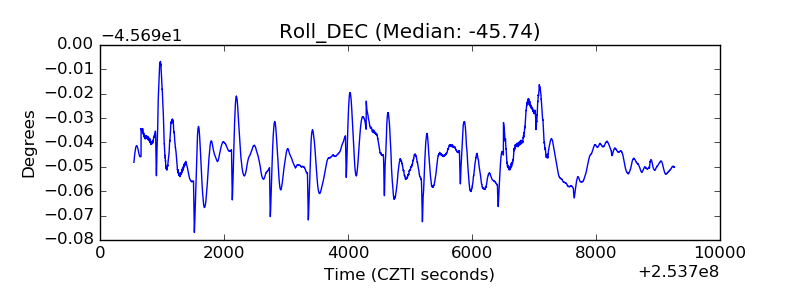 |
| _Roll_RA | 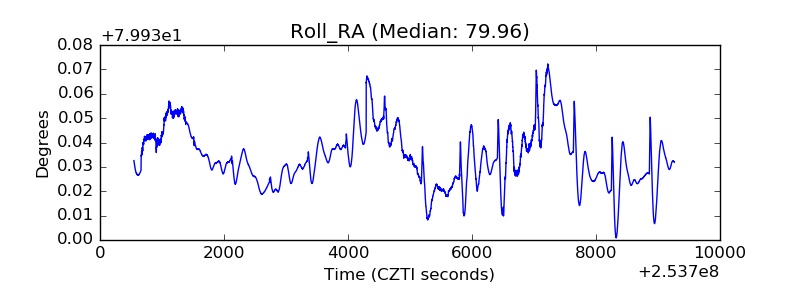 |
| Veto Counter | 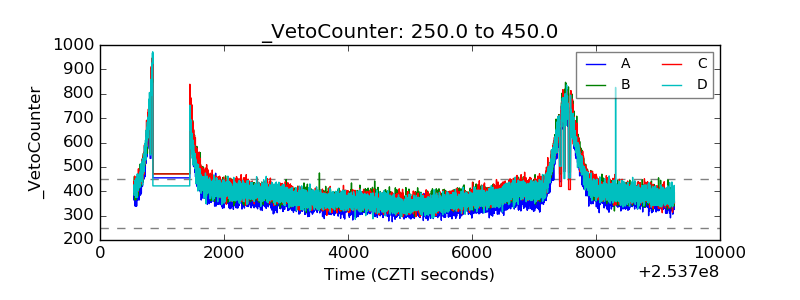 |