| Param | Original file | Final file |
|---|---|---|
| Filename | modeM0/AS1A04_141T01_9000001848_12438cztM0_level2.evt | modeM0/AS1A04_141T01_9000001848_12438cztM0_level2_quad_clean.evt |
| Size (bytes) | 318,525,120 | 52,989,120 |
| Size | 303.8 MB | 50.5 MB |
| Events in quadrant A | 2,337,185 | 333,990 |
| Events in quadrant B | 2,079,445 | 335,086 |
| Events in quadrant C | 1,743,174 | 340,403 |
| Events in quadrant D | 3,217,210 | 315,646 |
| Mode M0 | |||
|---|---|---|---|
| Quadrant | BADHDUFLAG | Total packets | Discarded packets |
| A | 0 | 9545 | 0 |
| B | 0 | 8806 | 0 |
| C | 0 | 8107 | 0 |
| D | 0 | 12315 | 0 |
| Mode SS | |||
|---|---|---|---|
| Quadrant | BADHDUFLAG | Total packets | Discarded packets |
| A | 0 | 78 | 0 |
| B | 0 | 78 | 0 |
| C | 0 | 78 | 0 |
| D | 0 | 78 | 0 |
| Quadrant | Total seconds | Saturated seconds | Saturation percentage |
|---|---|---|---|
| A | 3959 | 29 | 0.732508% |
| B | 3959 | 98 | 2.475373% |
| C | 3959 | 5 | 0.126295% |
| D | 3959 | 187 | 4.723415% |
Noise dominated data is calculated using 1-second bins in cleaned event files. If a bin has >2000 counts, and if more than 50% of those come from <1% of pixels, then it is considered to be noise-dominated and hence unusable.
| Quadrant | # 1 sec bins | Bins with >0 counts | Bins with >2000 counts | High rate bins dominated by noise | Noise dominated (total time) | Noise dominated (detector-on time) | Marked lightcurve |
|---|---|---|---|---|---|---|---|
| A | 3960 | 3960 | 17 | 17 | 0.43% | 0.43% | 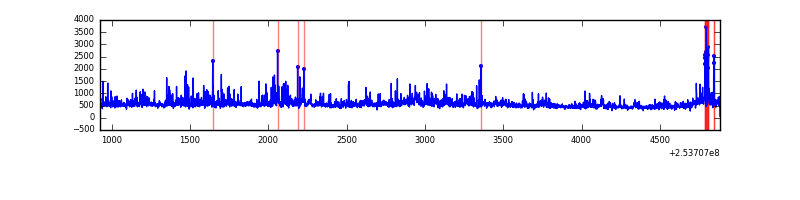 |
| B | 3960 | 3960 | 78 | 78 | 1.97% | 1.97% |  |
| C | 3960 | 3960 | 4 | 4 | 0.10% | 0.10% | 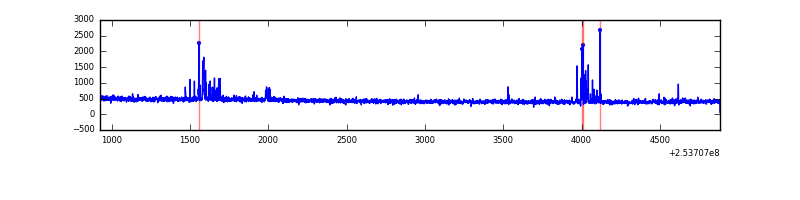 |
| D | 3960 | 3960 | 337 | 337 | 8.51% | 8.51% | 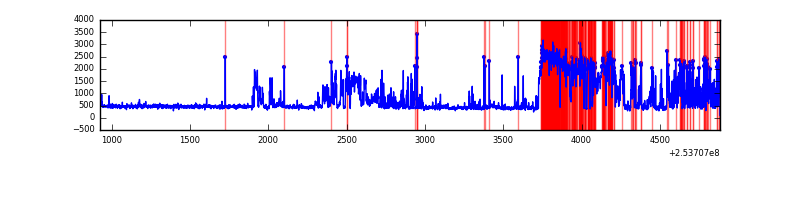 |
Top three noisy pixels from each quadrant. If the there are fewer than three noisy pixels in the level2.evt file, extra rows are filled as -1
| Pixel properties | Quadrant properties | ||||||
|---|---|---|---|---|---|---|---|
| Quadrant | DetID | PixID | Counts | Sigma | Mean | Median | Sigma |
| A | 13 | 251 | 309888 | 3385.73 | 440 | 431 | 91.4 |
| A | 1 | 162 | 71397 | 776.43 | 440 | 431 | 91.4 |
| A | 12 | 189 | 50336 | 546.0 | 440 | 431 | 91.4 |
| B | 4 | 239 | 274772 | 3199.16 | 438 | 426 | 85.8 |
| B | 3 | 209 | 35773 | 412.18 | 438 | 426 | 85.8 |
| B | 3 | 64 | 31972 | 367.85 | 438 | 426 | 85.8 |
| C | 15 | 208 | 66370 | 657.08 | 425 | 425 | 100.4 |
| C | 8 | 128 | 7167 | 67.18 | 425 | 425 | 100.4 |
| C | 14 | 234 | 4330 | 38.91 | 425 | 425 | 100.4 |
| D | 1 | 52 | 1519524 | 14701.46 | 421 | 408 | 103.3 |
| D | 13 | 104 | 30398 | 290.23 | 421 | 408 | 103.3 |
| D | 13 | 249 | 25927 | 246.96 | 421 | 408 | 103.3 |
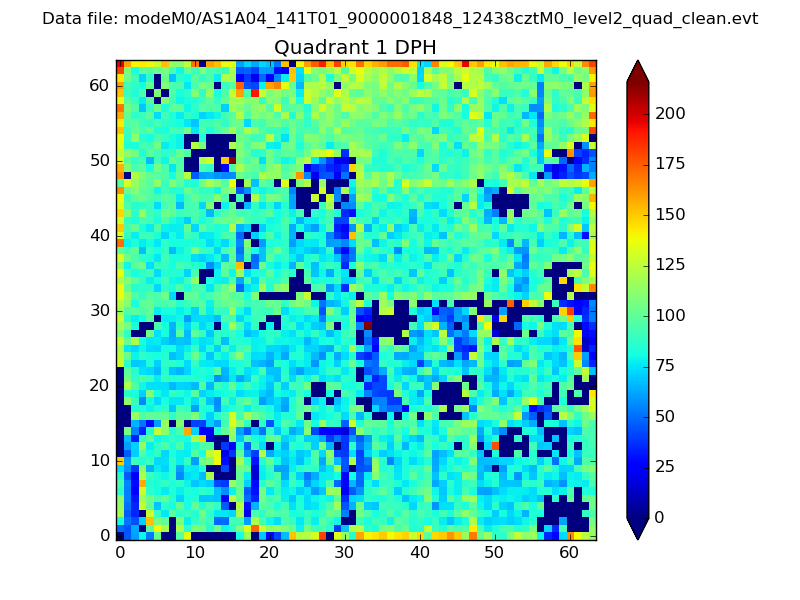
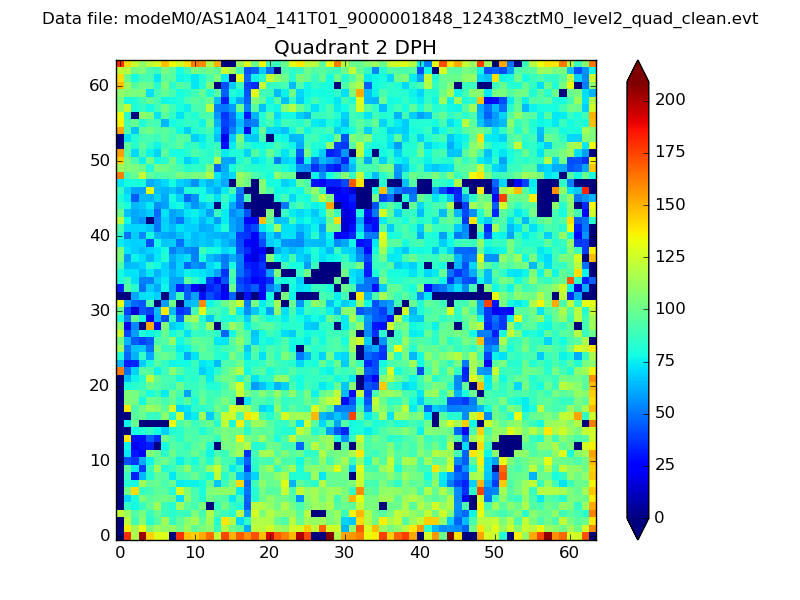
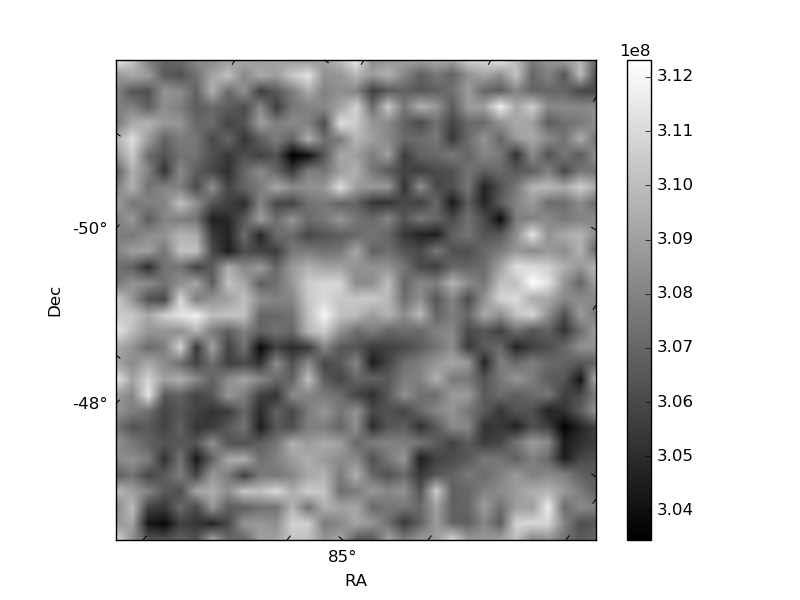
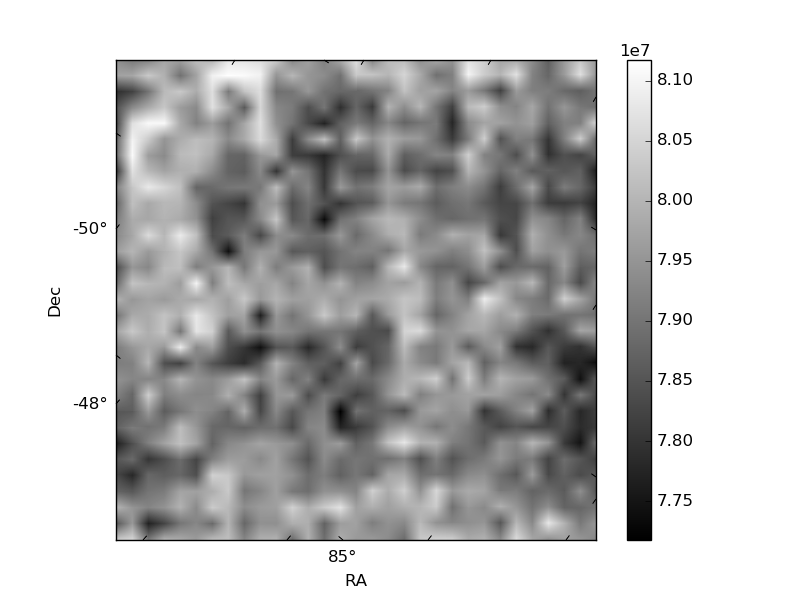
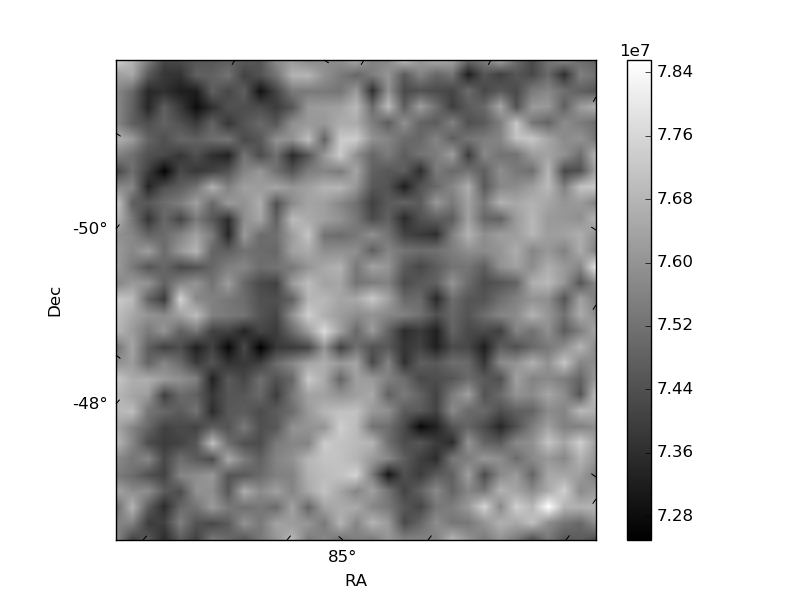
Histogram calculated using DETX and DETY for each event in the final _common_clean file
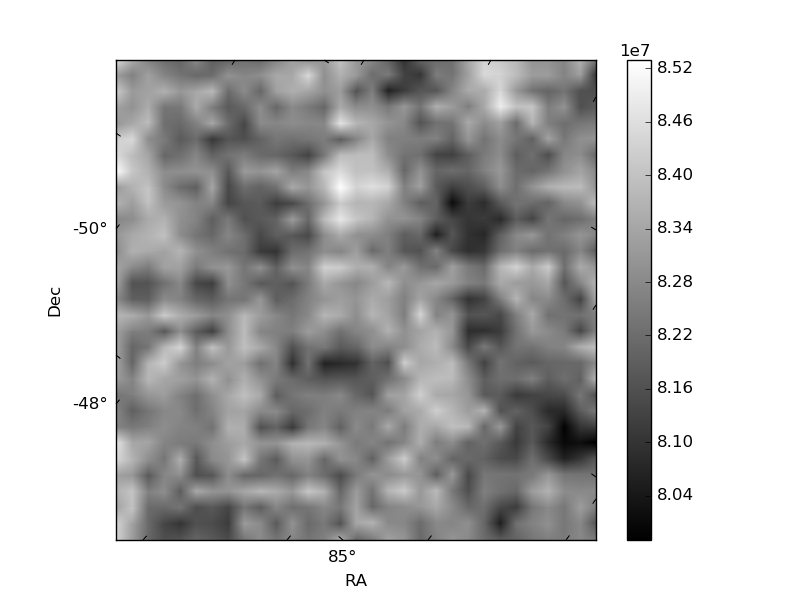
| Quadrant A | 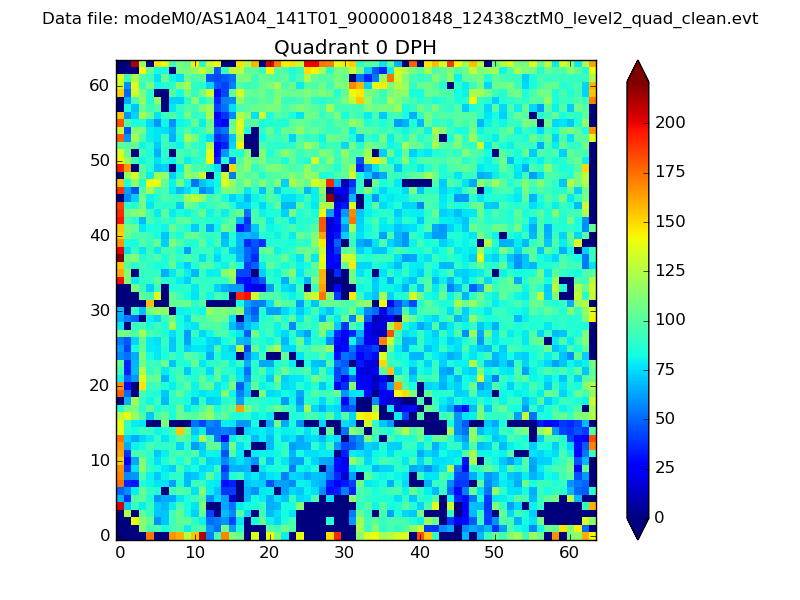 |
 |
Quadrant B |
|---|---|---|---|
| Quadrant D | 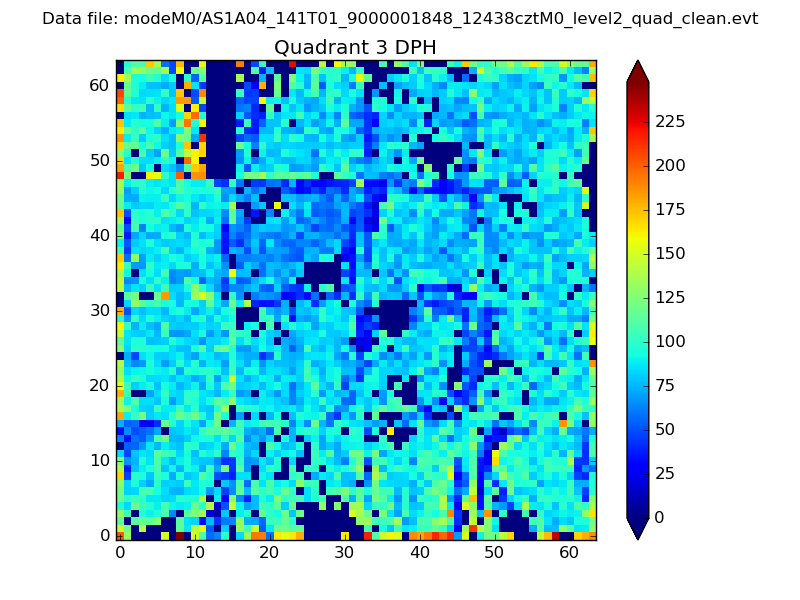 |
 |
Quadrant C |
| Plot type | Count rate plots | Images |
|---|---|---|
| Comparison with Poisson distribution Blue bars denote a histogram of data divided into 1 sec bins. Red curve is a Poisson curve with rate = median count rate of data. |
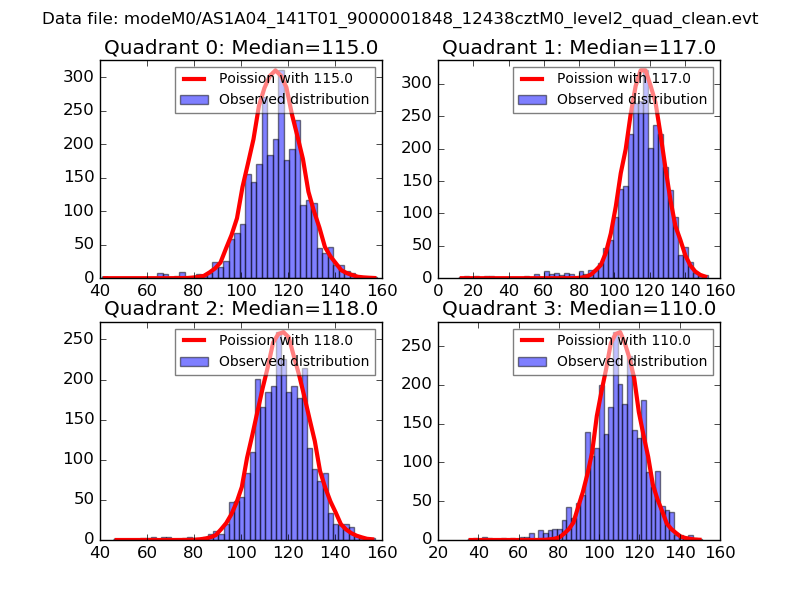 |
 |
| Quadrant-wise count rates Data is divided into 100 sec bins |
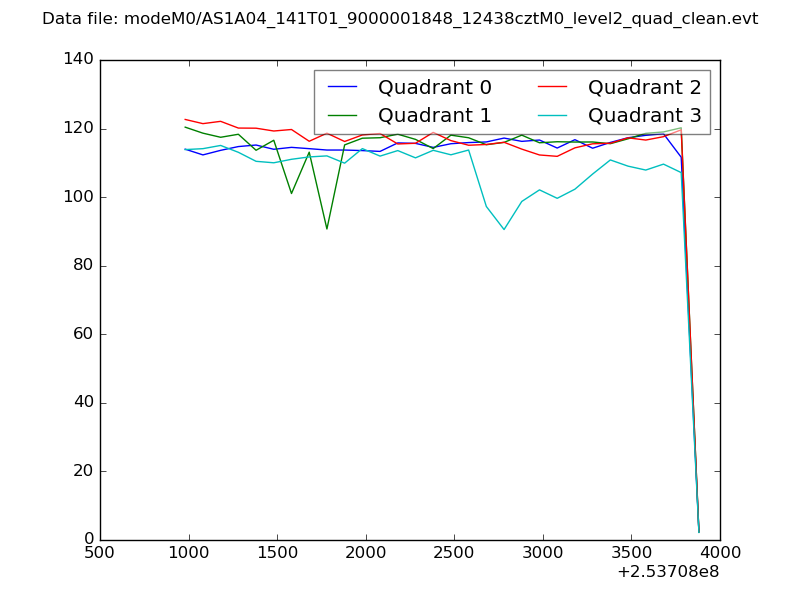 |
|
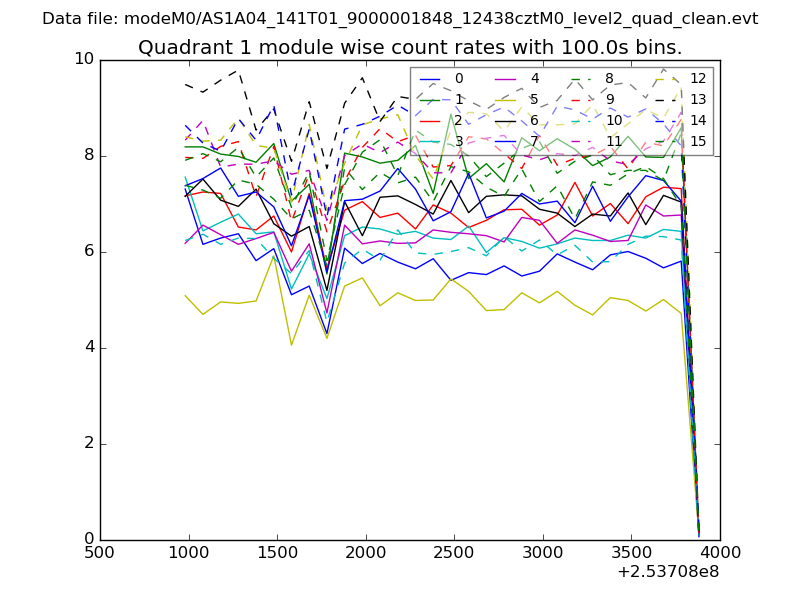
| Module-wise count rates for Quadrant A Data is divided into 100 sec bins |
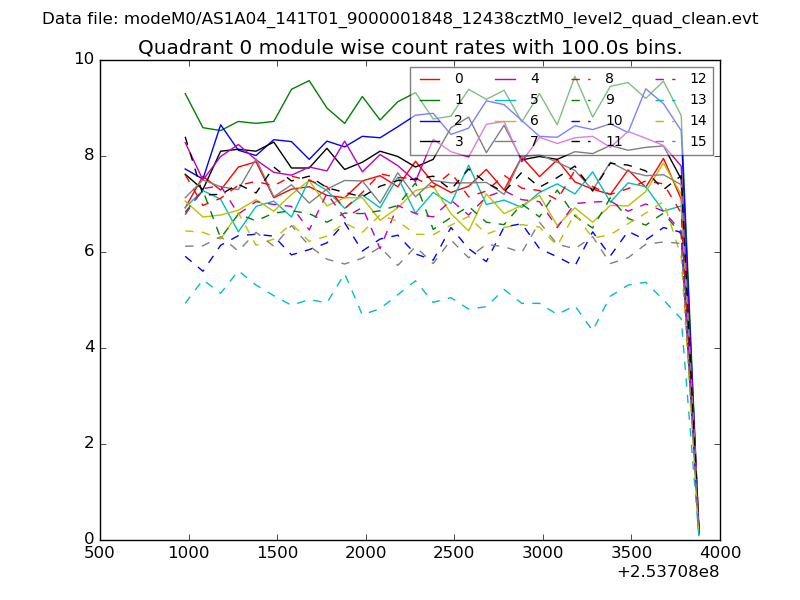 |
 |
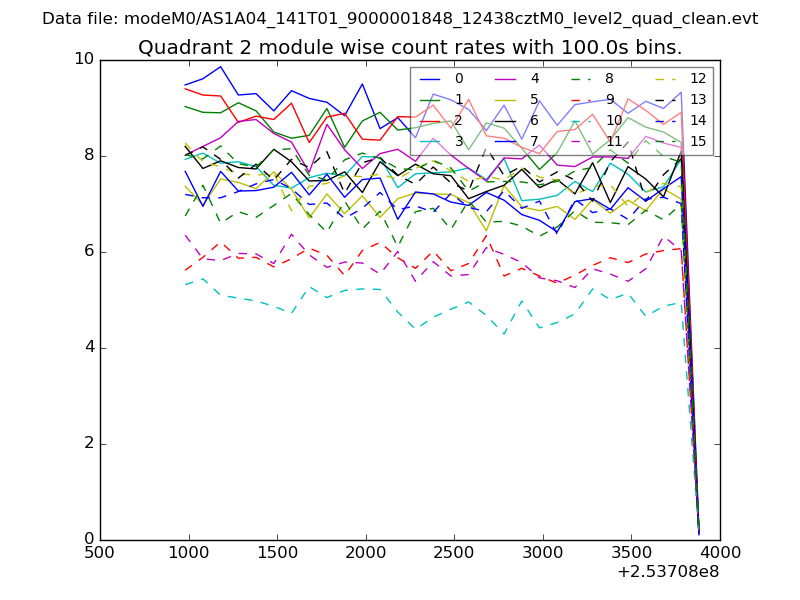
| Module-wise count rates for Quadrant B Data is divided into 100 sec bins |
 |
 |
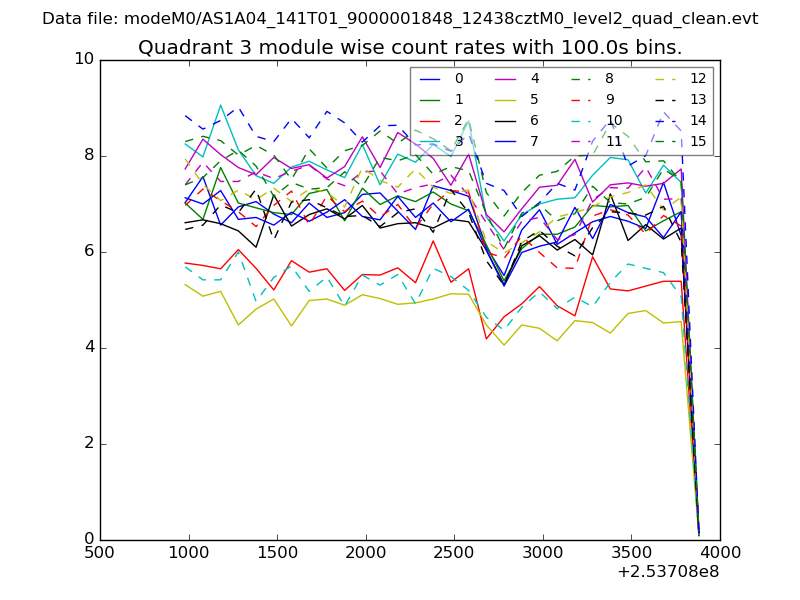
| Module-wise count rates for Quadrant C Data is divided into 100 sec bins |
 |
 |
| Module-wise count rates for Quadrant D Data is divided into 100 sec bins |
 |
 |
| Parameter | Plot |
|---|---|
| CZT HV Monitor | 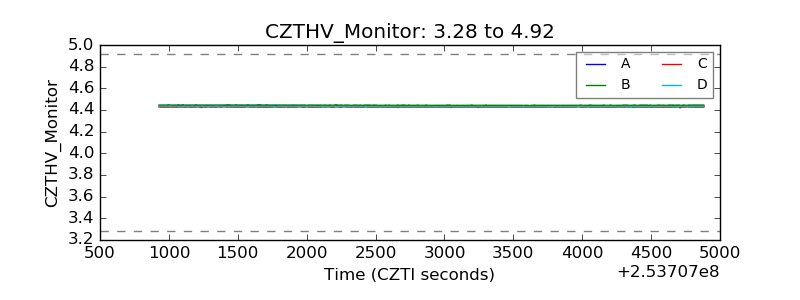 |
| D_VDD | 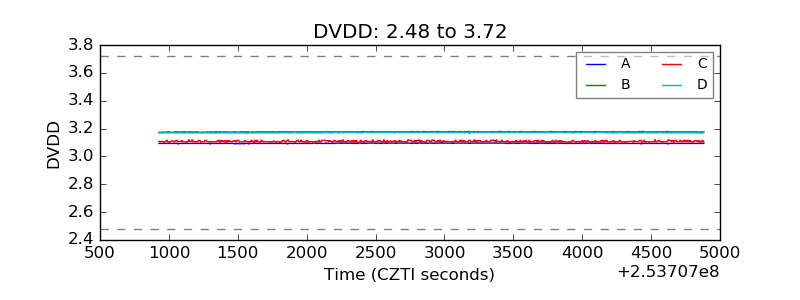 |
| Temperature 1 |  |
| Veto HV Monitor | 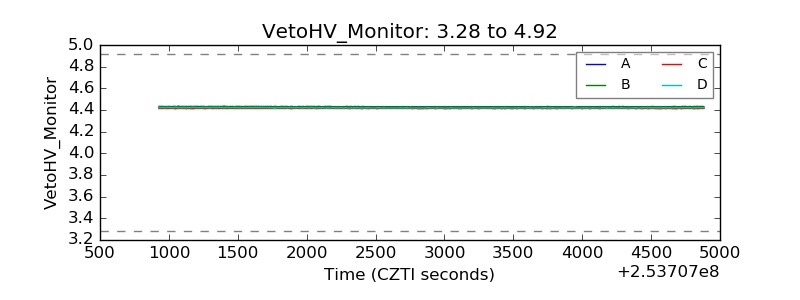 |
| Veto LLD | 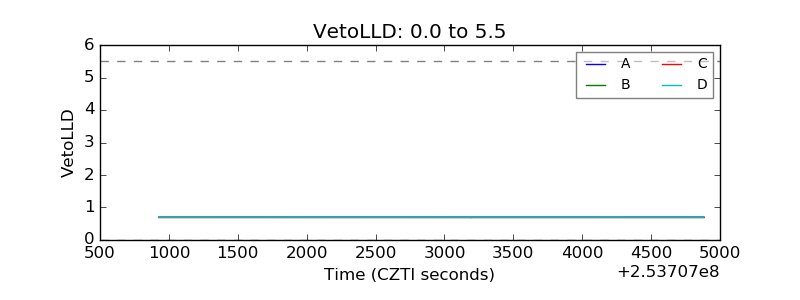 |
| Alpha Counter | 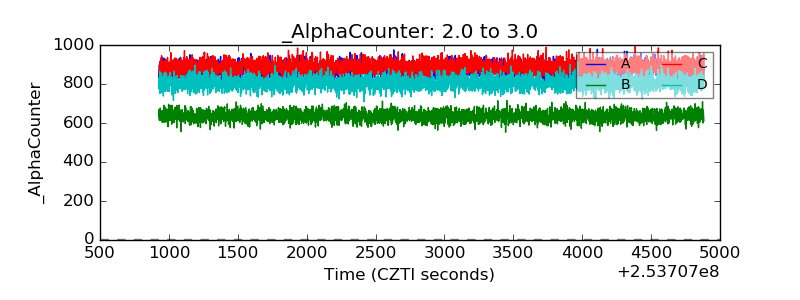 |
| _CPM_Rate | 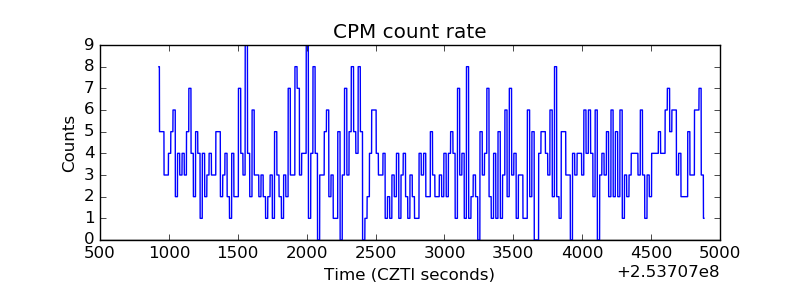 |
| CZT Counter | 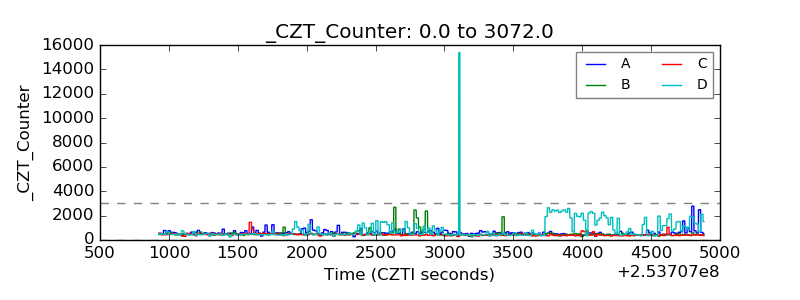 |
| +2.5 Volts monitor | 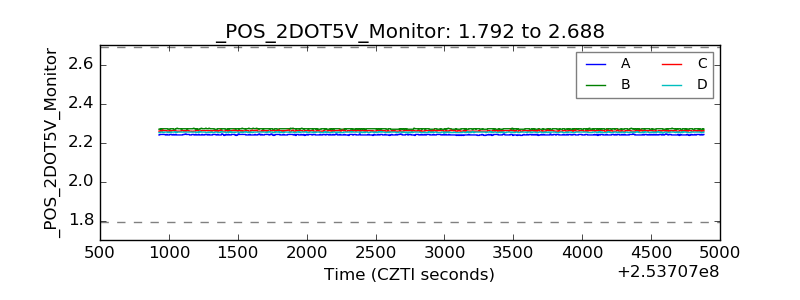 |
| +5 Volts monitor |  |
| _ROLL_ROT | 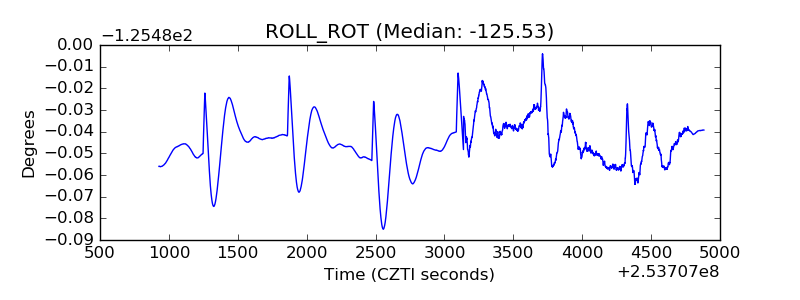 |
| _Roll_DEC | 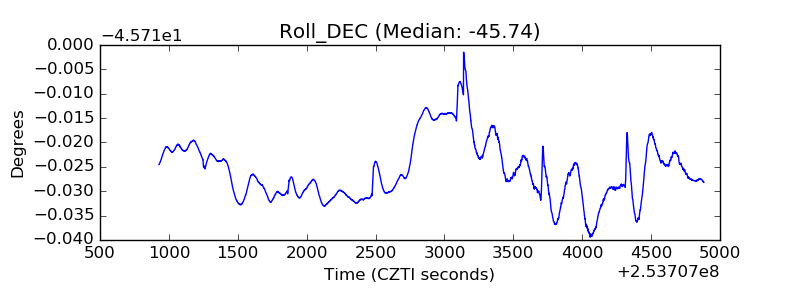 |
| _Roll_RA | 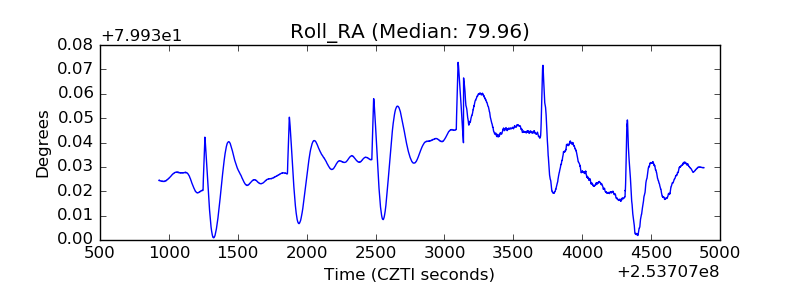 |
| Veto Counter | 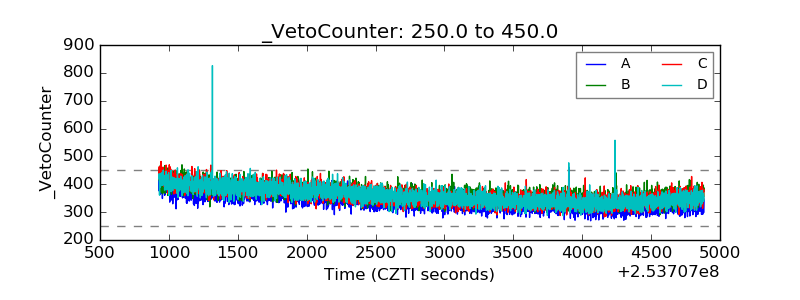 |