| Param | Original file | Final file |
|---|---|---|
| Filename | modeM0/AS1A04_174T01_9000001850_12438cztM0_level2.evt | modeM0/AS1A04_174T01_9000001850_12438cztM0_level2_quad_clean.evt |
| Size (bytes) | 307,834,560 | 17,251,200 |
| Size | 293.6 MB | 16.5 MB |
| Events in quadrant A | 4,379,943 | 77,022 |
| Events in quadrant B | 1,540,196 | 84,353 |
| Events in quadrant C | 1,537,100 | 83,683 |
| Events in quadrant D | 1,677,600 | 80,455 |
| Mode M0 | |||
|---|---|---|---|
| Quadrant | BADHDUFLAG | Total packets | Discarded packets |
| A | 0 | 14936 | 2 |
| B | 0 | 6249 | 1 |
| C | 0 | 6286 | 1 |
| D | 0 | 6779 | 1 |
| Mode SS | |||
|---|---|---|---|
| Quadrant | BADHDUFLAG | Total packets | Discarded packets |
| A | 0 | 54 | 0 |
| B | 0 | 54 | 0 |
| C | 0 | 54 | 0 |
| D | 0 | 54 | 0 |
| Quadrant | Total seconds | Saturated seconds | Saturation percentage |
|---|---|---|---|
| A | 2743 | 1426 | 51.986876% |
| B | 2743 | 279 | 10.171345% |
| C | 2743 | 196 | 7.145461% |
| D | 2743 | 259 | 9.442217% |
Noise dominated data is calculated using 1-second bins in cleaned event files. If a bin has >2000 counts, and if more than 50% of those come from <1% of pixels, then it is considered to be noise-dominated and hence unusable.
| Quadrant | # 1 sec bins | Bins with >0 counts | Bins with >2000 counts | High rate bins dominated by noise | Noise dominated (total time) | Noise dominated (detector-on time) | Marked lightcurve |
|---|---|---|---|---|---|---|---|
| A | 2789 | 2744 | 663 | 663 | 23.77% | 24.16% | 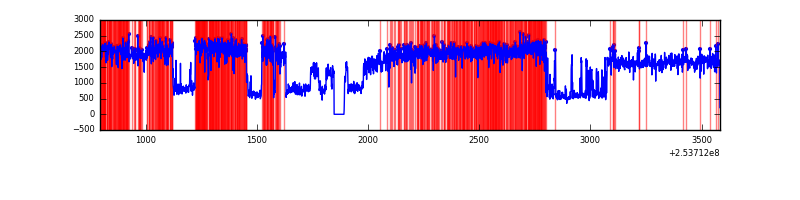 |
| B | 2789 | 2744 | 3 | 3 | 0.11% | 0.11% | 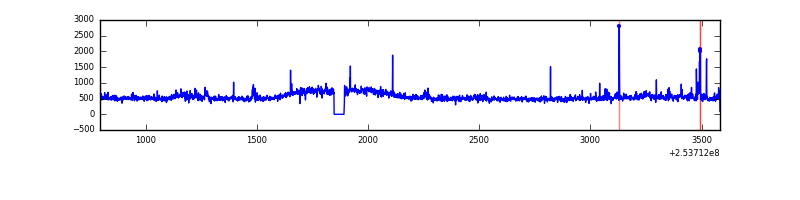 |
| C | 2789 | 2745 | 18 | 18 | 0.65% | 0.66% | 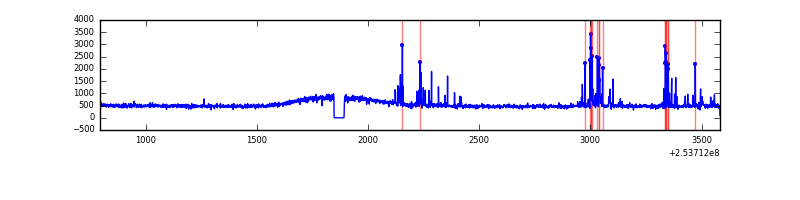 |
| D | 2789 | 2744 | 54 | 54 | 1.94% | 1.97% | 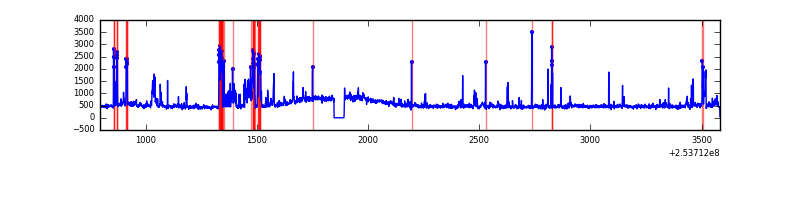 |
Top three noisy pixels from each quadrant. If the there are fewer than three noisy pixels in the level2.evt file, extra rows are filled as -1
| Pixel properties | Quadrant properties | ||||||
|---|---|---|---|---|---|---|---|
| Quadrant | DetID | PixID | Counts | Sigma | Mean | Median | Sigma |
| A | 0 | 23 | 2639869 | 37434.07 | 330 | 322 | 70.5 |
| A | 0 | 226 | 189105 | 2677.32 | 330 | 322 | 70.5 |
| A | 13 | 251 | 148623 | 2103.21 | 330 | 322 | 70.5 |
| B | 3 | 64 | 35621 | 477.78 | 366 | 355 | 73.8 |
| B | 0 | 187 | 26410 | 352.99 | 366 | 355 | 73.8 |
| B | 4 | 239 | 18074 | 240.06 | 366 | 355 | 73.8 |
| C | 15 | 208 | 92320 | 1075.78 | 362 | 362 | 85.5 |
| C | 14 | 234 | 29089 | 336.07 | 362 | 362 | 85.5 |
| C | 13 | 61 | 2612 | 26.32 | 362 | 362 | 85.5 |
| D | 1 | 52 | 139672 | 1598.11 | 355 | 343 | 87.2 |
| D | 7 | 80 | 83775 | 956.97 | 355 | 343 | 87.2 |
| D | 13 | 104 | 48415 | 551.39 | 355 | 343 | 87.2 |
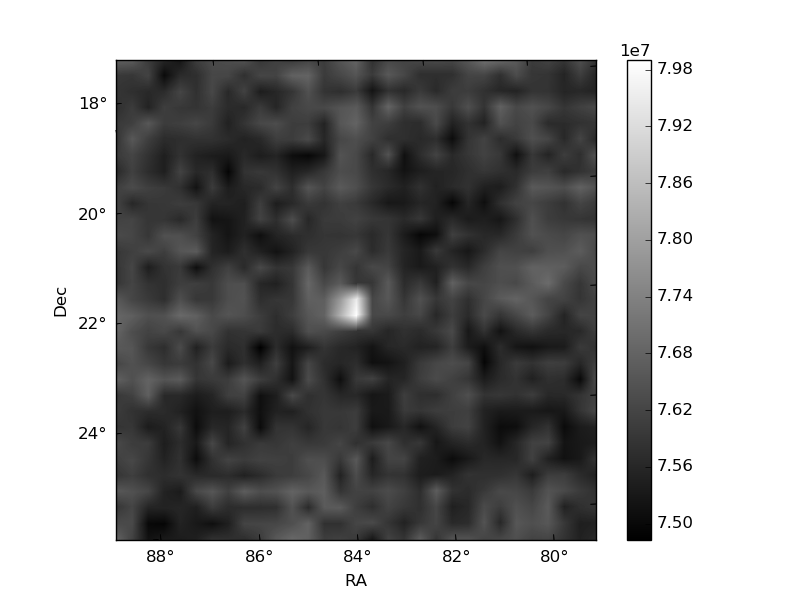
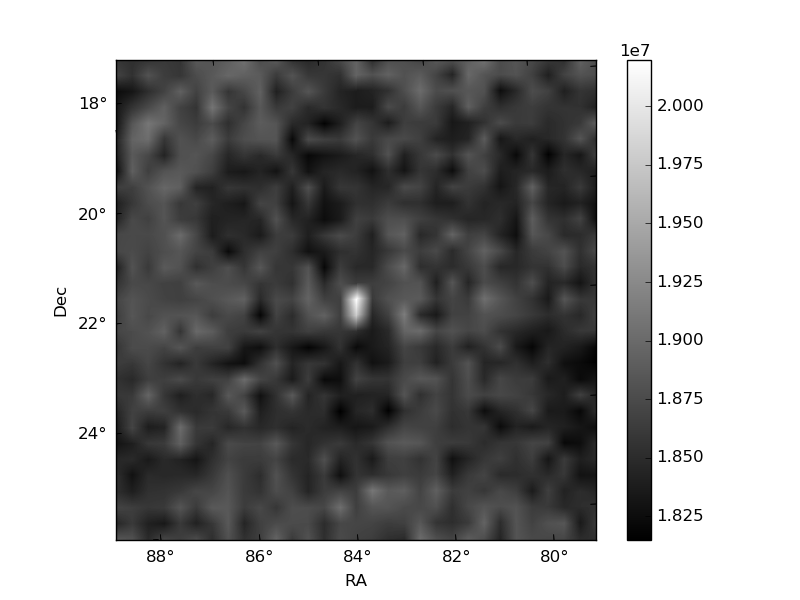
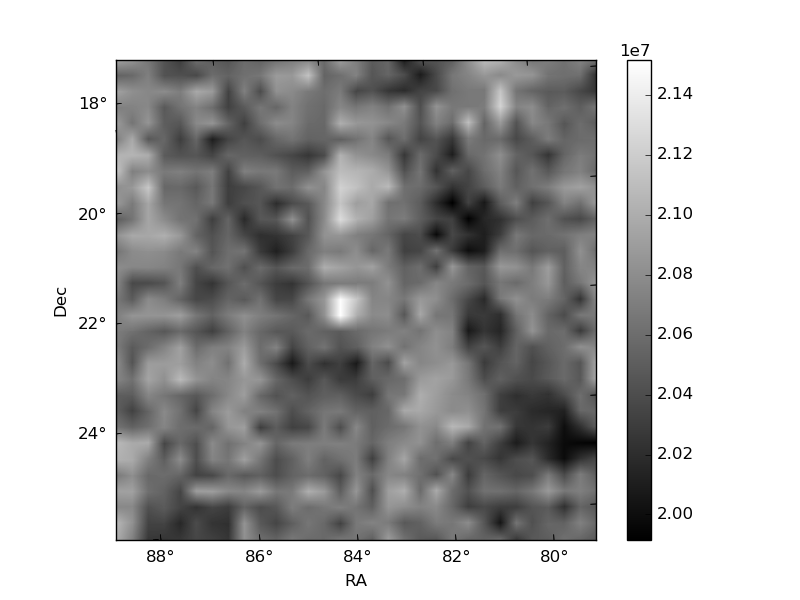
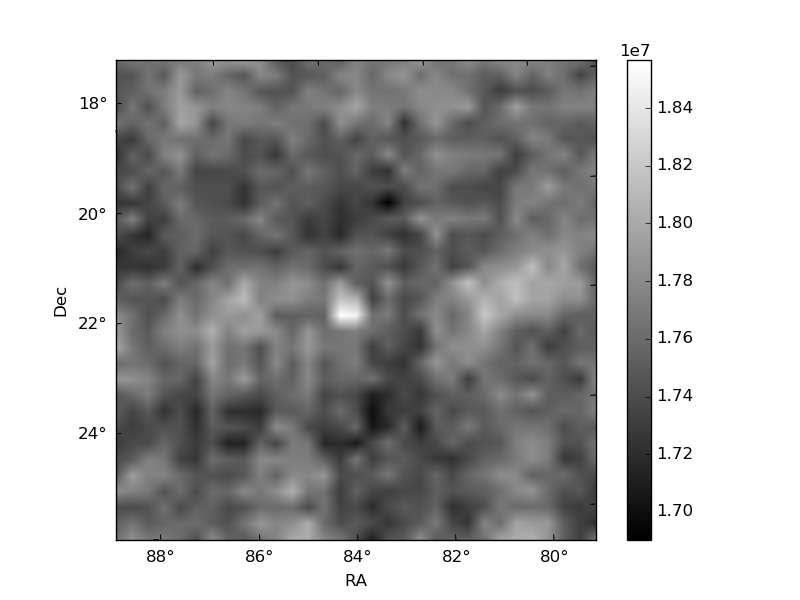
Histogram calculated using DETX and DETY for each event in the final _common_clean file
| Quadrant A | 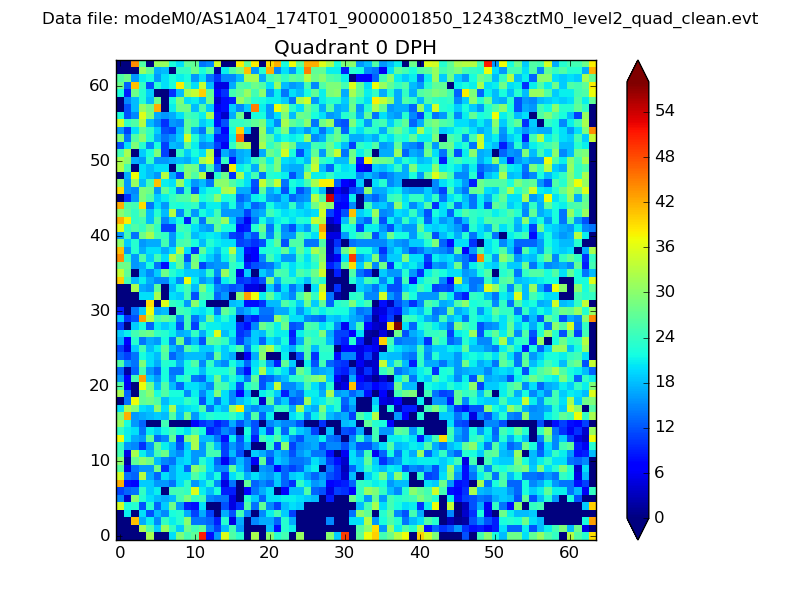 |
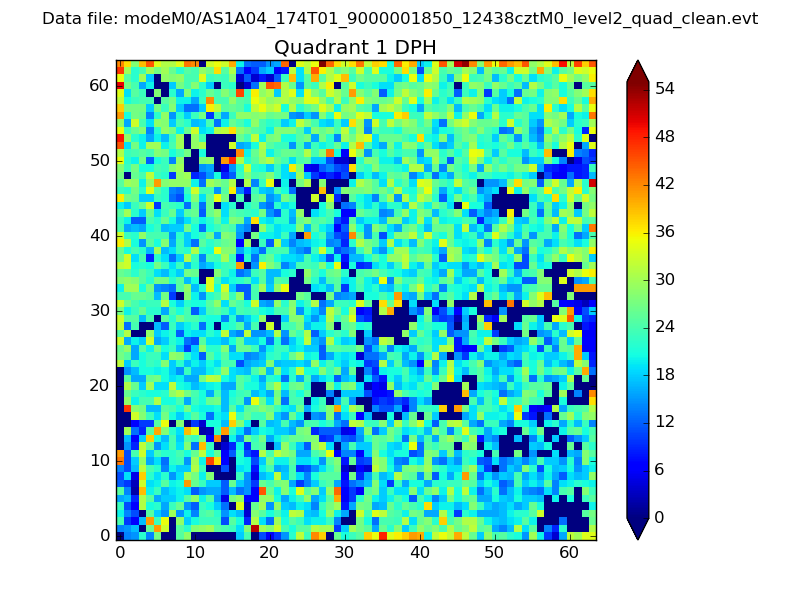 |
Quadrant B |
|---|---|---|---|
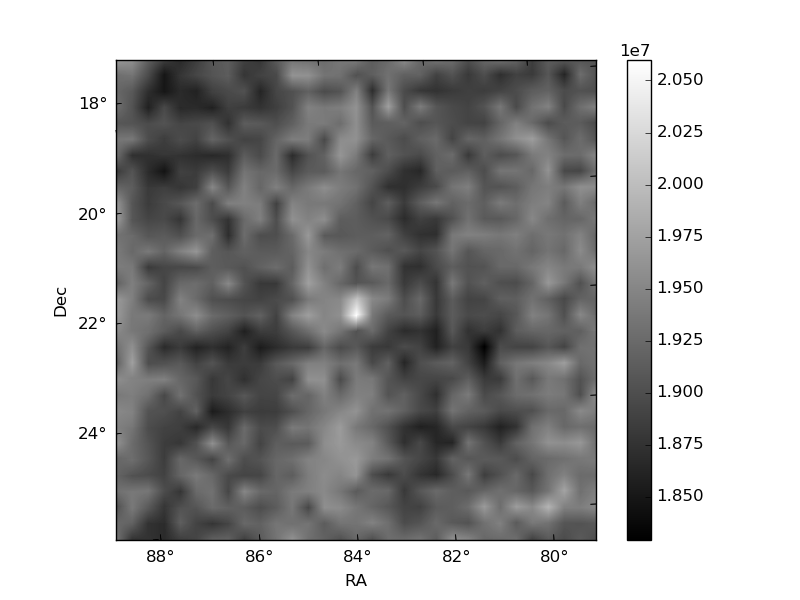
| Quadrant D | 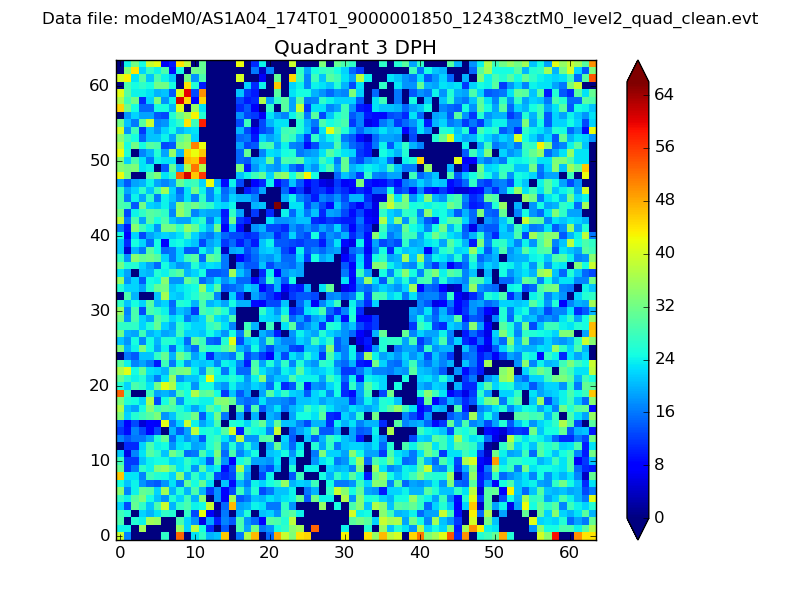 |
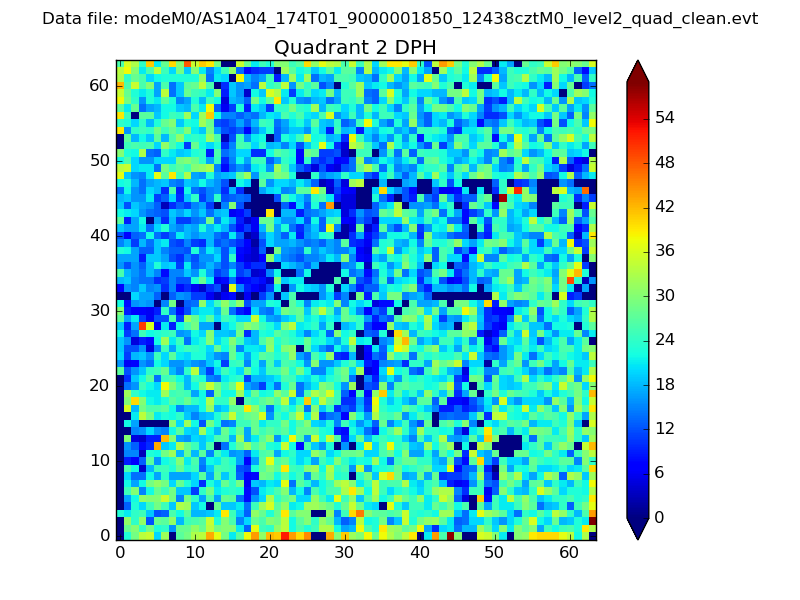 |
Quadrant C |
| Plot type | Count rate plots | Images |
|---|---|---|
| Comparison with Poisson distribution Blue bars denote a histogram of data divided into 1 sec bins. Red curve is a Poisson curve with rate = median count rate of data. |
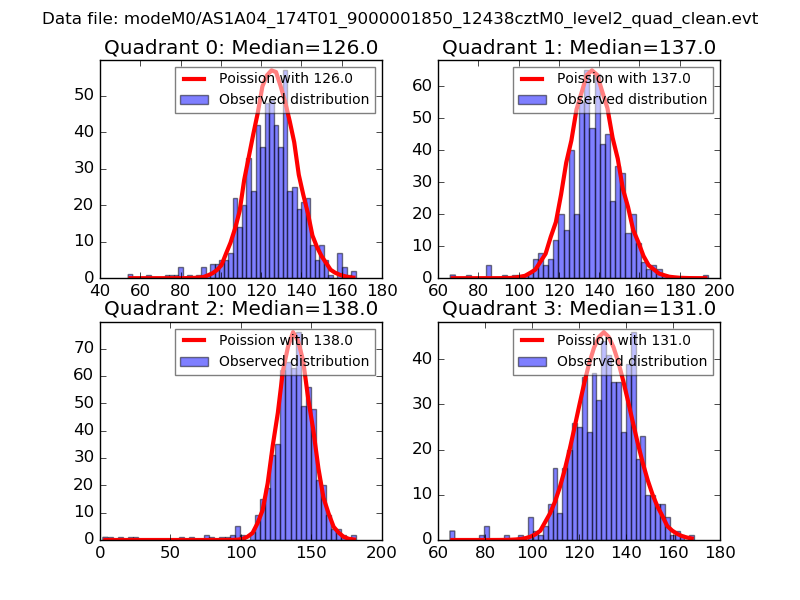 |
 |
| Quadrant-wise count rates Data is divided into 100 sec bins |
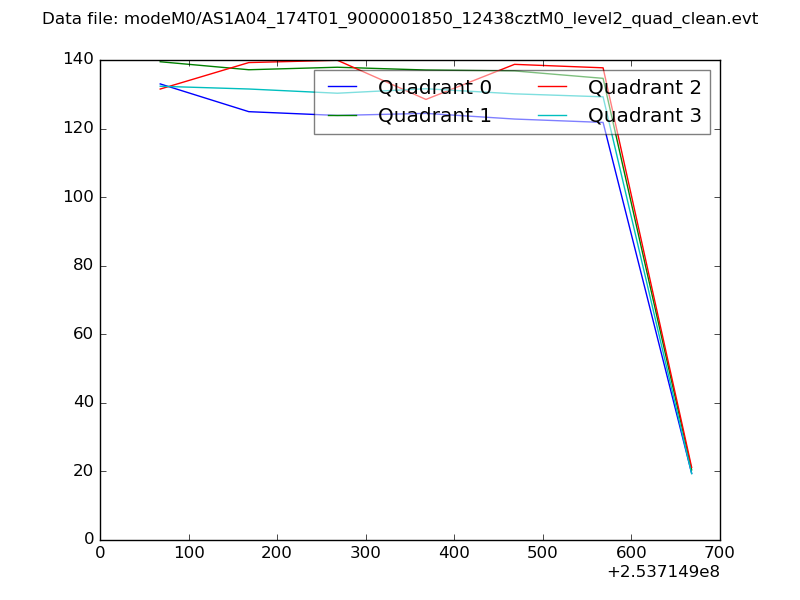 |
|
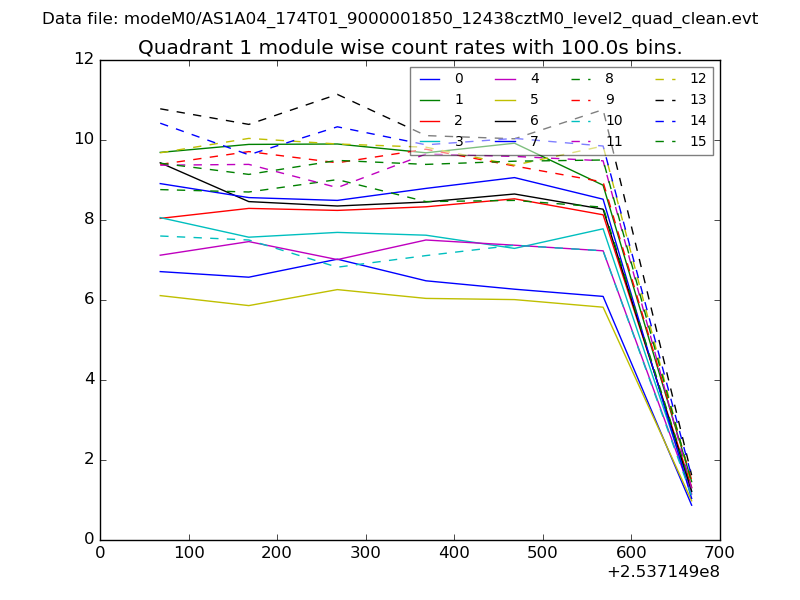
| Module-wise count rates for Quadrant A Data is divided into 100 sec bins |
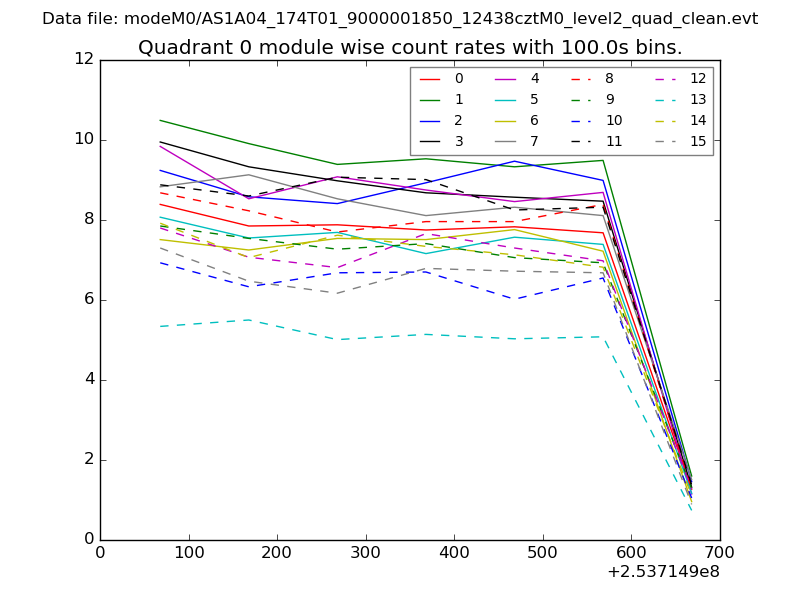 |
 |
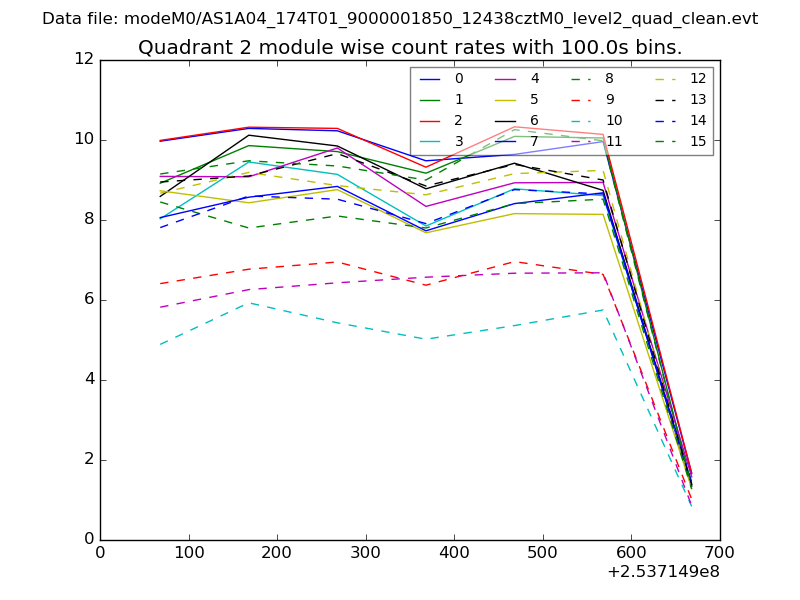
| Module-wise count rates for Quadrant B Data is divided into 100 sec bins |
 |
 |
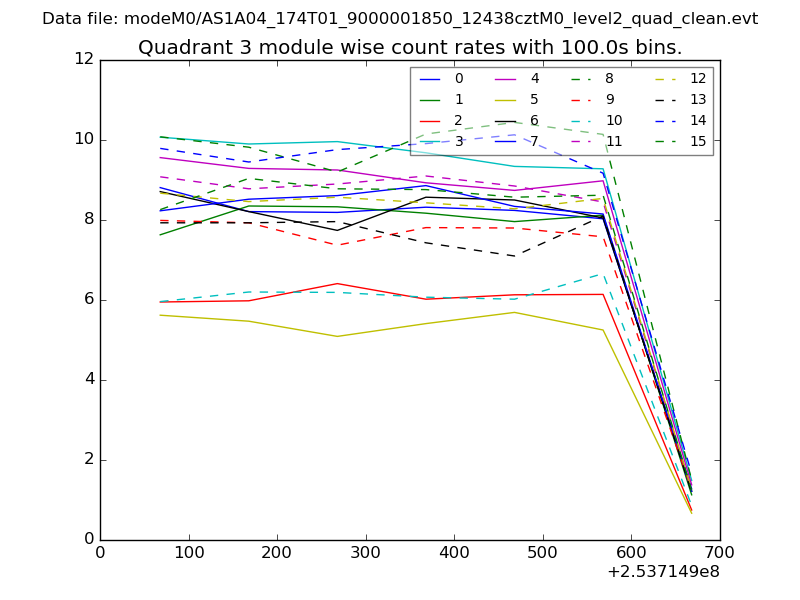
| Module-wise count rates for Quadrant C Data is divided into 100 sec bins |
 |
 |
| Module-wise count rates for Quadrant D Data is divided into 100 sec bins |
 |
 |
| Parameter | Plot |
|---|---|
| CZT HV Monitor | 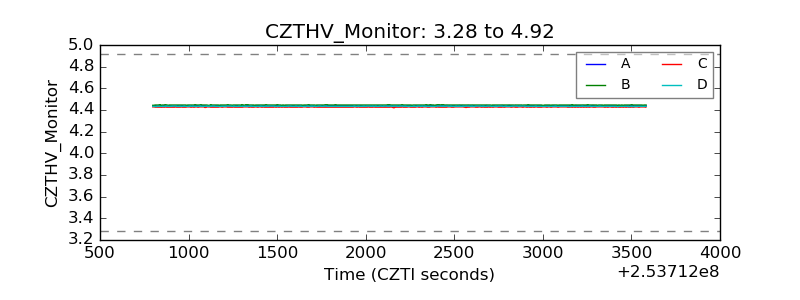 |
| D_VDD | 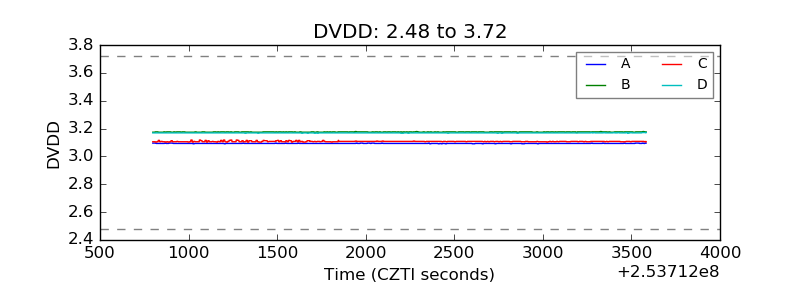 |
| Temperature 1 | 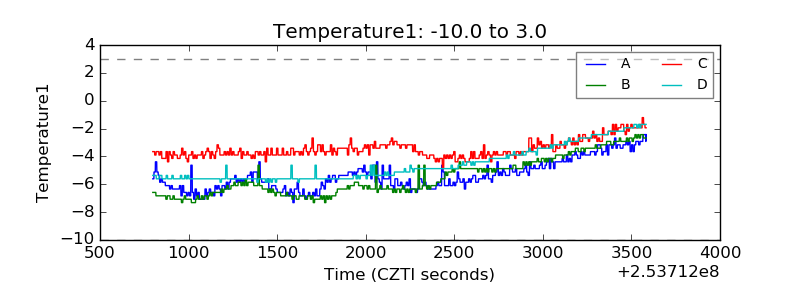 |
| Veto HV Monitor | 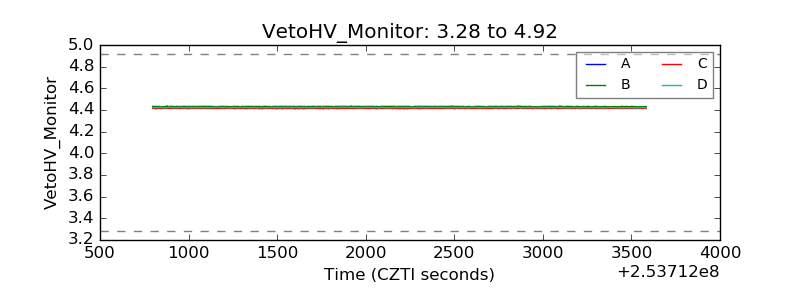 |
| Veto LLD | 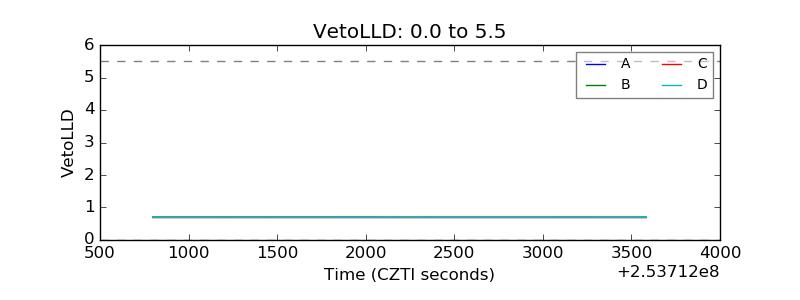 |
| Alpha Counter |  |
| _CPM_Rate | 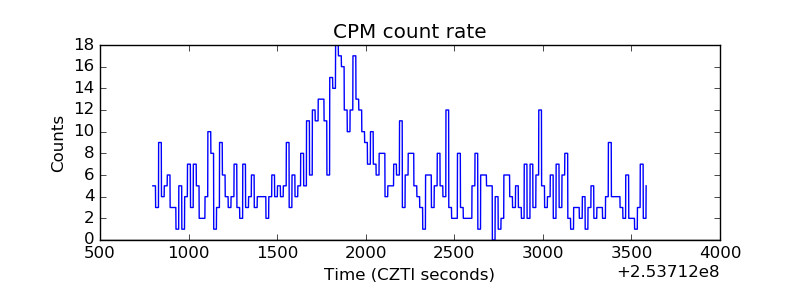 |
| CZT Counter | 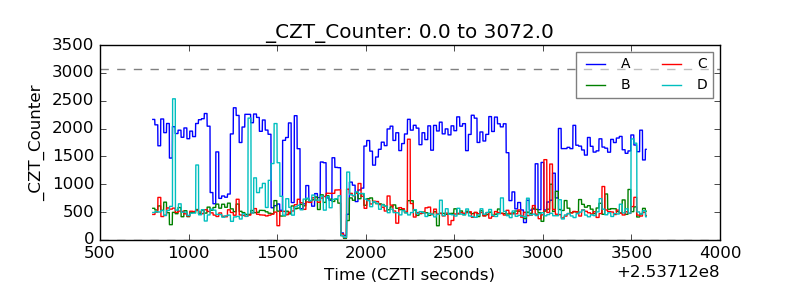 |
| +2.5 Volts monitor |  |
| +5 Volts monitor |  |
| _ROLL_ROT | 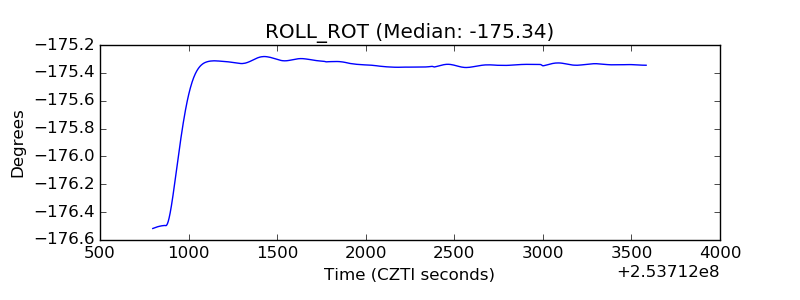 |
| _Roll_DEC | 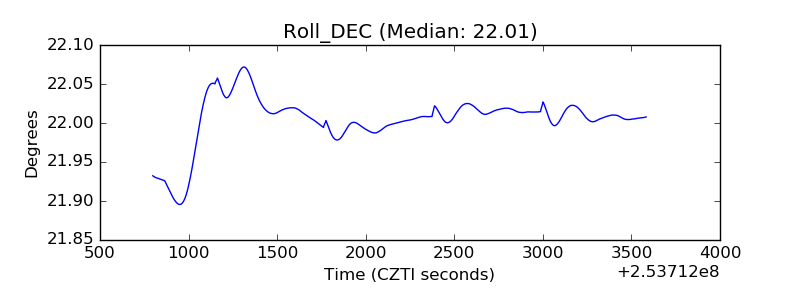 |
| _Roll_RA | 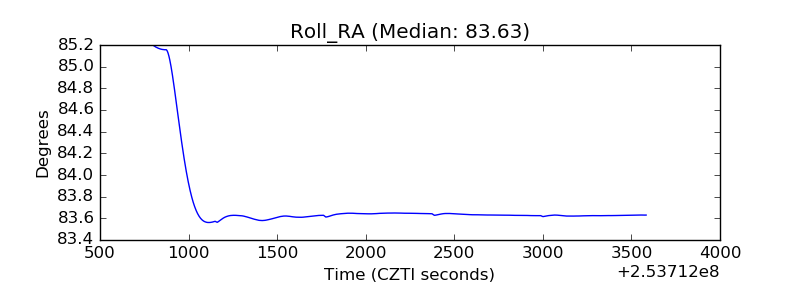 |
| Veto Counter | 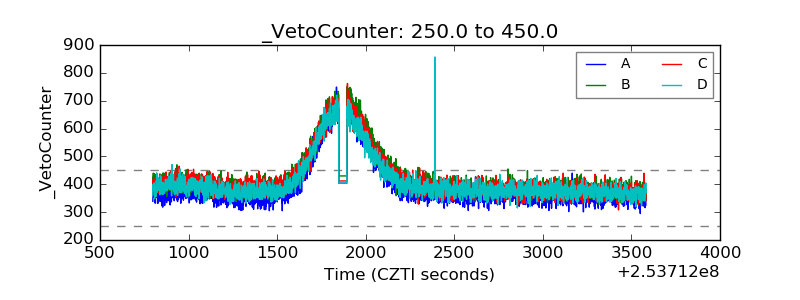 |