| Param | Original file | Final file |
|---|---|---|
| Filename | modeM0/AS1A04_174T01_9000001850_12439cztM0_level2.evt | modeM0/AS1A04_174T01_9000001850_12439cztM0_level2_quad_clean.evt |
| Size (bytes) | 872,447,040 | 97,341,120 |
| Size | 832.0 MB | 92.8 MB |
| Events in quadrant A | 11,039,580 | 603,661 |
| Events in quadrant B | 5,899,786 | 565,166 |
| Events in quadrant C | 3,652,288 | 650,712 |
| Events in quadrant D | 5,327,072 | 607,625 |
| Mode M0 | |||
|---|---|---|---|
| Quadrant | BADHDUFLAG | Total packets | Discarded packets |
| A | 0 | 38031 | 2 |
| B | 0 | 22382 | 1 |
| C | 0 | 15677 | 1 |
| D | 0 | 20706 | 1 |
| Mode M9 | |||
|---|---|---|---|
| Quadrant | BADHDUFLAG | Total packets | Discarded packets |
| A | 0 | 4 | 0 |
| B | 0 | 4 | 0 |
| C | 0 | 4 | 0 |
| D | 0 | 4 | 0 |
| Mode SS | |||
|---|---|---|---|
| Quadrant | BADHDUFLAG | Total packets | Discarded packets |
| A | 0 | 152 | 0 |
| B | 0 | 152 | 0 |
| C | 0 | 152 | 0 |
| D | 0 | 152 | 0 |
| Quadrant | Total seconds | Saturated seconds | Saturation percentage |
|---|---|---|---|
| A | 7474 | 1502 | 20.096334% |
| B | 7474 | 917 | 12.269200% |
| C | 7474 | 66 | 0.883061% |
| D | 7474 | 235 | 3.144233% |
Noise dominated data is calculated using 1-second bins in cleaned event files. If a bin has >2000 counts, and if more than 50% of those come from <1% of pixels, then it is considered to be noise-dominated and hence unusable.
| Quadrant | # 1 sec bins | Bins with >0 counts | Bins with >2000 counts | High rate bins dominated by noise | Noise dominated (total time) | Noise dominated (detector-on time) | Marked lightcurve |
|---|---|---|---|---|---|---|---|
| A | 7855 | 7475 | 560 | 560 | 7.13% | 7.49% | 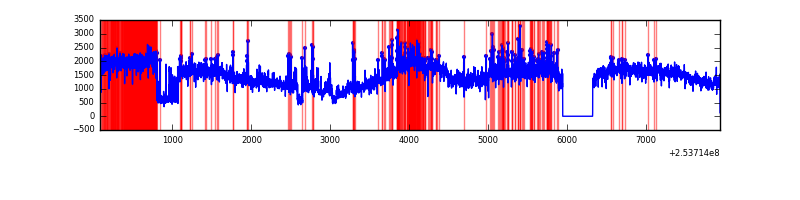 |
| B | 7854 | 7474 | 570 | 570 | 7.26% | 7.63% | 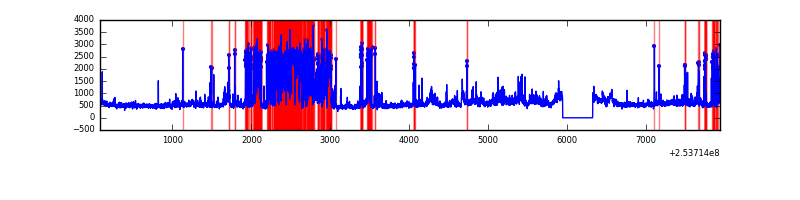 |
| C | 7855 | 7476 | 25 | 25 | 0.32% | 0.33% | 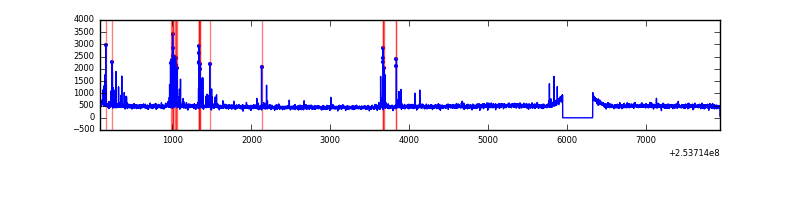 |
| D | 7855 | 7475 | 143 | 143 | 1.82% | 1.91% |  |
Top three noisy pixels from each quadrant. If the there are fewer than three noisy pixels in the level2.evt file, extra rows are filled as -1
| Pixel properties | Quadrant properties | ||||||
|---|---|---|---|---|---|---|---|
| Quadrant | DetID | PixID | Counts | Sigma | Mean | Median | Sigma |
| A | 0 | 23 | 6089260 | 33767.22 | 876 | 860 | 180.3 |
| A | 13 | 251 | 701776 | 3887.39 | 876 | 860 | 180.3 |
| A | 0 | 226 | 432684 | 2394.96 | 876 | 860 | 180.3 |
| B | 4 | 239 | 1927596 | 11830.13 | 848 | 827 | 162.9 |
| B | 3 | 64 | 404150 | 2476.35 | 848 | 827 | 162.9 |
| B | 0 | 219 | 84142 | 511.54 | 848 | 827 | 162.9 |
| C | 15 | 208 | 134656 | 645.41 | 890 | 901 | 207.2 |
| C | 14 | 234 | 38163 | 179.8 | 890 | 901 | 207.2 |
| C | 8 | 128 | 6611 | 27.55 | 890 | 901 | 207.2 |
| D | 1 | 52 | 1551598 | 7236.43 | 883 | 859 | 214.3 |
| D | 7 | 80 | 152543 | 707.82 | 883 | 859 | 214.3 |
| D | 7 | 71 | 130184 | 603.49 | 883 | 859 | 214.3 |
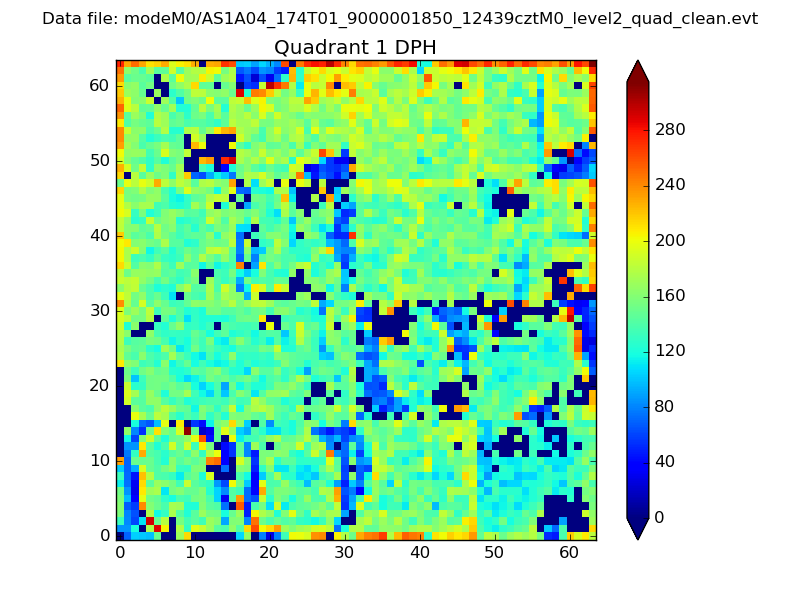
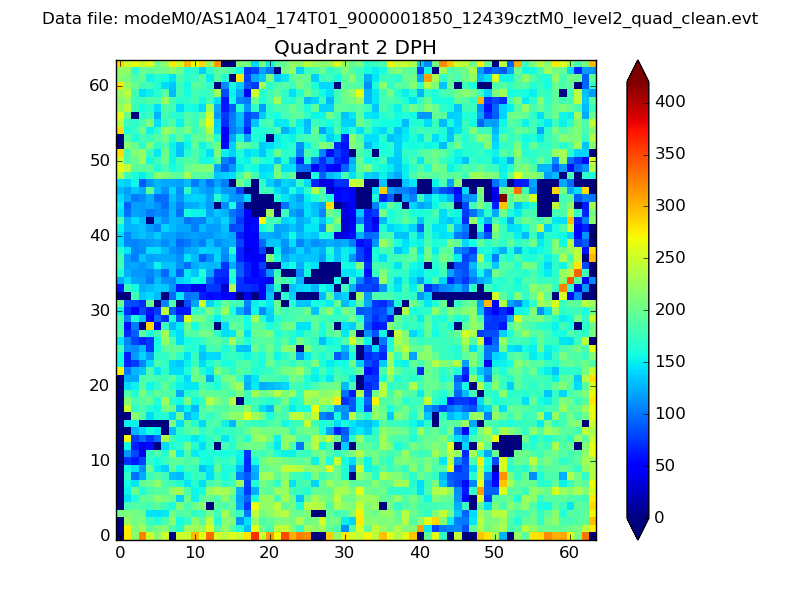
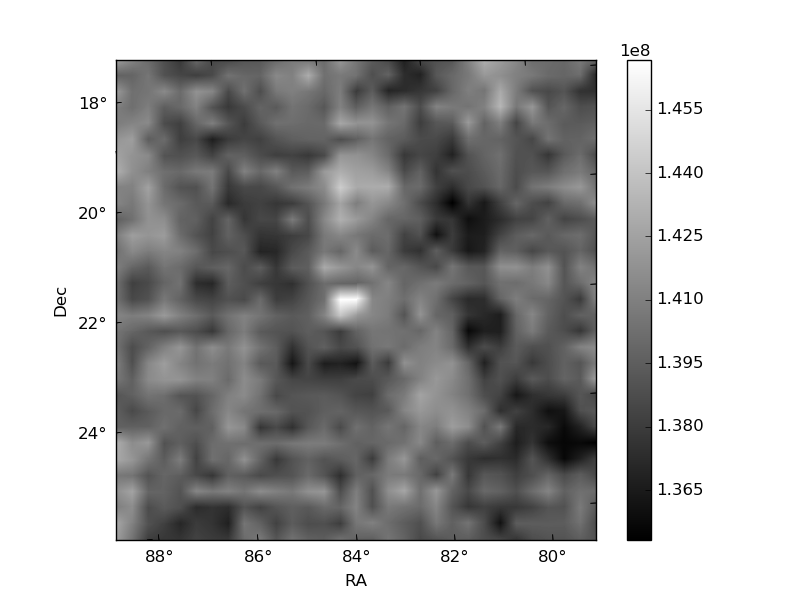
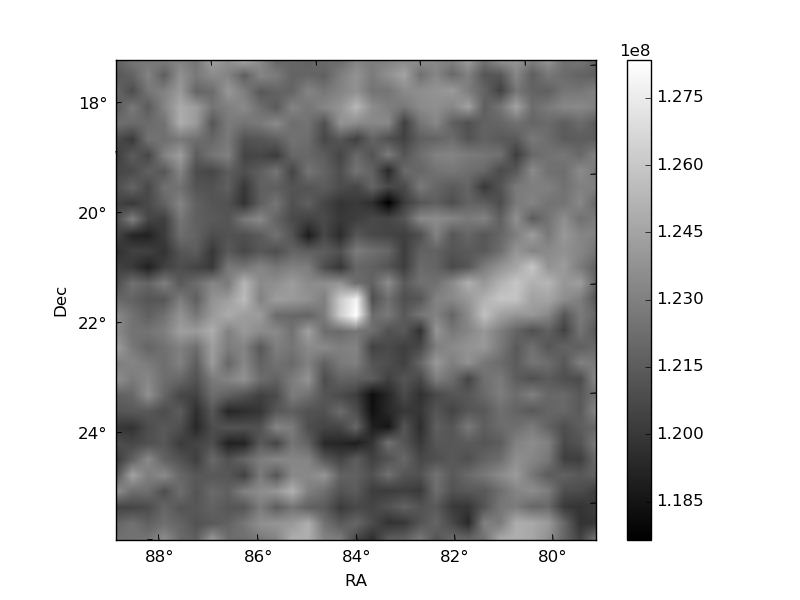
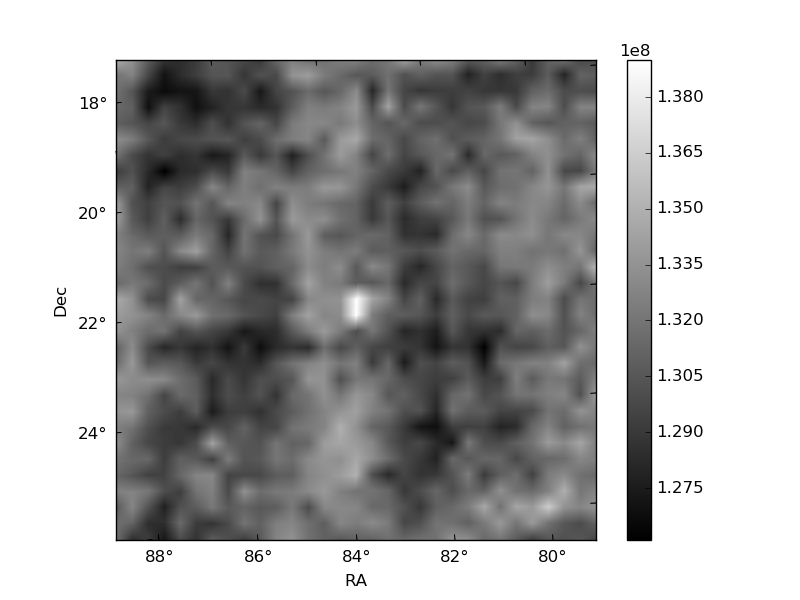
Histogram calculated using DETX and DETY for each event in the final _common_clean file
| Quadrant A |  |
 |
Quadrant B |
|---|---|---|---|
| Quadrant D | 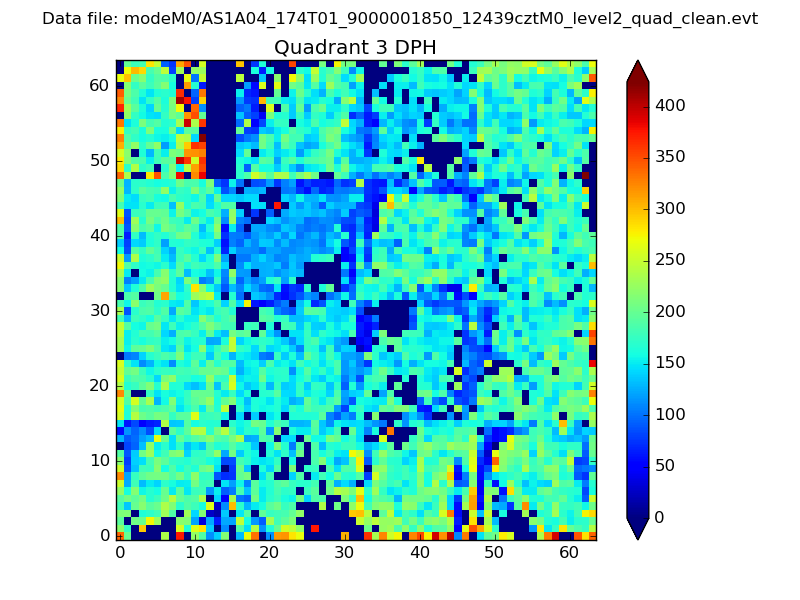 |
 |
Quadrant C |
| Plot type | Count rate plots | Images |
|---|---|---|
| Comparison with Poisson distribution Blue bars denote a histogram of data divided into 1 sec bins. Red curve is a Poisson curve with rate = median count rate of data. |
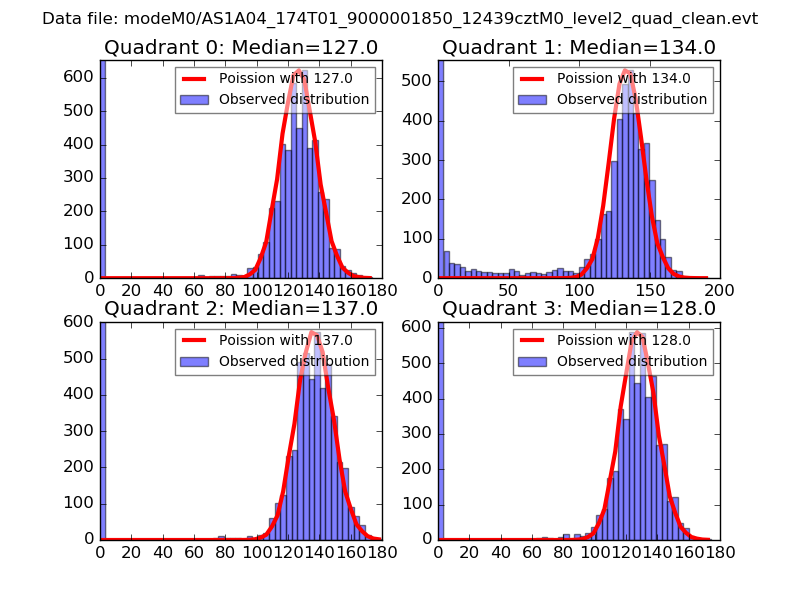 |
 |
| Quadrant-wise count rates Data is divided into 100 sec bins |
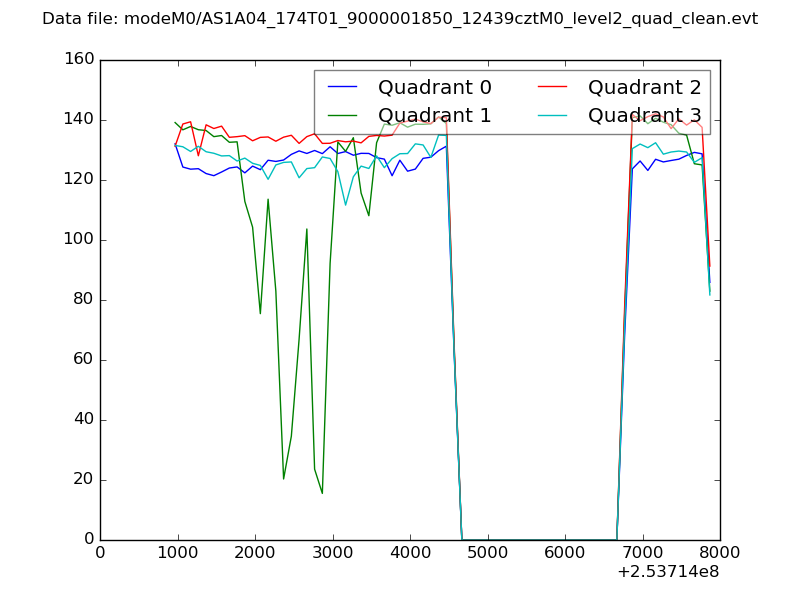 |
|
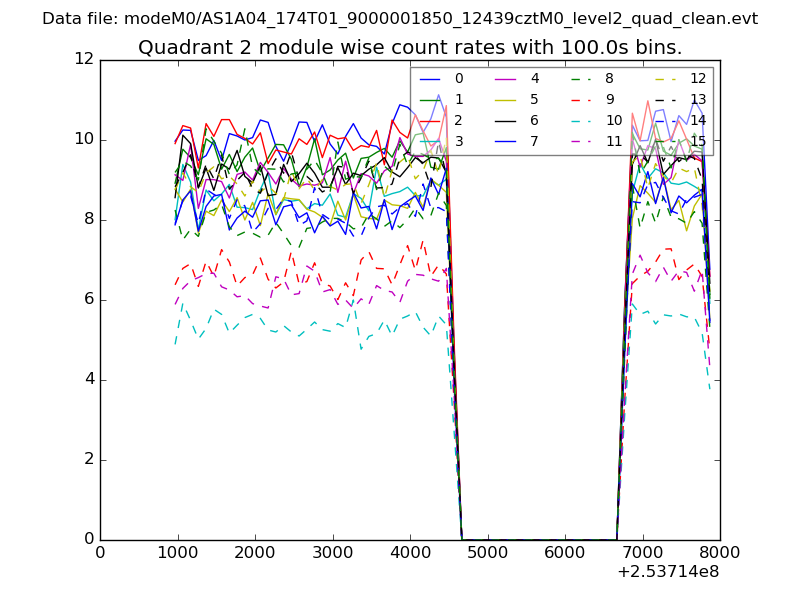
| Module-wise count rates for Quadrant A Data is divided into 100 sec bins |
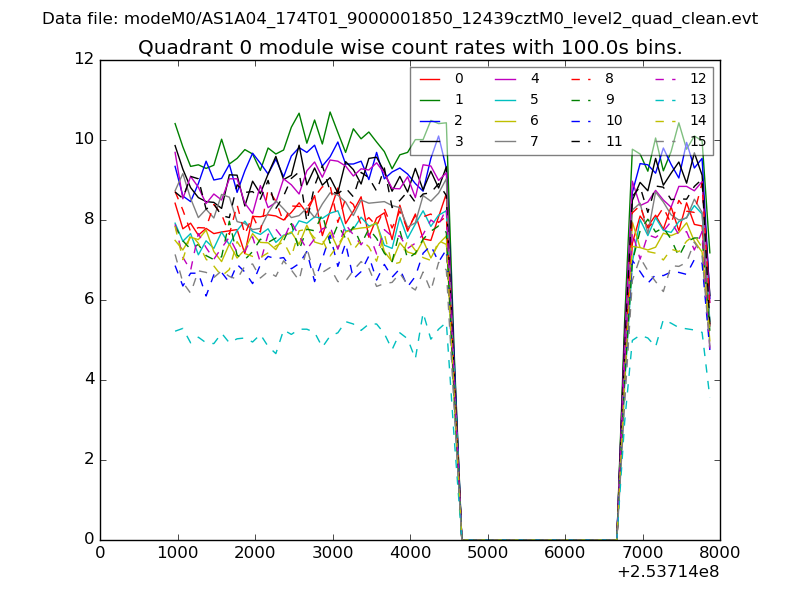 |
 |
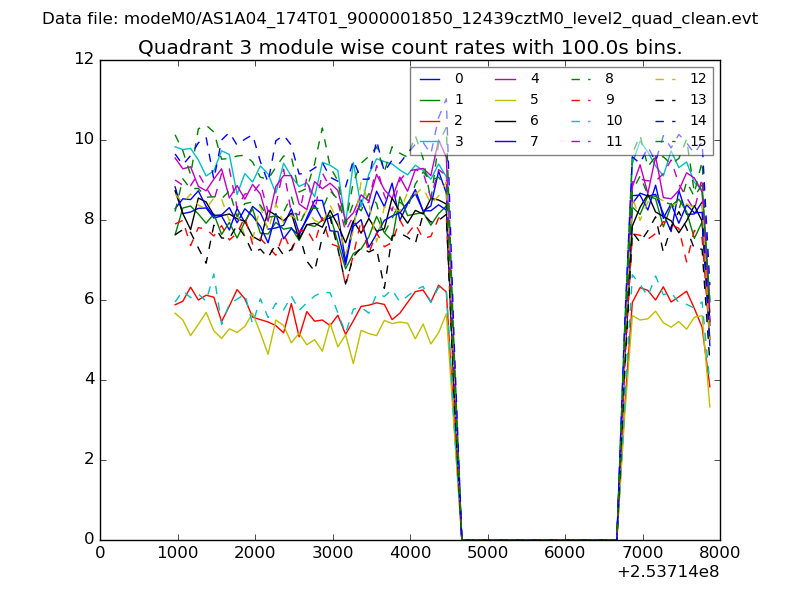
| Module-wise count rates for Quadrant B Data is divided into 100 sec bins |
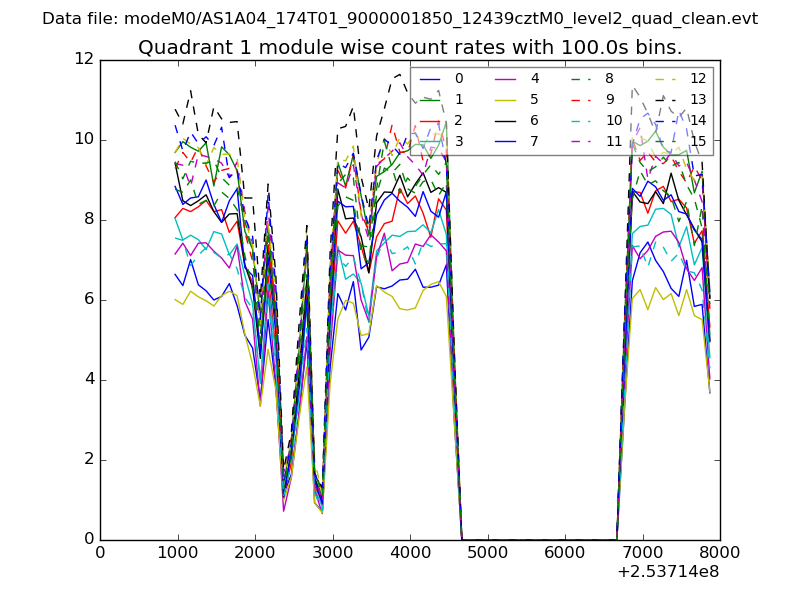 |
 |
| Module-wise count rates for Quadrant C Data is divided into 100 sec bins |
 |
 |
| Module-wise count rates for Quadrant D Data is divided into 100 sec bins |
 |
 |
| Parameter | Plot |
|---|---|
| CZT HV Monitor | 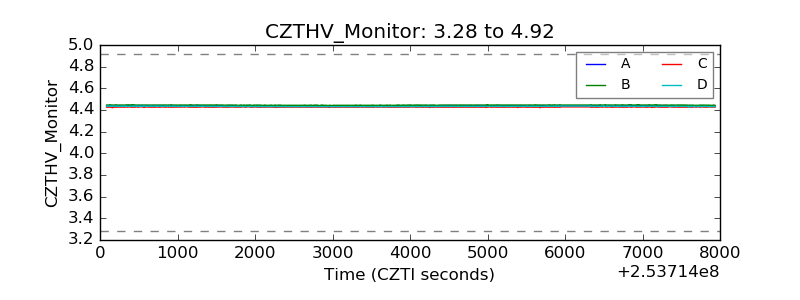 |
| D_VDD | 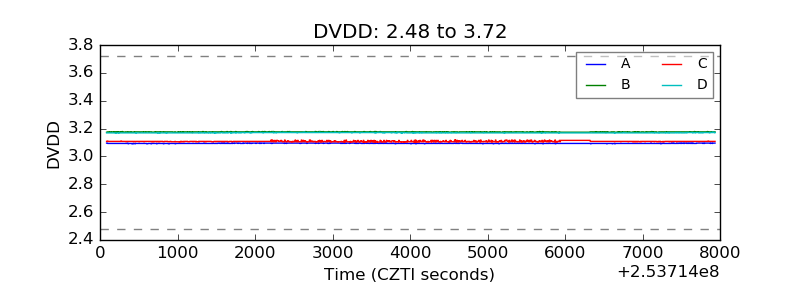 |
| Temperature 1 | 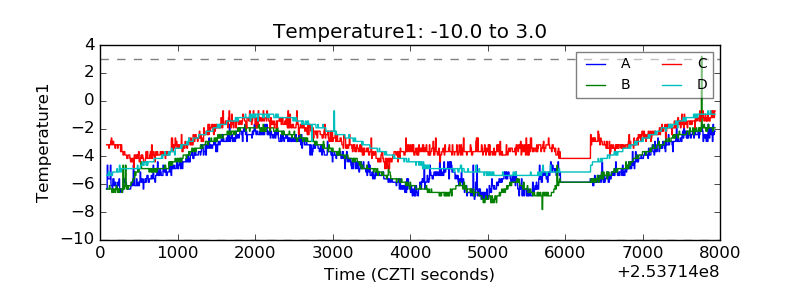 |
| Veto HV Monitor | 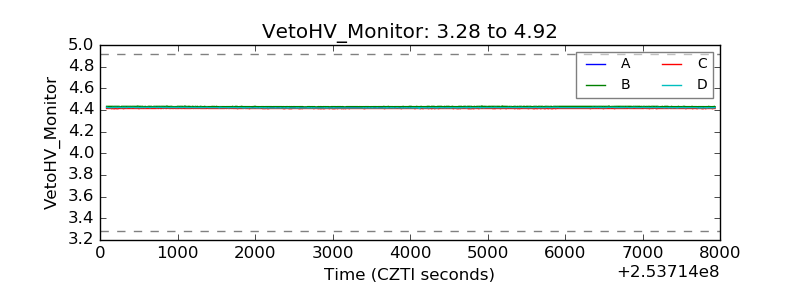 |
| Veto LLD | 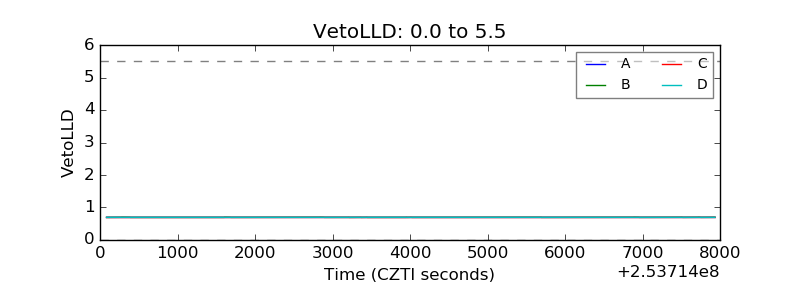 |
| Alpha Counter | 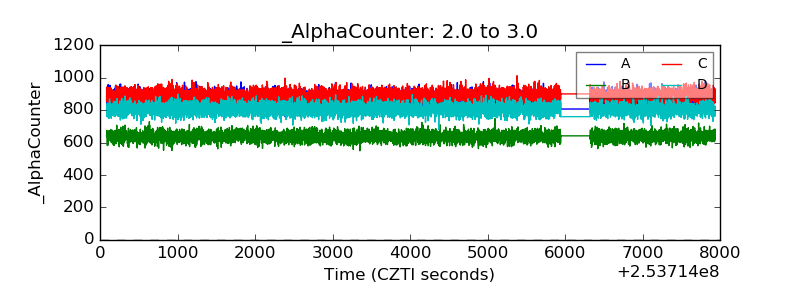 |
| _CPM_Rate | 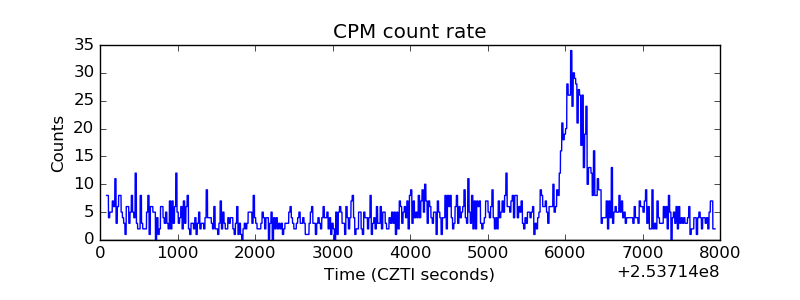 |
| CZT Counter | 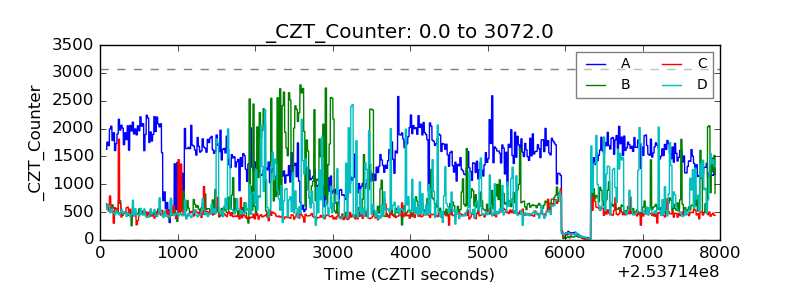 |
| +2.5 Volts monitor |  |
| +5 Volts monitor |  |
| _ROLL_ROT | 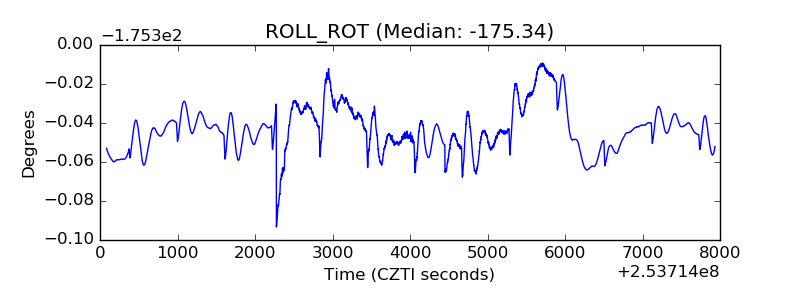 |
| _Roll_DEC | 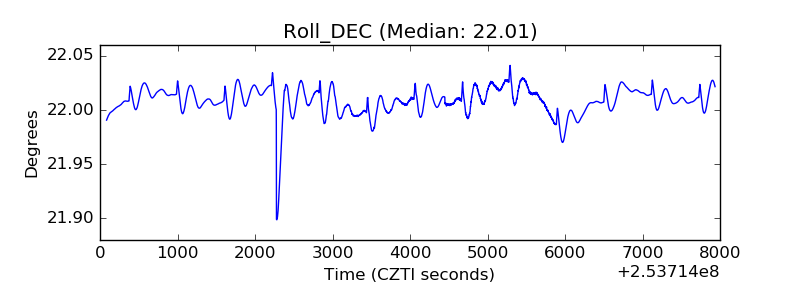 |
| _Roll_RA | 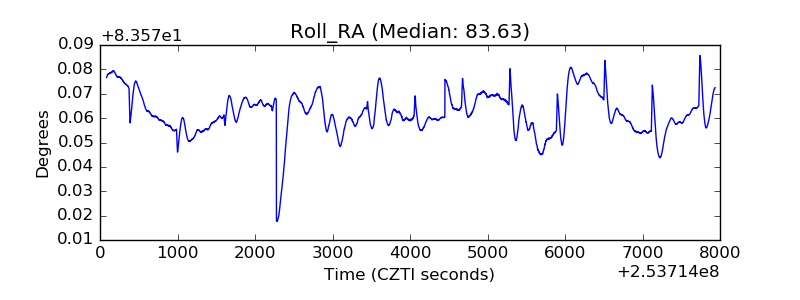 |
| Veto Counter | 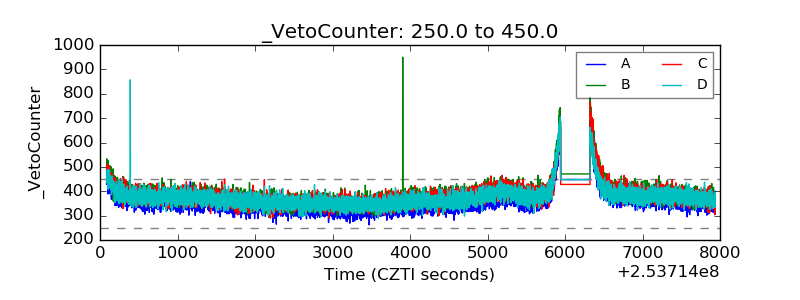 |