| Param | Original file | Final file |
|---|---|---|
| Filename | modeM0/AS1A04_174T01_9000001850_12441cztM0_level2.evt | modeM0/AS1A04_174T01_9000001850_12441cztM0_level2_quad_clean.evt |
| Size (bytes) | 1,331,686,080 | 179,899,200 |
| Size | 1.2 GB | 171.6 MB |
| Events in quadrant A | 17,882,823 | 1,106,380 |
| Events in quadrant B | 8,147,504 | 1,162,344 |
| Events in quadrant C | 5,874,308 | 1,200,209 |
| Events in quadrant D | 7,596,941 | 1,126,580 |
| Mode M0 | |||
|---|---|---|---|
| Quadrant | BADHDUFLAG | Total packets | Discarded packets |
| A | 0 | 61776 | 3 |
| B | 0 | 32231 | 2 |
| C | 0 | 25560 | 2 |
| D | 0 | 30783 | 2 |
| Mode M9 | |||
|---|---|---|---|
| Quadrant | BADHDUFLAG | Total packets | Discarded packets |
| A | 0 | 12 | 0 |
| B | 0 | 12 | 0 |
| C | 0 | 12 | 0 |
| D | 0 | 12 | 0 |
| Mode SS | |||
|---|---|---|---|
| Quadrant | BADHDUFLAG | Total packets | Discarded packets |
| A | 0 | 252 | 0 |
| B | 0 | 252 | 0 |
| C | 0 | 252 | 0 |
| D | 0 | 252 | 0 |
| Quadrant | Total seconds | Saturated seconds | Saturation percentage |
|---|---|---|---|
| A | 12328 | 2083 | 16.896496% |
| B | 12328 | 657 | 5.329332% |
| C | 12328 | 91 | 0.738157% |
| D | 12328 | 238 | 1.930565% |
Noise dominated data is calculated using 1-second bins in cleaned event files. If a bin has >2000 counts, and if more than 50% of those come from <1% of pixels, then it is considered to be noise-dominated and hence unusable.
| Quadrant | # 1 sec bins | Bins with >0 counts | Bins with >2000 counts | High rate bins dominated by noise | Noise dominated (total time) | Noise dominated (detector-on time) | Marked lightcurve |
|---|---|---|---|---|---|---|---|
| A | 13609 | 12329 | 863 | 863 | 6.34% | 7.00% | 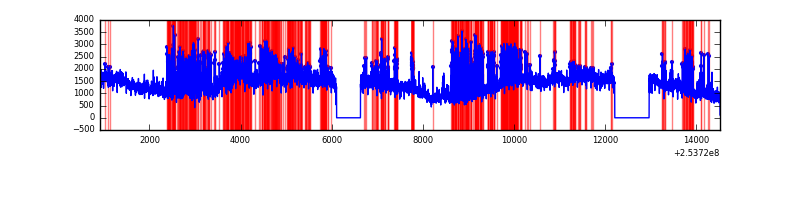 |
| B | 13609 | 12329 | 361 | 361 | 2.65% | 2.93% | 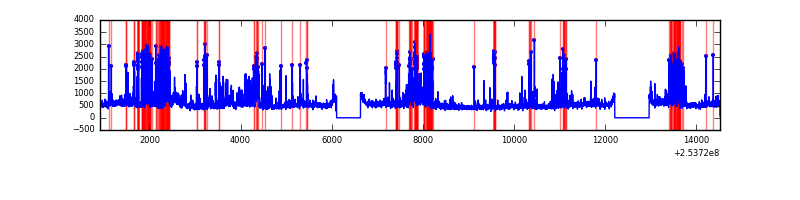 |
| C | 13609 | 12330 | 13 | 13 | 0.10% | 0.11% | 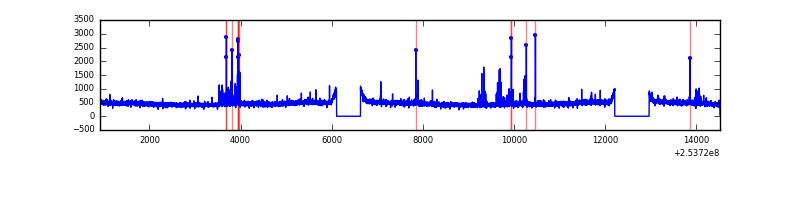 |
| D | 13609 | 12329 | 144 | 144 | 1.06% | 1.17% | 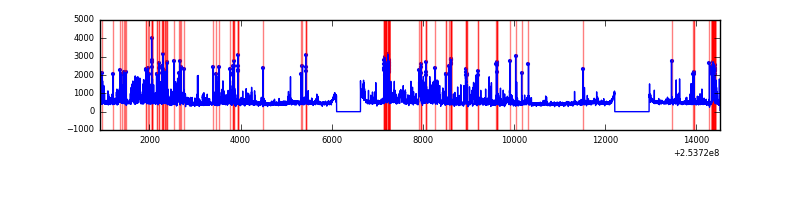 |
Top three noisy pixels from each quadrant. If the there are fewer than three noisy pixels in the level2.evt file, extra rows are filled as -1
| Pixel properties | Quadrant properties | ||||||
|---|---|---|---|---|---|---|---|
| Quadrant | DetID | PixID | Counts | Sigma | Mean | Median | Sigma |
| A | 0 | 23 | 8160519 | 27755.79 | 1436 | 1407 | 294.0 |
| A | 13 | 251 | 2304258 | 7833.87 | 1436 | 1407 | 294.0 |
| A | 0 | 226 | 578819 | 1964.25 | 1436 | 1407 | 294.0 |
| B | 4 | 239 | 1270715 | 4538.24 | 1464 | 1429 | 279.7 |
| B | 3 | 64 | 700587 | 2499.79 | 1464 | 1429 | 279.7 |
| B | 3 | 209 | 153234 | 542.77 | 1464 | 1429 | 279.7 |
| C | 15 | 208 | 166369 | 489.11 | 1459 | 1473 | 337.1 |
| C | 14 | 234 | 18259 | 49.79 | 1459 | 1473 | 337.1 |
| C | 13 | 61 | 10686 | 27.33 | 1459 | 1473 | 337.1 |
| D | 1 | 52 | 1521350 | 4346.78 | 1449 | 1414 | 349.7 |
| D | 13 | 104 | 199788 | 567.32 | 1449 | 1414 | 349.7 |
| D | 7 | 80 | 139262 | 394.22 | 1449 | 1414 | 349.7 |
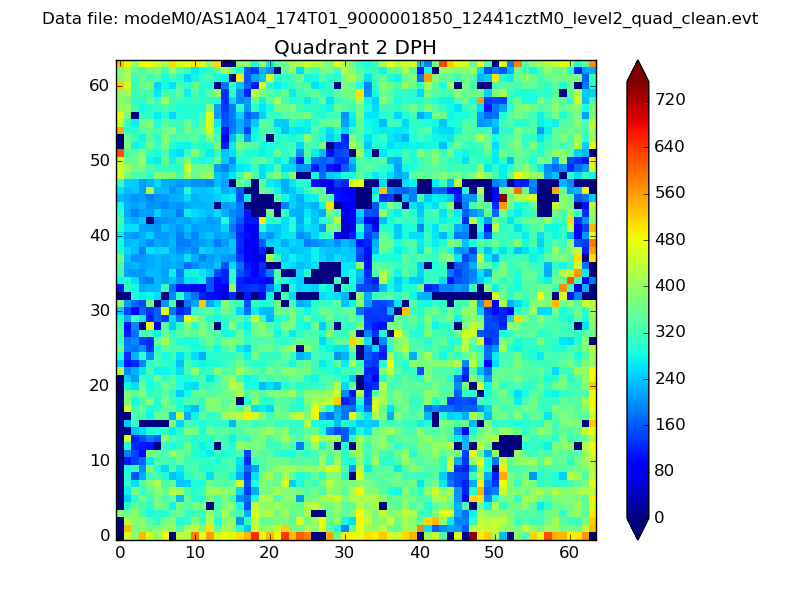
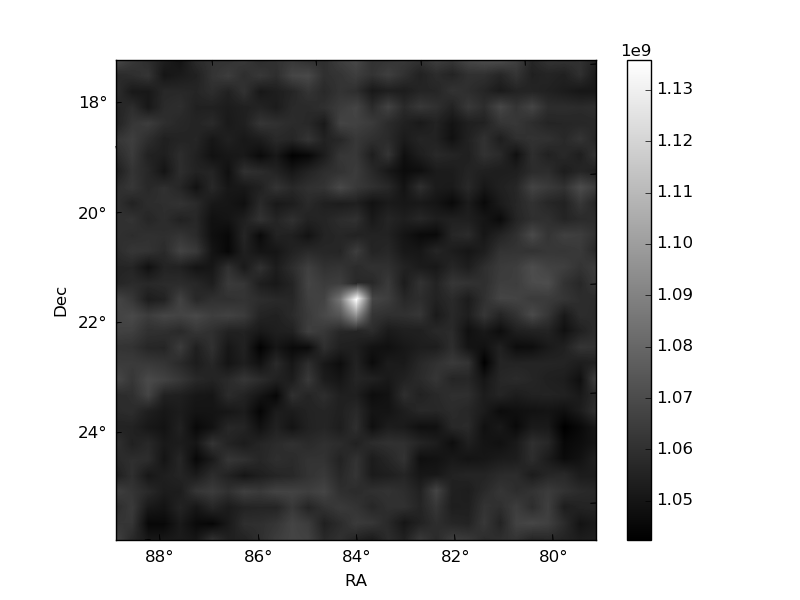
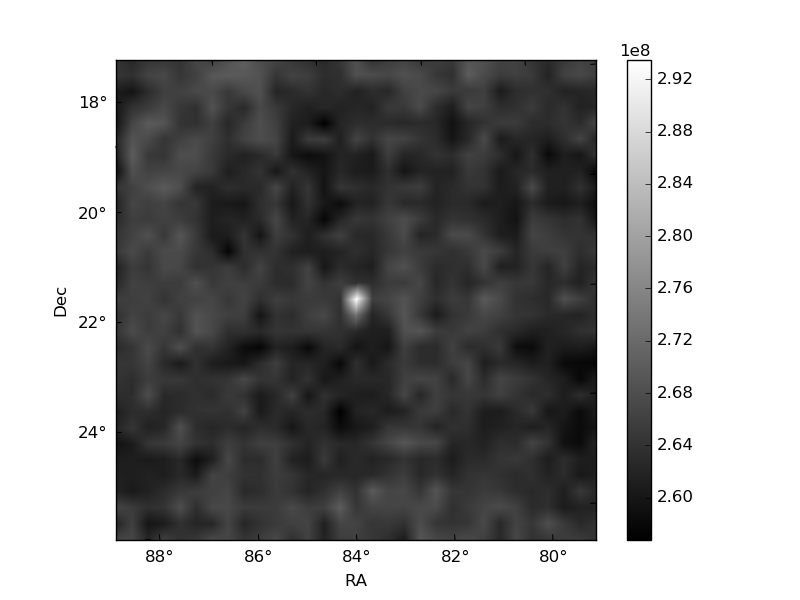
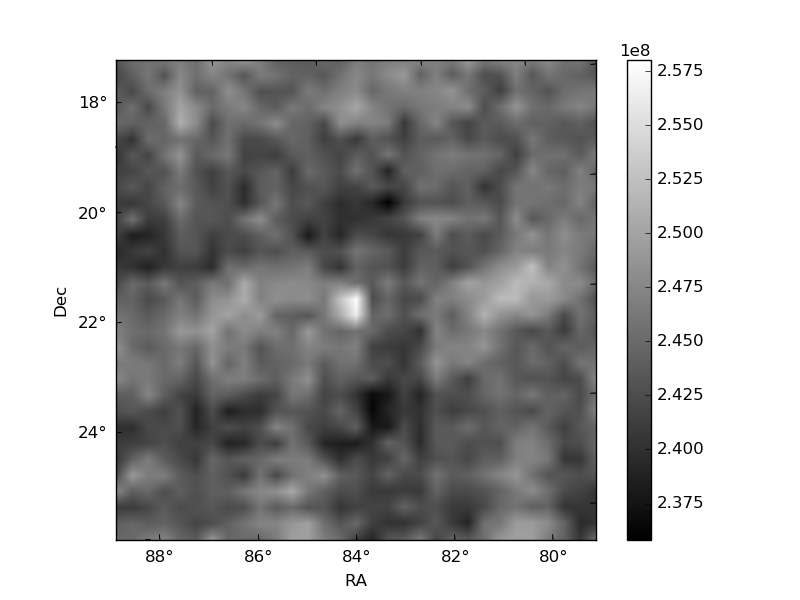
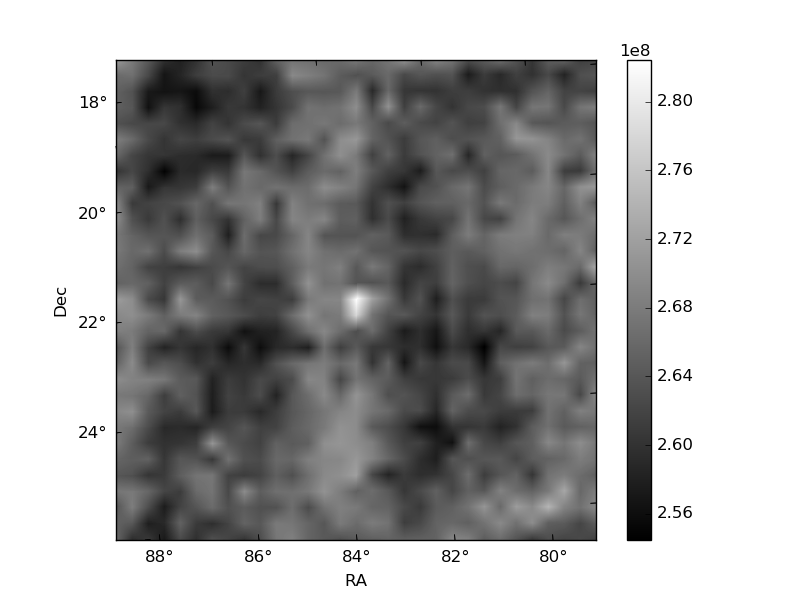
Histogram calculated using DETX and DETY for each event in the final _common_clean file
| Quadrant A | 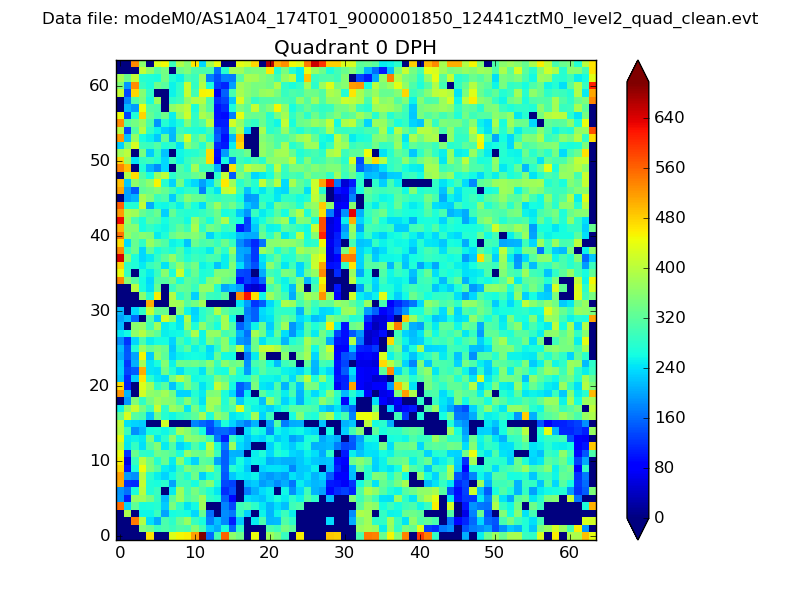 |
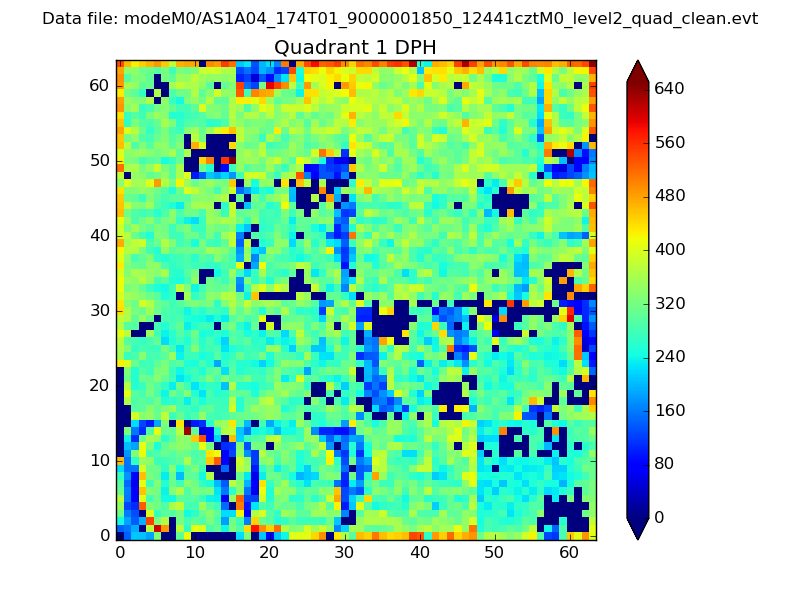 |
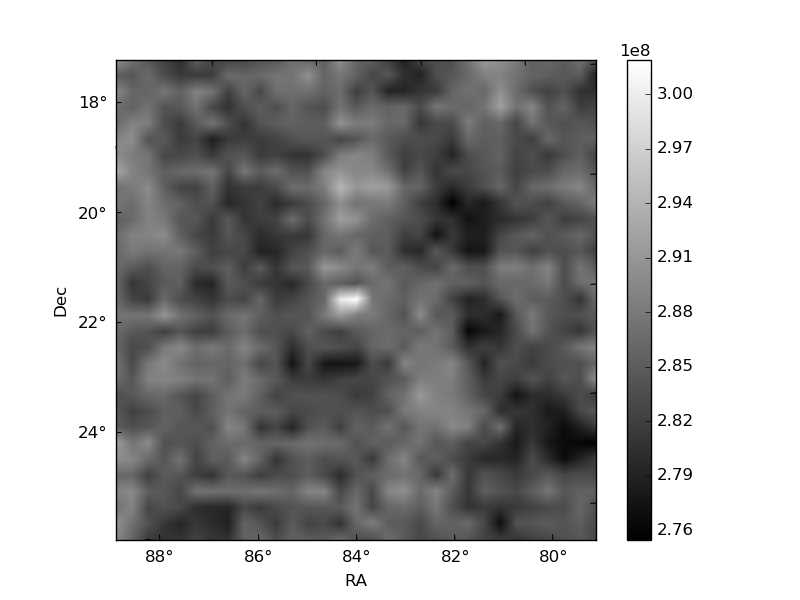
Quadrant B |
|---|---|---|---|
| Quadrant D | 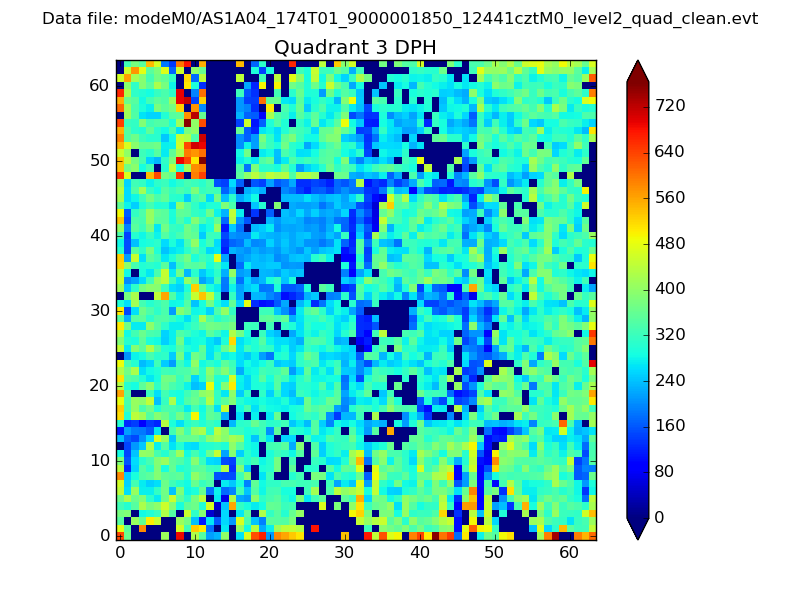 |
 |
Quadrant C |
| Plot type | Count rate plots | Images |
|---|---|---|
| Comparison with Poisson distribution Blue bars denote a histogram of data divided into 1 sec bins. Red curve is a Poisson curve with rate = median count rate of data. |
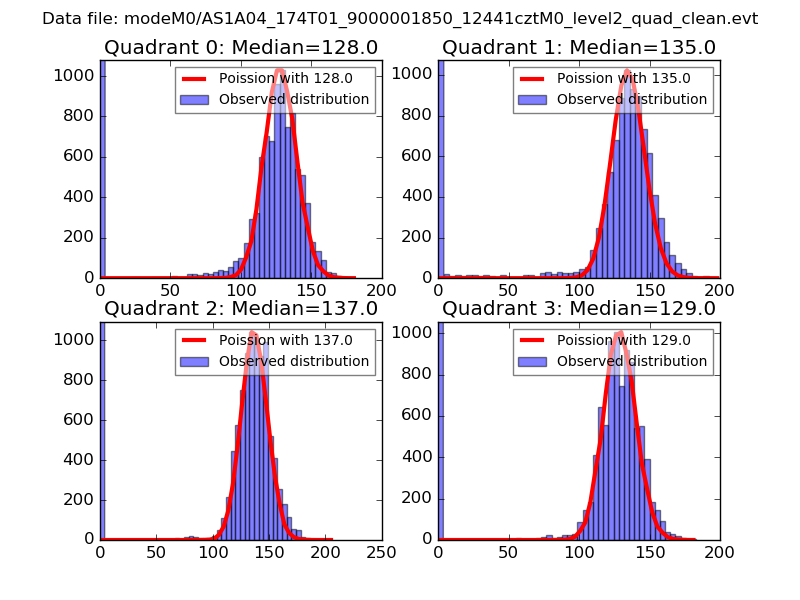 |
 |
| Quadrant-wise count rates Data is divided into 100 sec bins |
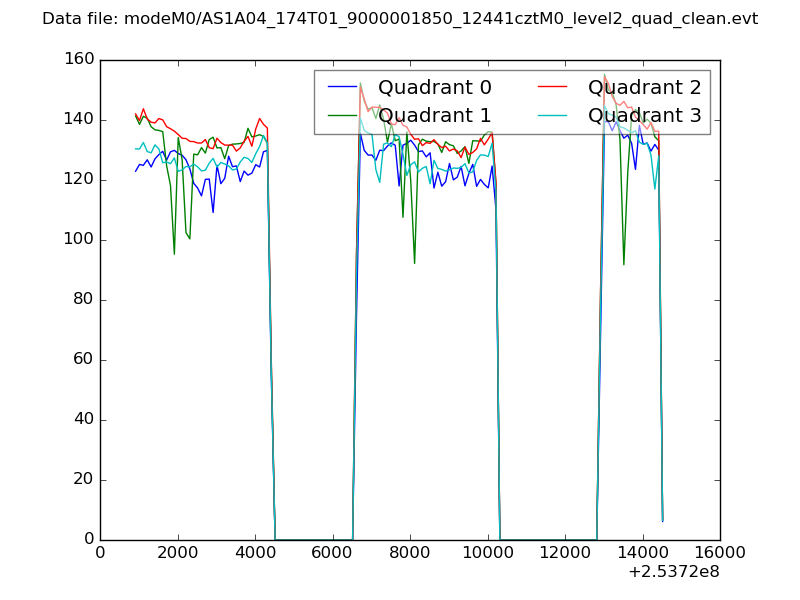 |
|
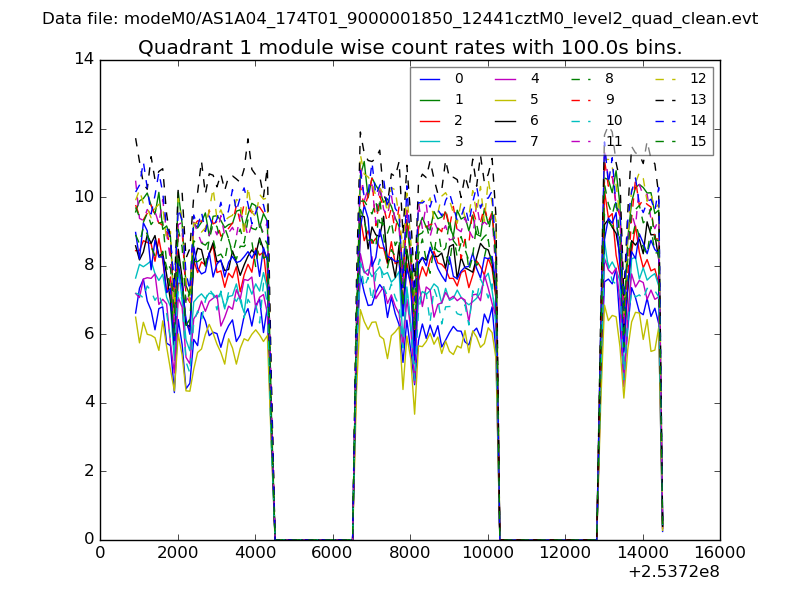
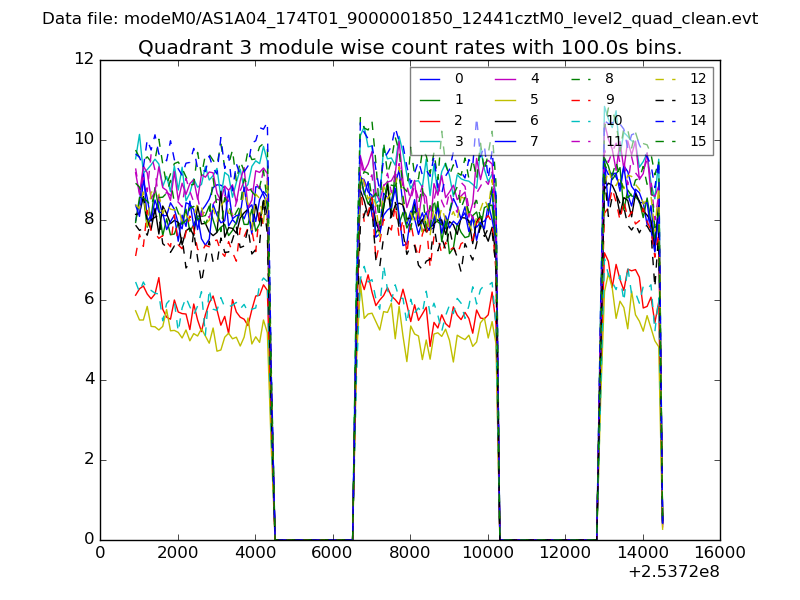
| Module-wise count rates for Quadrant A Data is divided into 100 sec bins |
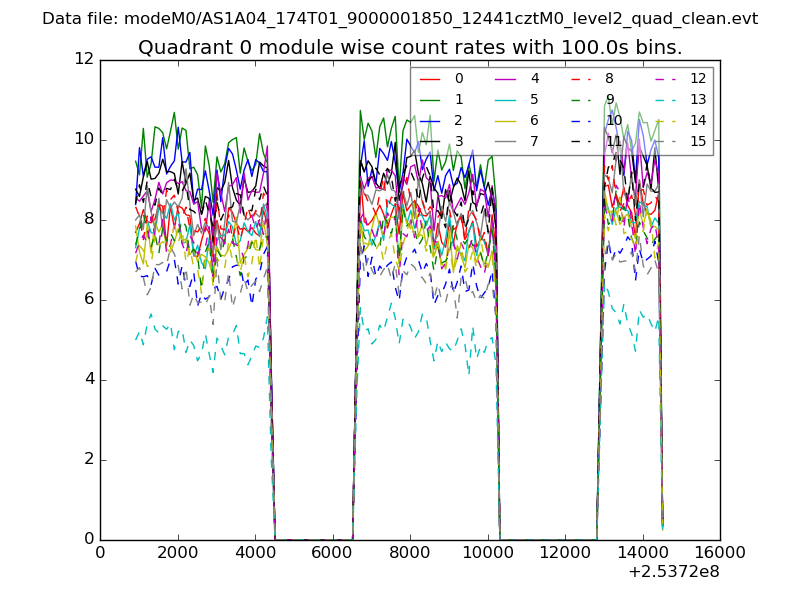 |
 |
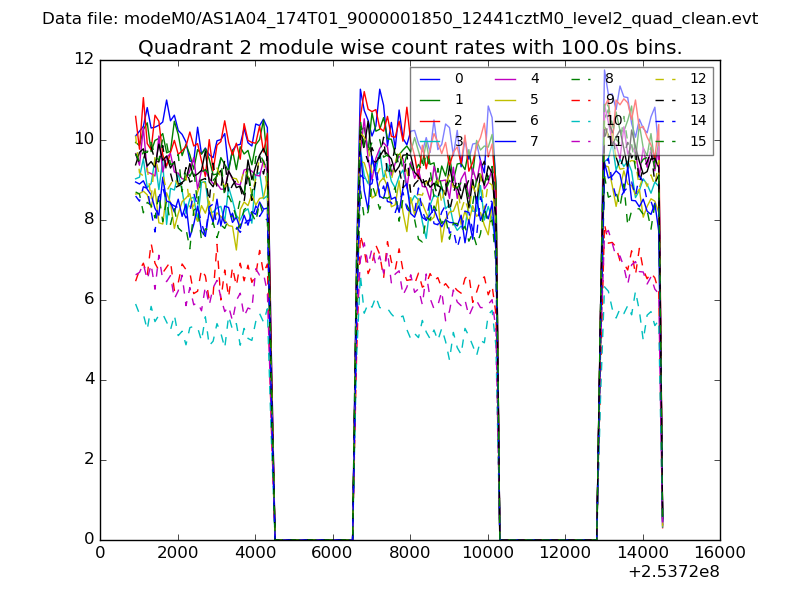
| Module-wise count rates for Quadrant B Data is divided into 100 sec bins |
 |
 |
| Module-wise count rates for Quadrant C Data is divided into 100 sec bins |
 |
 |
| Module-wise count rates for Quadrant D Data is divided into 100 sec bins |
 |
 |
| Parameter | Plot |
|---|---|
| CZT HV Monitor | 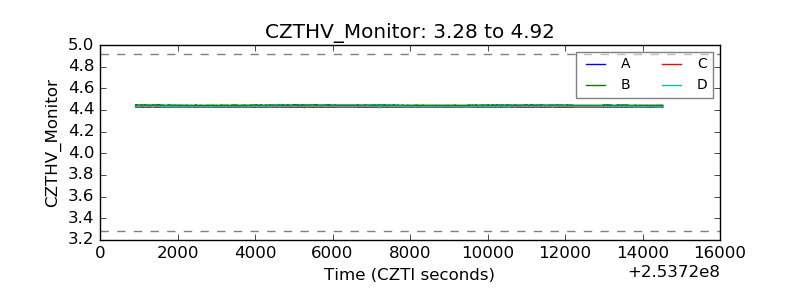 |
| D_VDD | 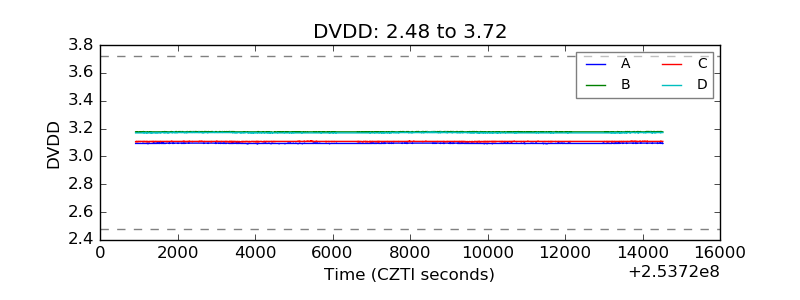 |
| Temperature 1 | 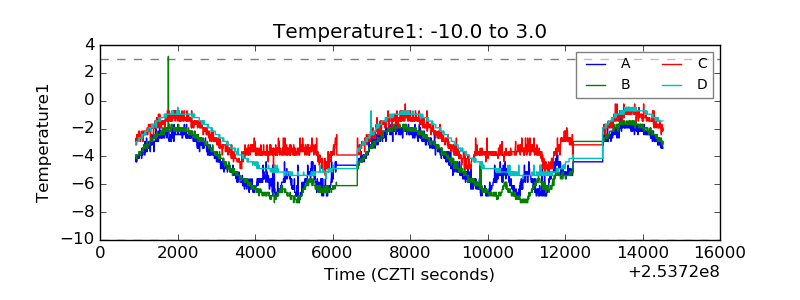 |
| Veto HV Monitor | 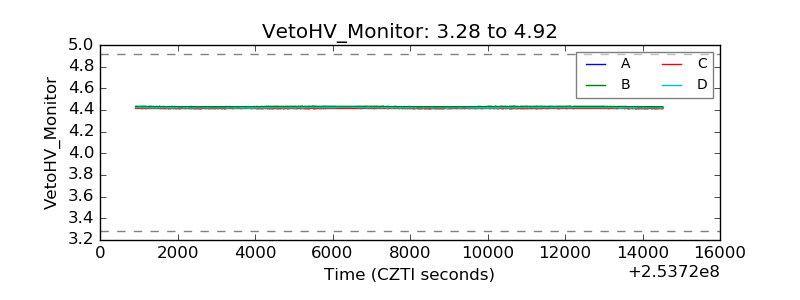 |
| Veto LLD | 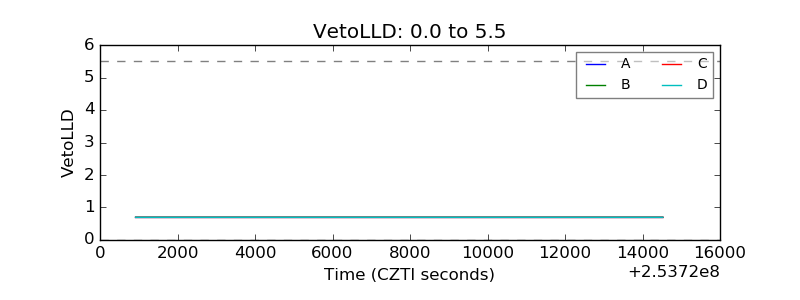 |
| Alpha Counter | 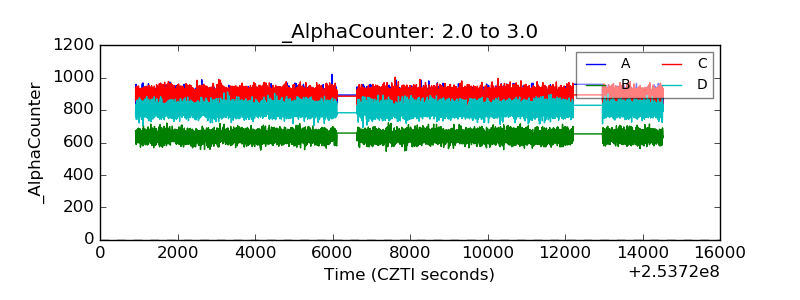 |
| _CPM_Rate | 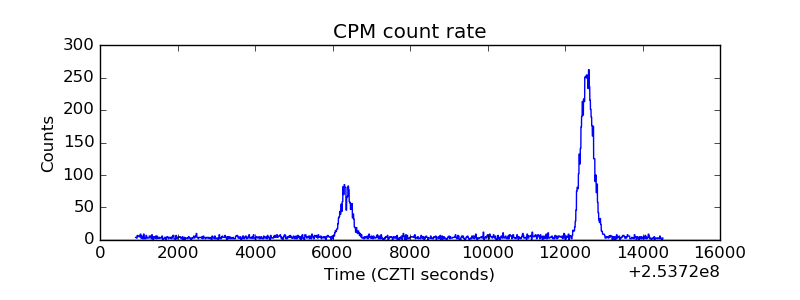 |
| CZT Counter | 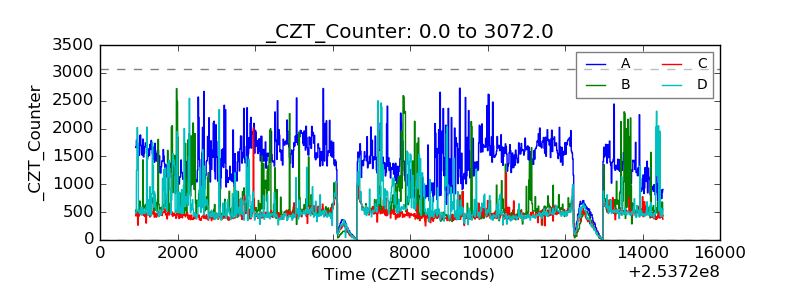 |
| +2.5 Volts monitor |  |
| +5 Volts monitor |  |
| _ROLL_ROT | 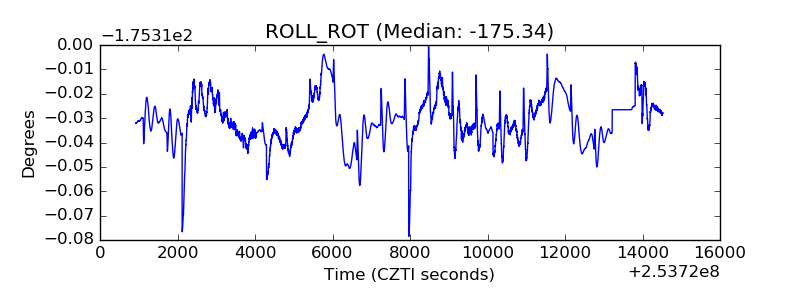 |
| _Roll_DEC | 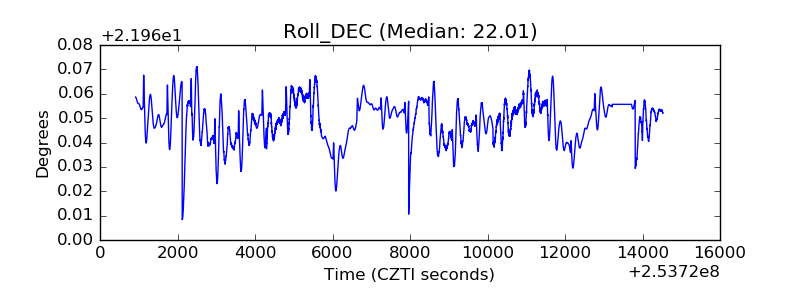 |
| _Roll_RA | 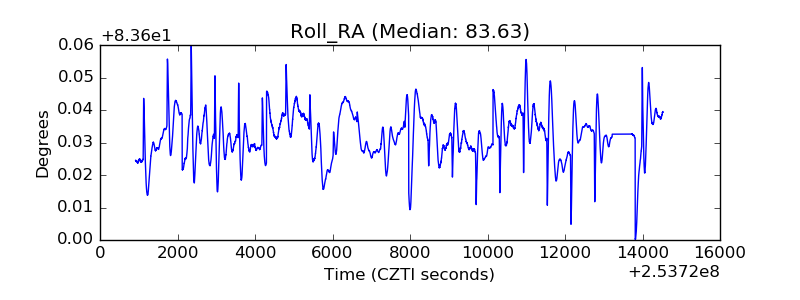 |
| Veto Counter | 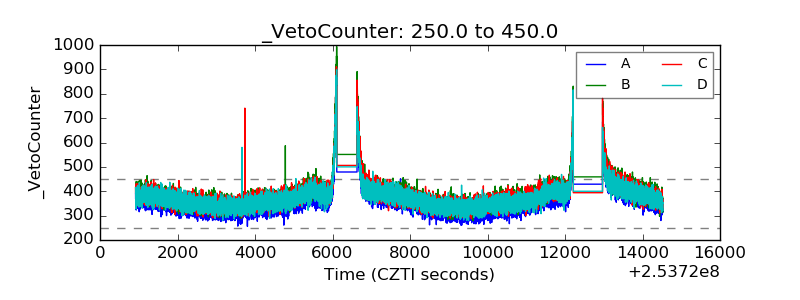 |