| Param | Original file | Final file |
|---|---|---|
| Filename | modeM0/AS1A04_174T01_9000001850_12442cztM0_level2.evt | modeM0/AS1A04_174T01_9000001850_12442cztM0_level2_quad_clean.evt |
| Size (bytes) | 583,827,840 | 87,554,880 |
| Size | 556.8 MB | 83.5 MB |
| Events in quadrant A | 7,023,772 | 542,746 |
| Events in quadrant B | 3,651,365 | 559,702 |
| Events in quadrant C | 3,023,735 | 569,084 |
| Events in quadrant D | 3,556,994 | 540,828 |
| Mode M0 | |||
|---|---|---|---|
| Quadrant | BADHDUFLAG | Total packets | Discarded packets |
| A | 0 | 25348 | 2 |
| B | 0 | 14751 | 1 |
| C | 0 | 13178 | 1 |
| D | 0 | 14827 | 1 |
| Mode M9 | |||
|---|---|---|---|
| Quadrant | BADHDUFLAG | Total packets | Discarded packets |
| A | 0 | 9 | 0 |
| B | 0 | 9 | 0 |
| C | 0 | 9 | 0 |
| D | 0 | 9 | 0 |
| Mode SS | |||
|---|---|---|---|
| Quadrant | BADHDUFLAG | Total packets | Discarded packets |
| A | 0 | 128 | 0 |
| B | 0 | 128 | 0 |
| C | 0 | 128 | 0 |
| D | 0 | 128 | 0 |
| Quadrant | Total seconds | Saturated seconds | Saturation percentage |
|---|---|---|---|
| A | 6289 | 336 | 5.342662% |
| B | 6289 | 247 | 3.927492% |
| C | 6289 | 52 | 0.826841% |
| D | 6289 | 169 | 2.687232% |
Noise dominated data is calculated using 1-second bins in cleaned event files. If a bin has >2000 counts, and if more than 50% of those come from <1% of pixels, then it is considered to be noise-dominated and hence unusable.
| Quadrant | # 1 sec bins | Bins with >0 counts | Bins with >2000 counts | High rate bins dominated by noise | Noise dominated (total time) | Noise dominated (detector-on time) | Marked lightcurve |
|---|---|---|---|---|---|---|---|
| A | 7195 | 6290 | 84 | 84 | 1.17% | 1.34% | 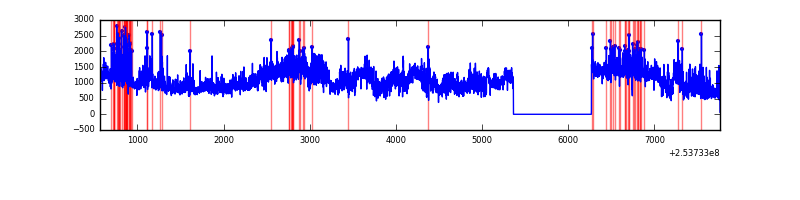 |
| B | 7195 | 6290 | 120 | 120 | 1.67% | 1.91% | 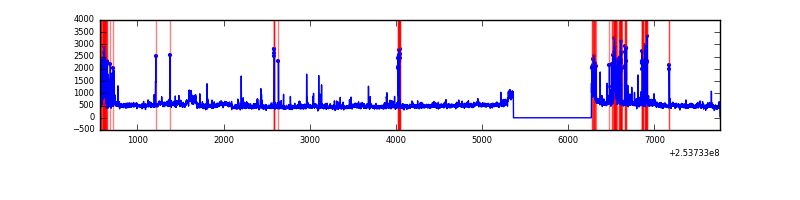 |
| C | 7195 | 6290 | 10 | 10 | 0.14% | 0.16% | 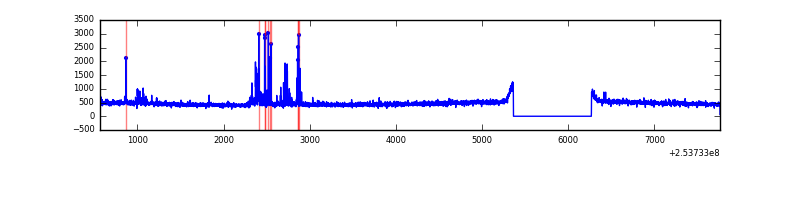 |
| D | 7195 | 6290 | 116 | 116 | 1.61% | 1.84% | 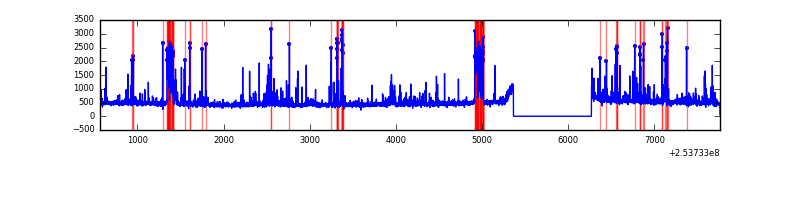 |
Top three noisy pixels from each quadrant. If the there are fewer than three noisy pixels in the level2.evt file, extra rows are filled as -1
| Pixel properties | Quadrant properties | ||||||
|---|---|---|---|---|---|---|---|
| Quadrant | DetID | PixID | Counts | Sigma | Mean | Median | Sigma |
| A | 0 | 23 | 2601209 | 16979.17 | 745 | 731 | 153.2 |
| A | 13 | 251 | 985736 | 6431.34 | 745 | 731 | 153.2 |
| A | 0 | 226 | 188113 | 1223.46 | 745 | 731 | 153.2 |
| B | 4 | 239 | 410674 | 2862.3 | 746 | 730 | 143.2 |
| B | 0 | 219 | 135544 | 941.29 | 746 | 730 | 143.2 |
| B | 3 | 64 | 120098 | 833.45 | 746 | 730 | 143.2 |
| C | 15 | 208 | 140959 | 821.84 | 739 | 747 | 170.6 |
| C | 13 | 61 | 5416 | 27.37 | 739 | 747 | 170.6 |
| C | 14 | 234 | 2304 | 9.13 | 739 | 747 | 170.6 |
| D | 1 | 52 | 408857 | 2303.32 | 734 | 716 | 177.2 |
| D | 13 | 104 | 157188 | 883.04 | 734 | 716 | 177.2 |
| D | 13 | 249 | 85824 | 480.3 | 734 | 716 | 177.2 |
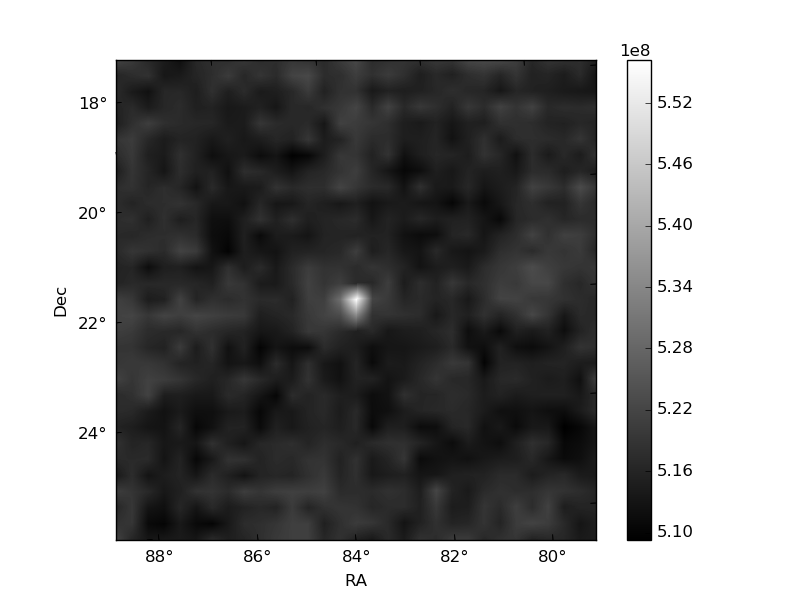
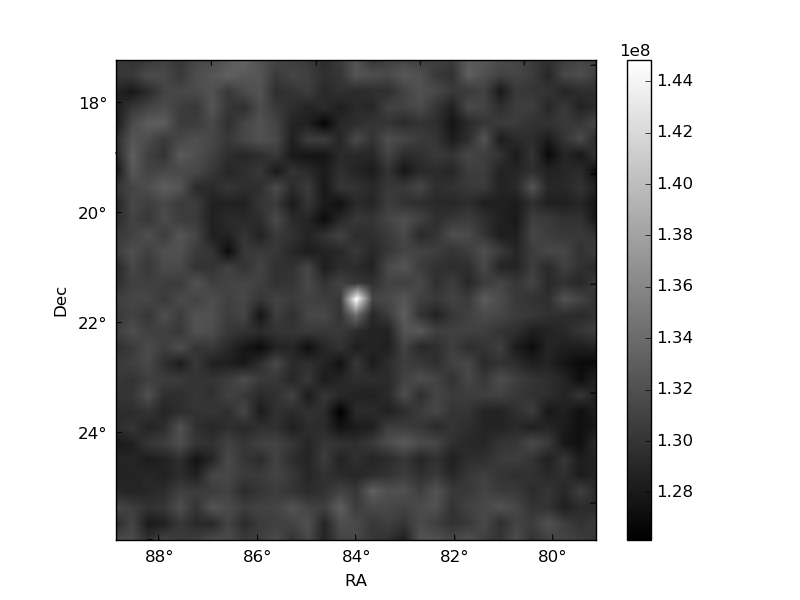
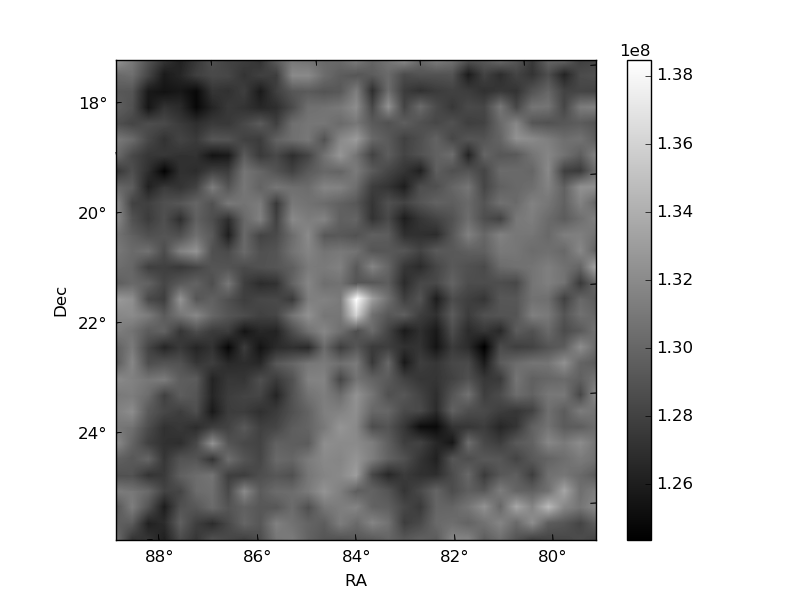
Histogram calculated using DETX and DETY for each event in the final _common_clean file
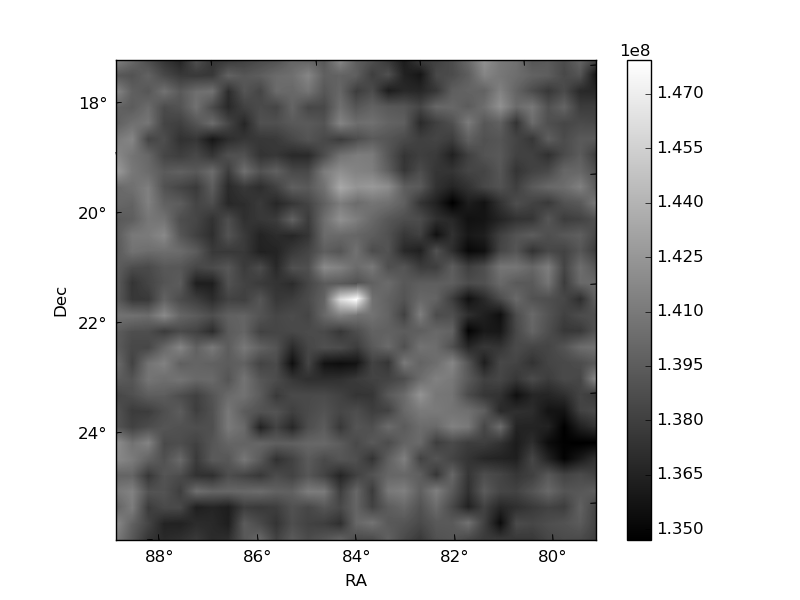
| Quadrant A | 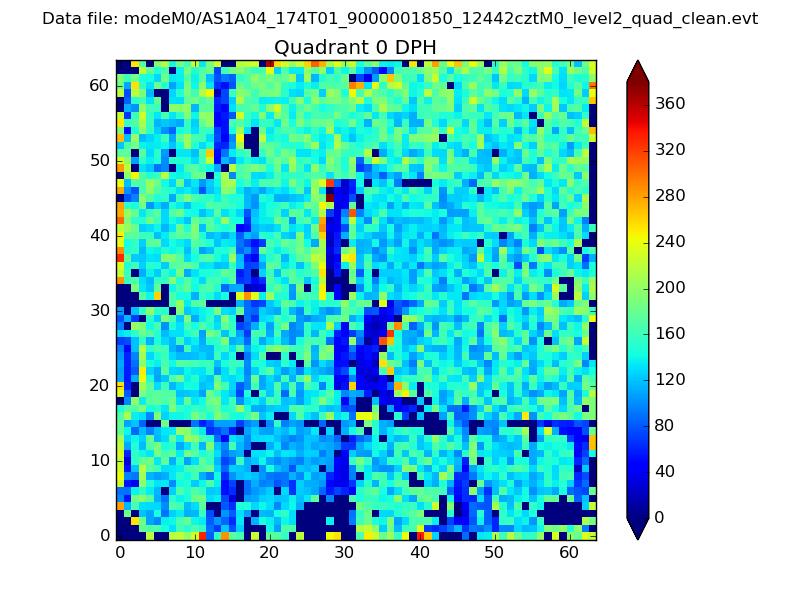 |
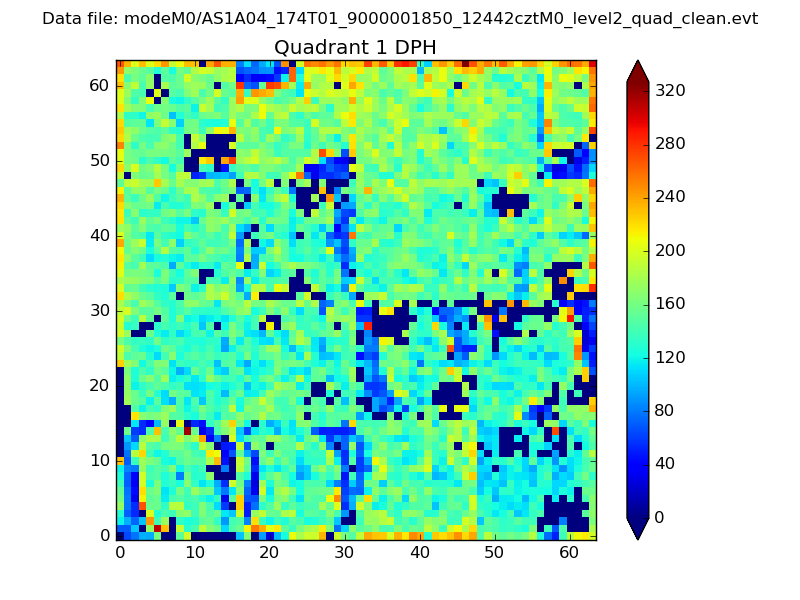 |
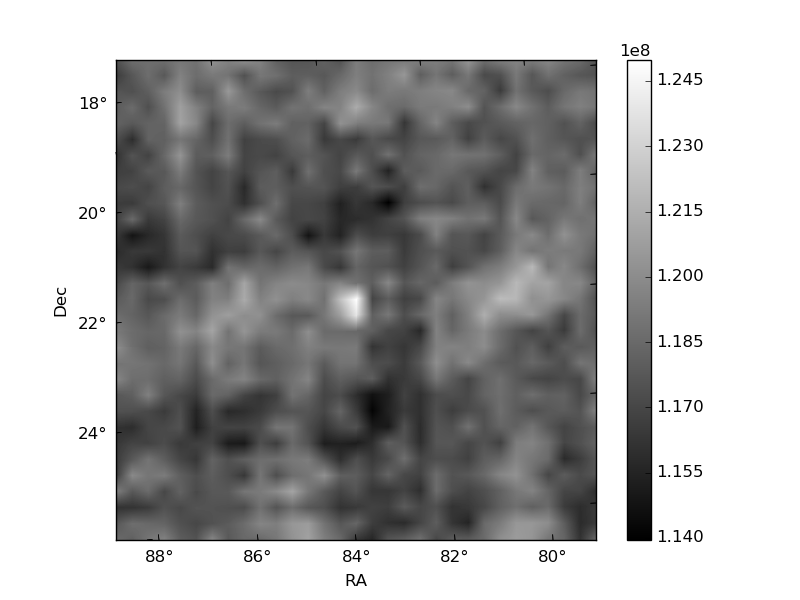
Quadrant B |
|---|---|---|---|
| Quadrant D | 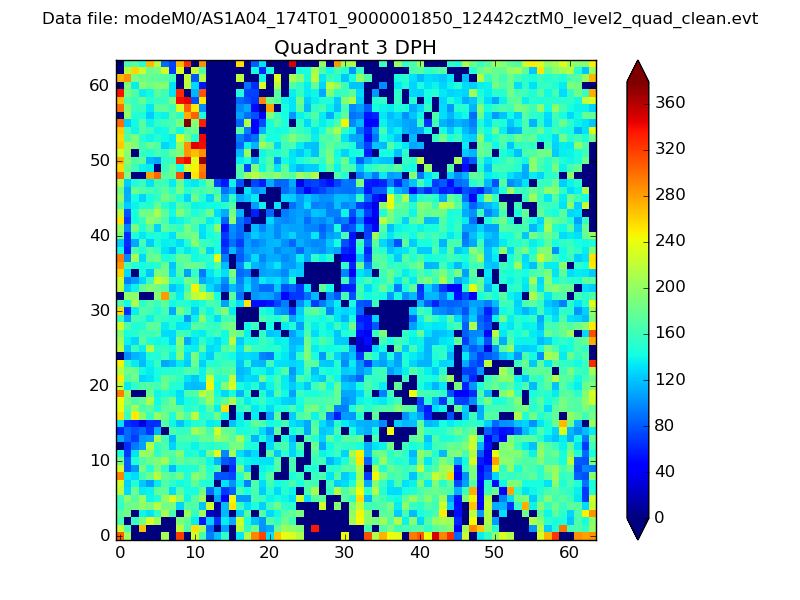 |
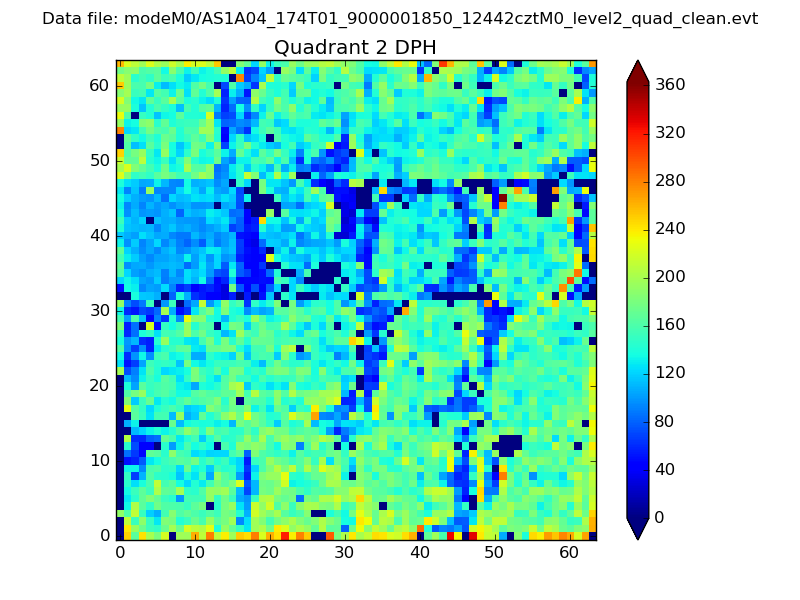 |
Quadrant C |
| Plot type | Count rate plots | Images |
|---|---|---|
| Comparison with Poisson distribution Blue bars denote a histogram of data divided into 1 sec bins. Red curve is a Poisson curve with rate = median count rate of data. |
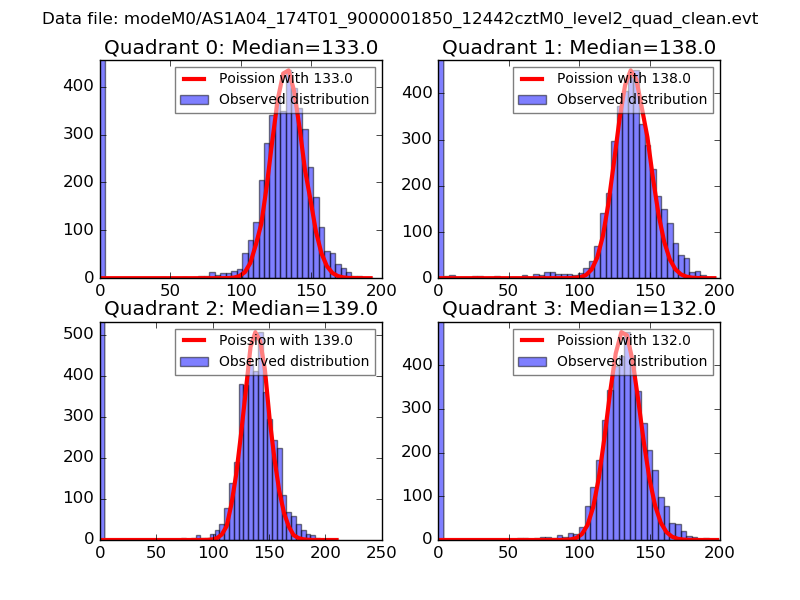 |
 |
| Quadrant-wise count rates Data is divided into 100 sec bins |
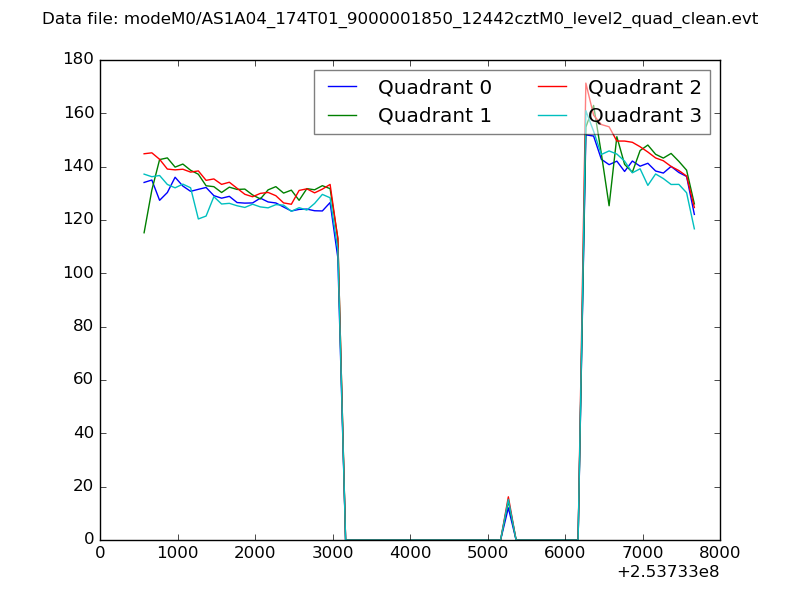 |
|
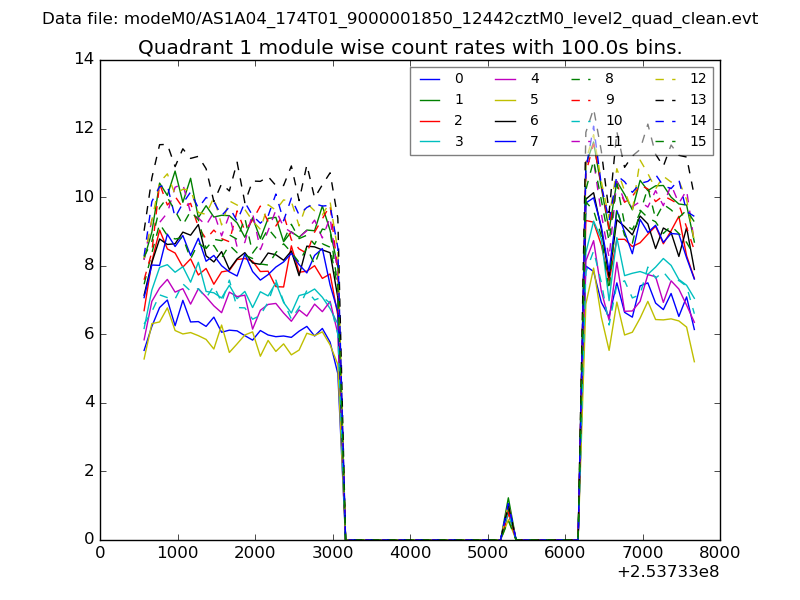
| Module-wise count rates for Quadrant A Data is divided into 100 sec bins |
 |
 |
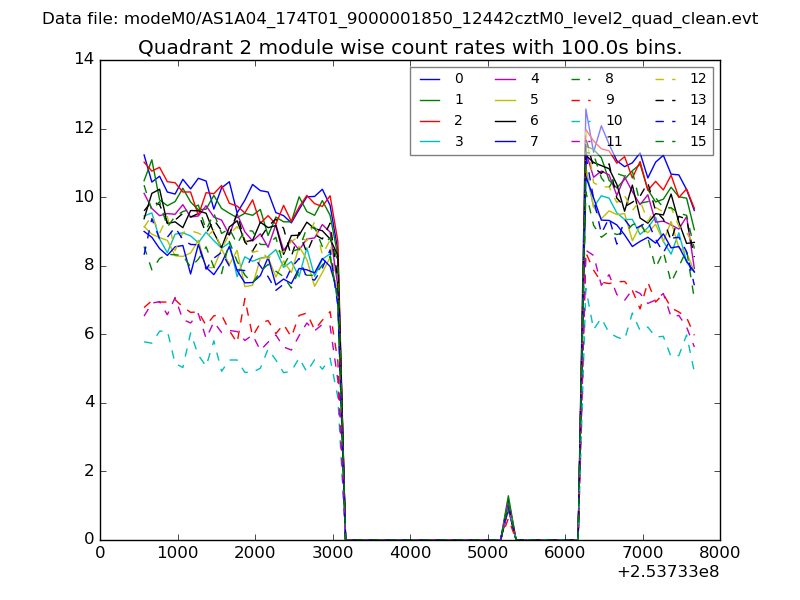
| Module-wise count rates for Quadrant B Data is divided into 100 sec bins |
 |
 |
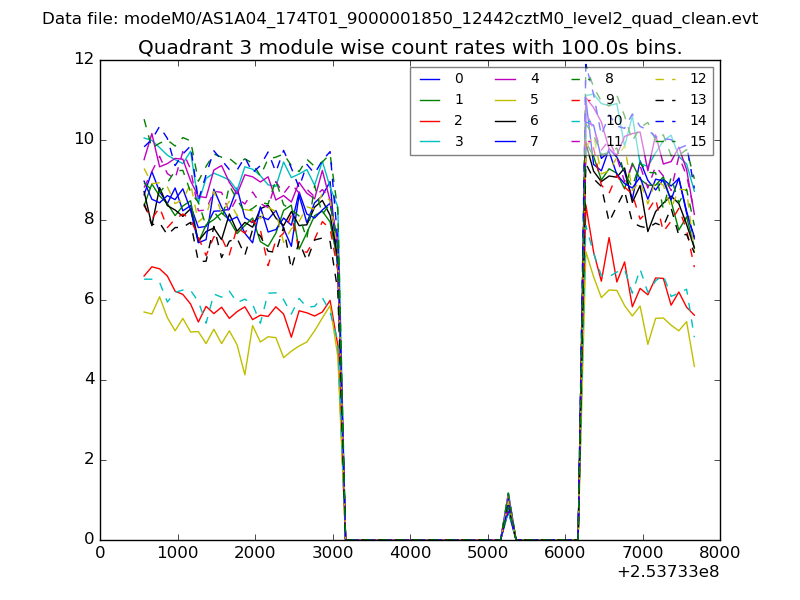
| Module-wise count rates for Quadrant C Data is divided into 100 sec bins |
 |
 |
| Module-wise count rates for Quadrant D Data is divided into 100 sec bins |
 |
 |
| Parameter | Plot |
|---|---|
| CZT HV Monitor | 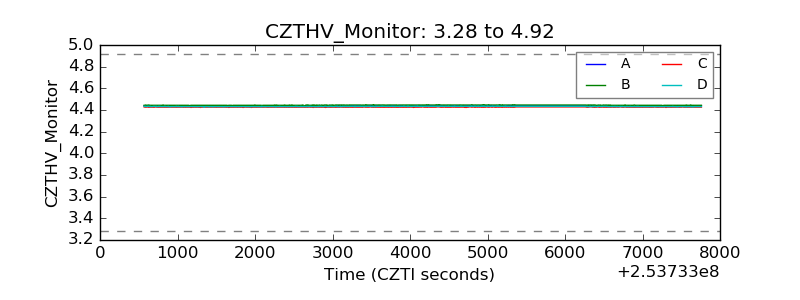 |
| D_VDD | 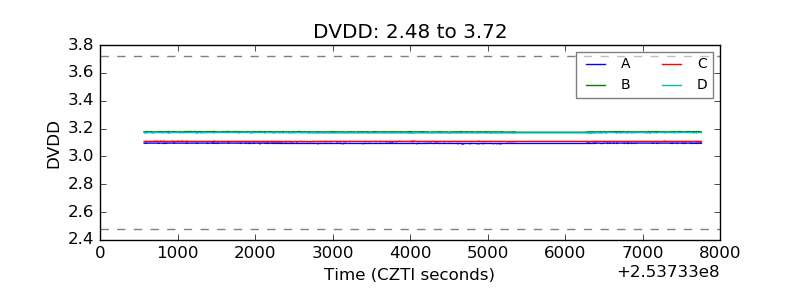 |
| Temperature 1 | 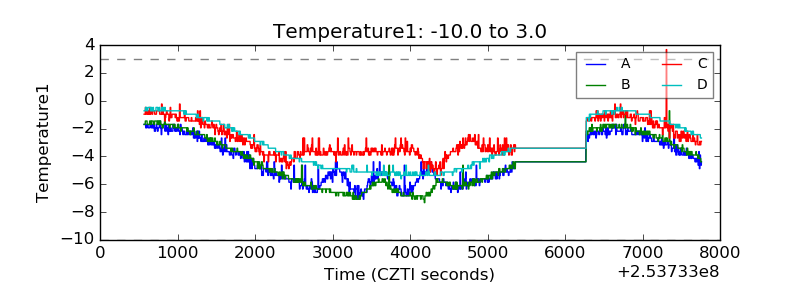 |
| Veto HV Monitor | 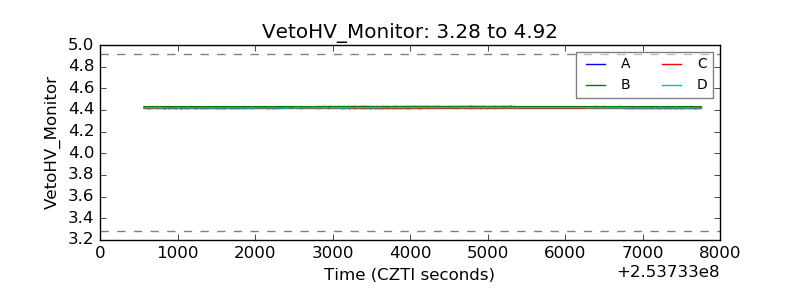 |
| Veto LLD | 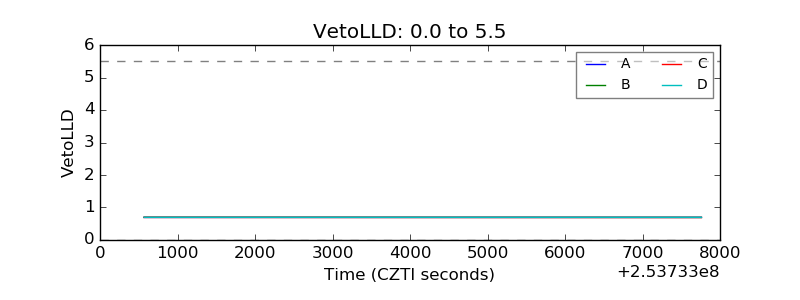 |
| Alpha Counter | 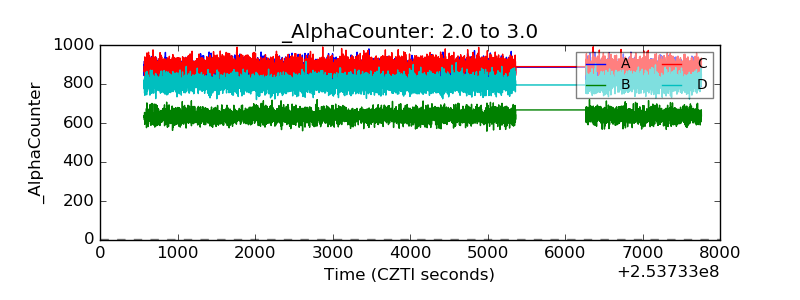 |
| _CPM_Rate | 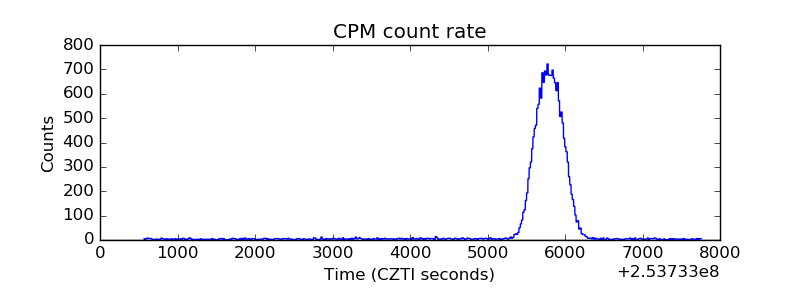 |
| CZT Counter | 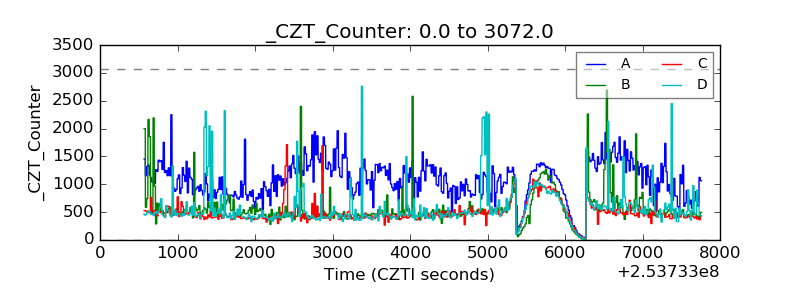 |
| +2.5 Volts monitor |  |
| +5 Volts monitor |  |
| _ROLL_ROT | 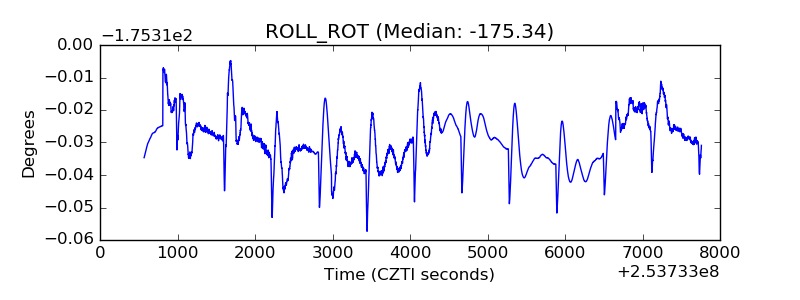 |
| _Roll_DEC | 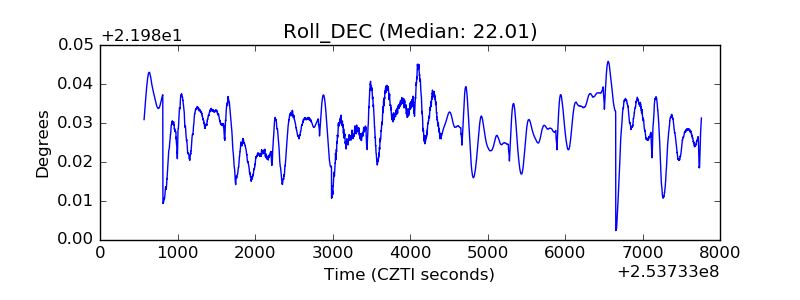 |
| _Roll_RA | 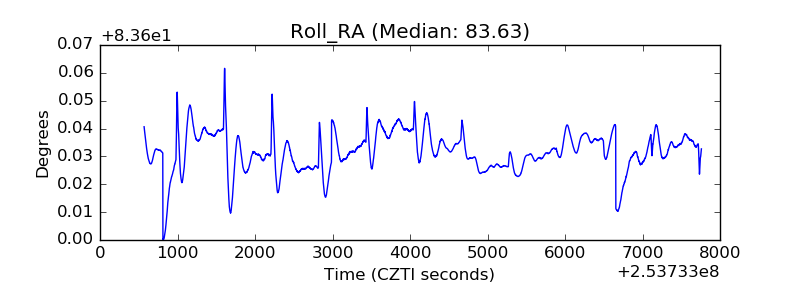 |
| Veto Counter | 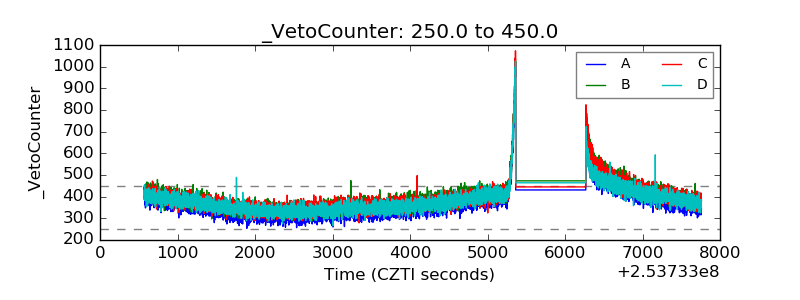 |