| Param | Original file | Final file |
|---|---|---|
| Filename | modeM0/AS1A04_174T01_9000001850_12445cztM0_level2.evt | modeM0/AS1A04_174T01_9000001850_12445cztM0_level2_quad_clean.evt |
| Size (bytes) | 601,755,840 | 94,282,560 |
| Size | 573.9 MB | 89.9 MB |
| Events in quadrant A | 5,208,267 | 622,024 |
| Events in quadrant B | 3,954,006 | 625,180 |
| Events in quadrant C | 3,044,076 | 633,469 |
| Events in quadrant D | 5,588,565 | 531,890 |
| Mode M0 | |||
|---|---|---|---|
| Quadrant | BADHDUFLAG | Total packets | Discarded packets |
| A | 0 | 19846 | 3 |
| B | 0 | 15847 | 2 |
| C | 0 | 13109 | 2 |
| D | 0 | 20970 | 2 |
| Mode M9 | |||
|---|---|---|---|
| Quadrant | BADHDUFLAG | Total packets | Discarded packets |
| A | 0 | 14 | 0 |
| B | 0 | 14 | 0 |
| C | 0 | 14 | 0 |
| D | 0 | 15 | 0 |
| Mode SS | |||
|---|---|---|---|
| Quadrant | BADHDUFLAG | Total packets | Discarded packets |
| A | 0 | 130 | 0 |
| B | 0 | 130 | 0 |
| C | 0 | 130 | 0 |
| D | 0 | 130 | 0 |
| Quadrant | Total seconds | Saturated seconds | Saturation percentage |
|---|---|---|---|
| A | 6333 | 479 | 7.563556% |
| B | 6333 | 300 | 4.737091% |
| C | 6333 | 11 | 0.173693% |
| D | 6333 | 931 | 14.700774% |
Noise dominated data is calculated using 1-second bins in cleaned event files. If a bin has >2000 counts, and if more than 50% of those come from <1% of pixels, then it is considered to be noise-dominated and hence unusable.
| Quadrant | # 1 sec bins | Bins with >0 counts | Bins with >2000 counts | High rate bins dominated by noise | Noise dominated (total time) | Noise dominated (detector-on time) | Marked lightcurve |
|---|---|---|---|---|---|---|---|
| A | 7559 | 6335 | 288 | 288 | 3.81% | 4.55% | 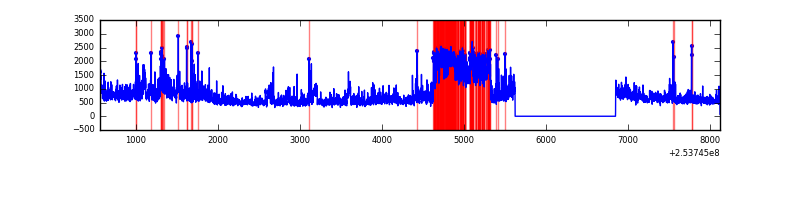 |
| B | 7559 | 6334 | 227 | 227 | 3.00% | 3.58% | 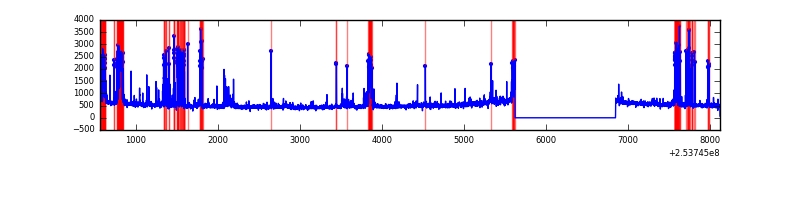 |
| C | 7559 | 6335 | 2 | 2 | 0.03% | 0.03% | 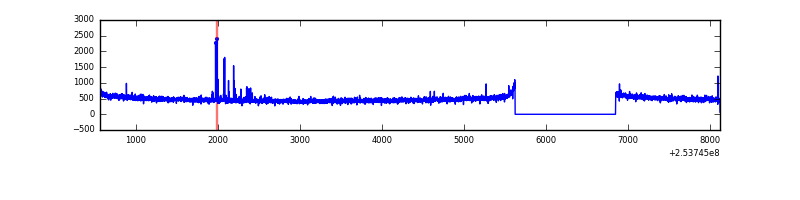 |
| D | 7559 | 6335 | 760 | 760 | 10.05% | 12.00% | 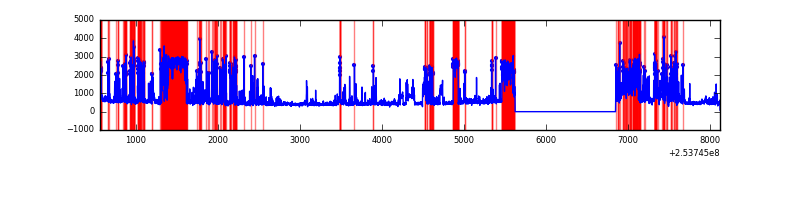 |
Top three noisy pixels from each quadrant. If the there are fewer than three noisy pixels in the level2.evt file, extra rows are filled as -1
| Pixel properties | Quadrant properties | ||||||
|---|---|---|---|---|---|---|---|
| Quadrant | DetID | PixID | Counts | Sigma | Mean | Median | Sigma |
| A | 0 | 23 | 1049487 | 6682.76 | 776 | 764 | 156.9 |
| A | 13 | 251 | 435494 | 2770.22 | 776 | 764 | 156.9 |
| A | 1 | 162 | 197635 | 1254.52 | 776 | 764 | 156.9 |
| B | 4 | 239 | 765670 | 5233.59 | 773 | 757 | 146.2 |
| B | 0 | 187 | 46240 | 311.2 | 773 | 757 | 146.2 |
| B | 11 | 51 | 37740 | 253.04 | 773 | 757 | 146.2 |
| C | 15 | 208 | 30187 | 164.9 | 772 | 780 | 178.3 |
| C | 14 | 234 | 6262 | 30.74 | 772 | 780 | 178.3 |
| C | 13 | 61 | 5644 | 27.27 | 772 | 780 | 178.3 |
| D | 1 | 52 | 2694562 | 15865.47 | 705 | 685 | 169.8 |
| D | 13 | 104 | 86411 | 504.88 | 705 | 685 | 169.8 |
| D | 13 | 249 | 50544 | 293.64 | 705 | 685 | 169.8 |
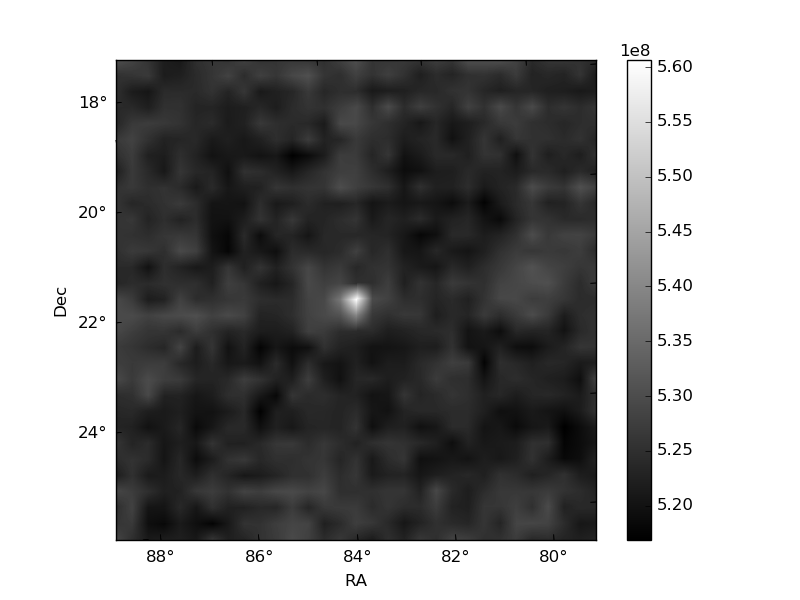
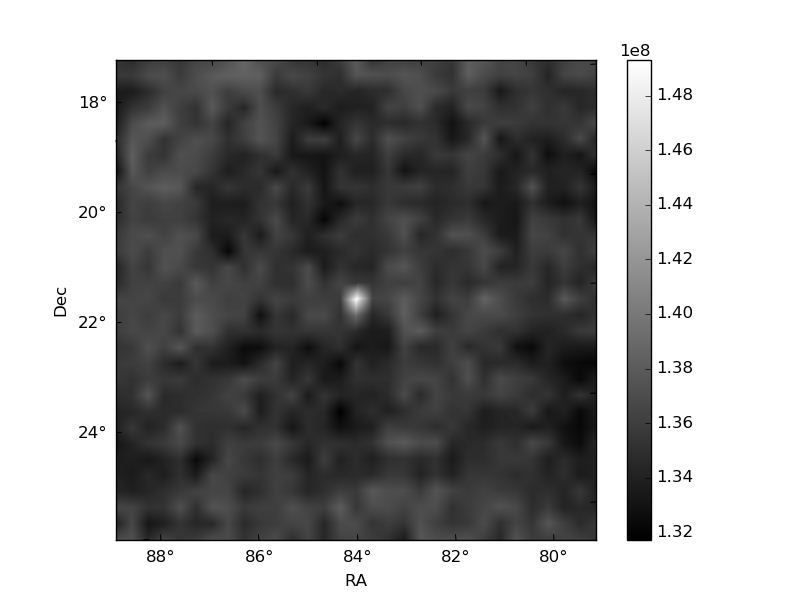
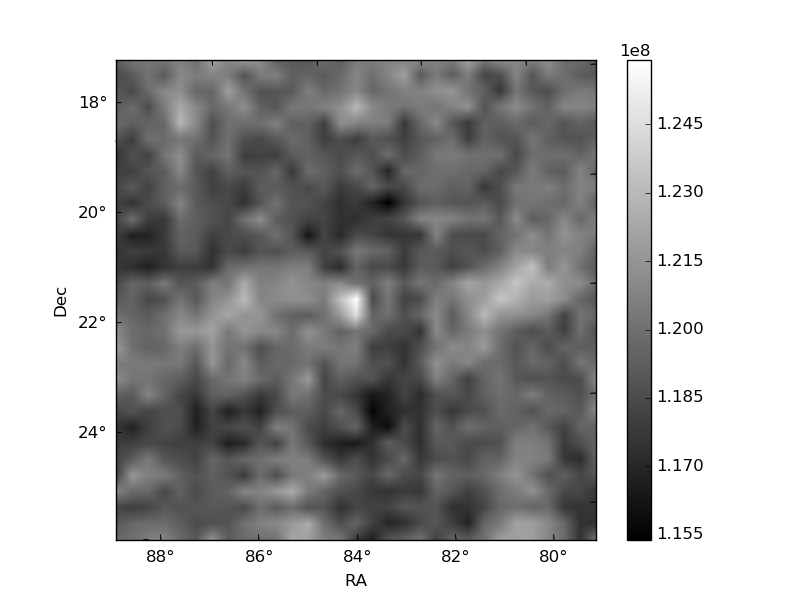
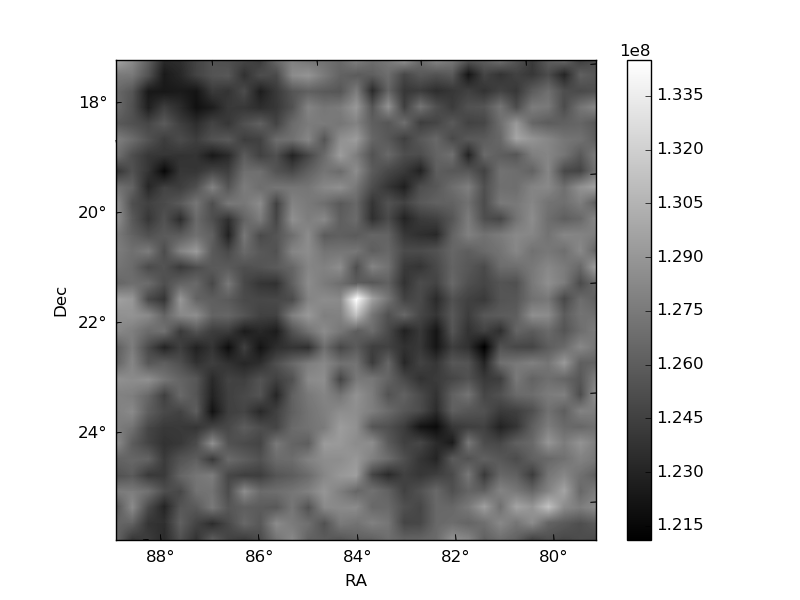
Histogram calculated using DETX and DETY for each event in the final _common_clean file
| Quadrant A | 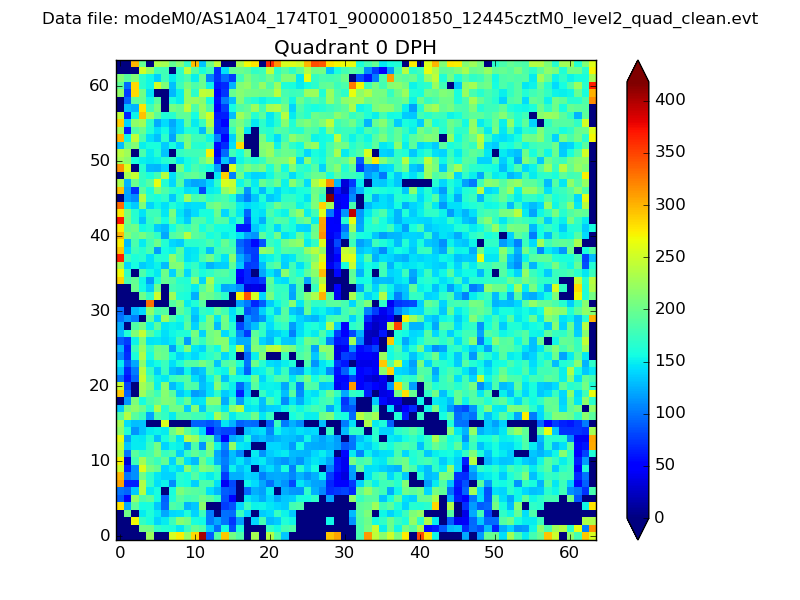 |
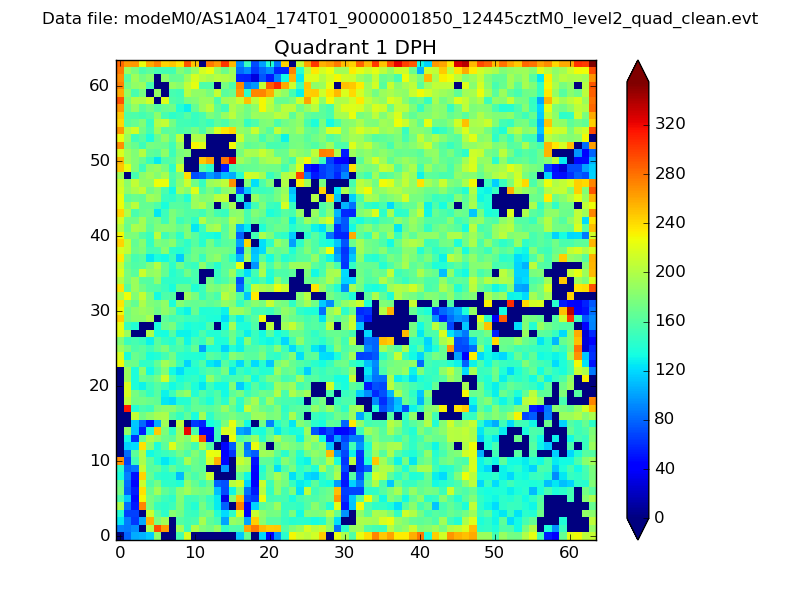 |
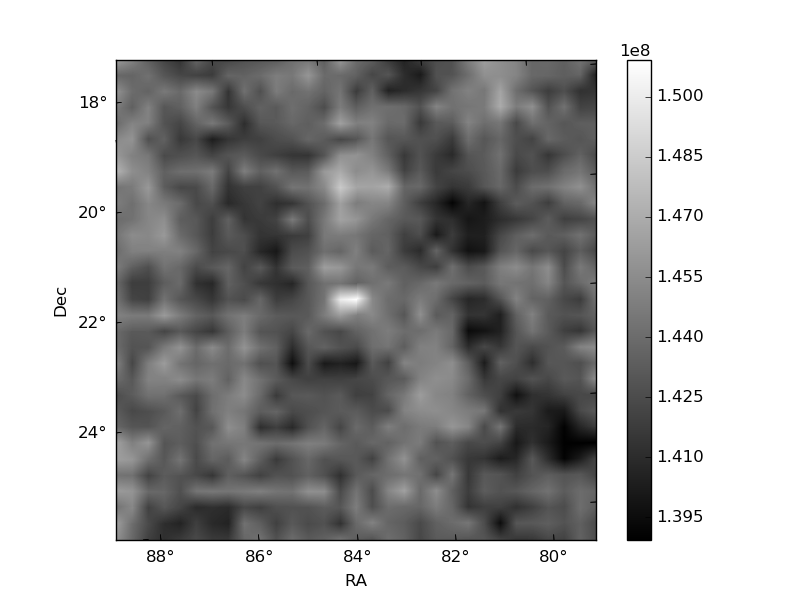
Quadrant B |
|---|---|---|---|
| Quadrant D | 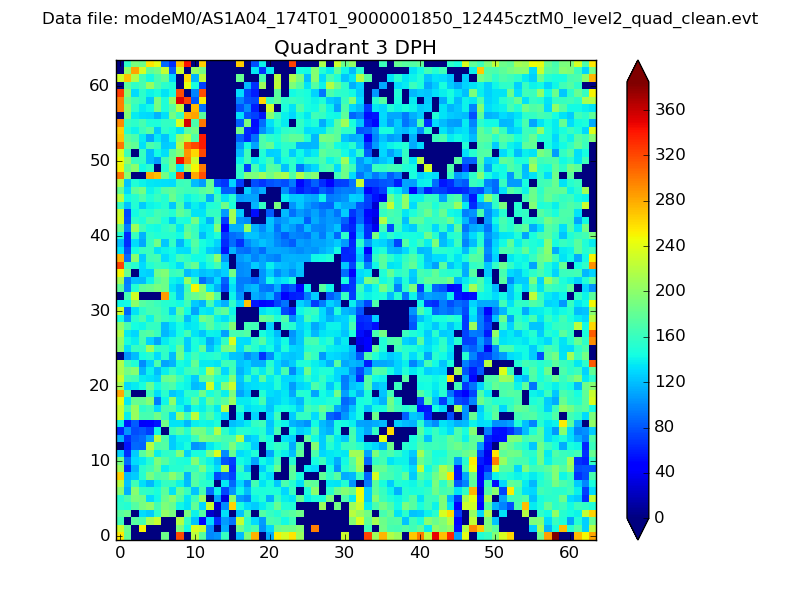 |
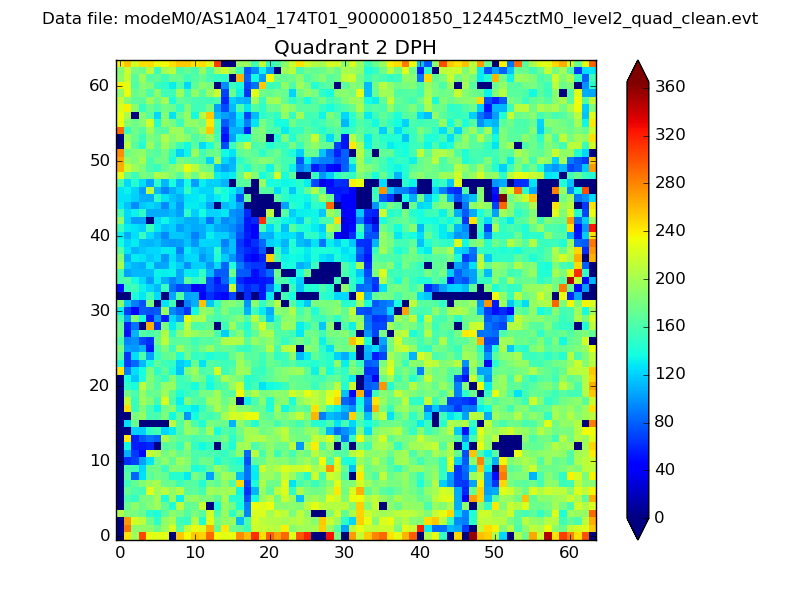 |
Quadrant C |
| Plot type | Count rate plots | Images |
|---|---|---|
| Comparison with Poisson distribution Blue bars denote a histogram of data divided into 1 sec bins. Red curve is a Poisson curve with rate = median count rate of data. |
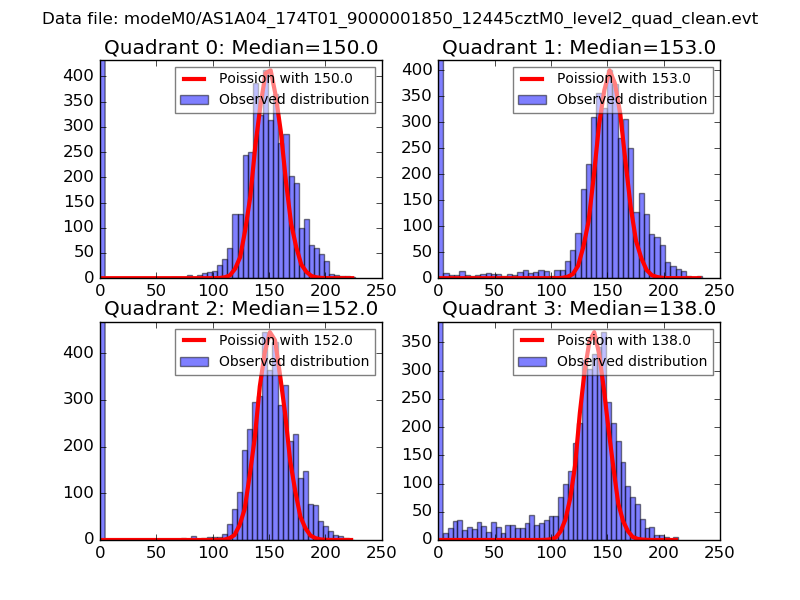 |
 |
| Quadrant-wise count rates Data is divided into 100 sec bins |
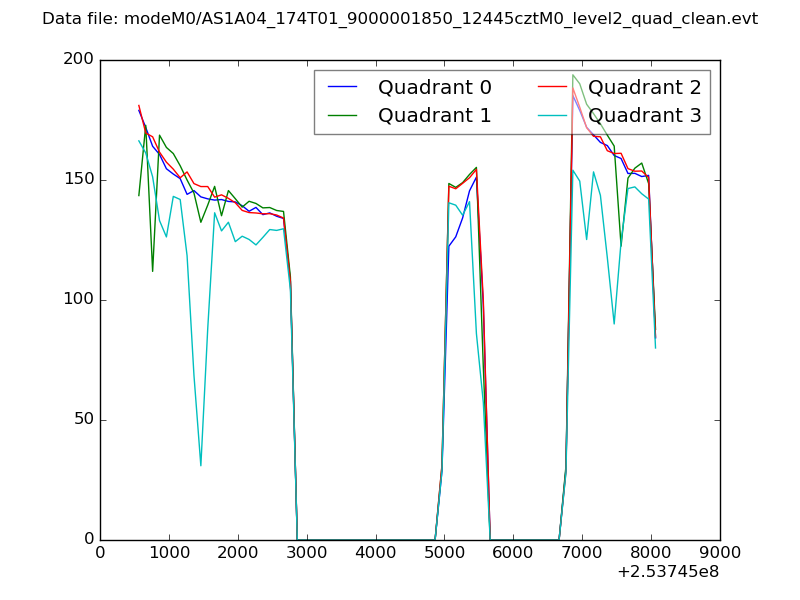 |
|
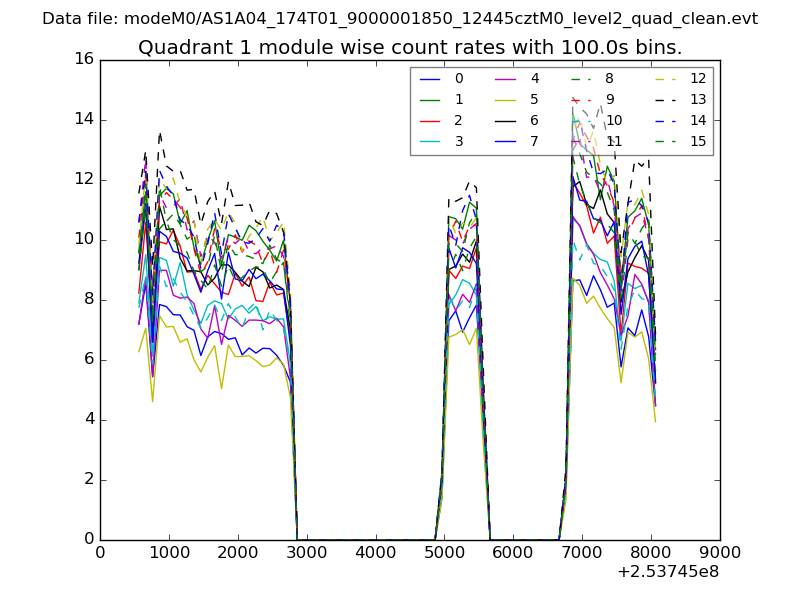
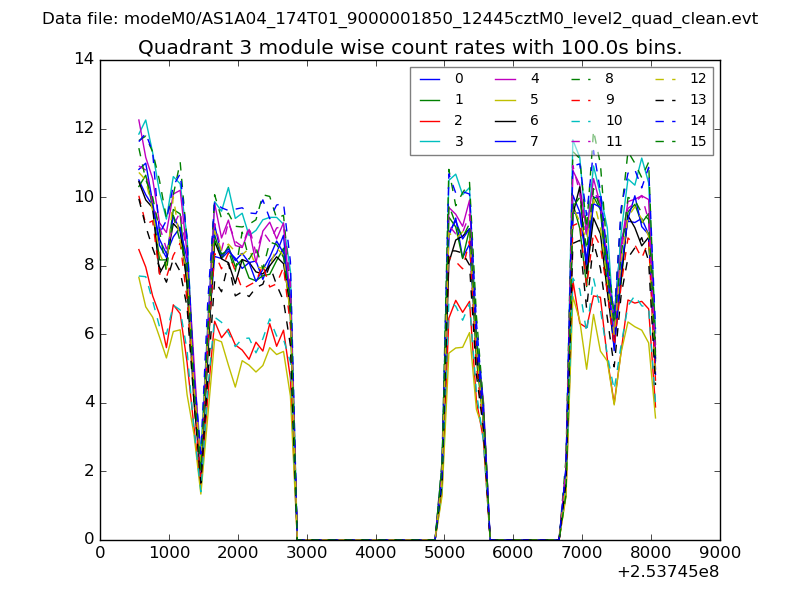
| Module-wise count rates for Quadrant A Data is divided into 100 sec bins |
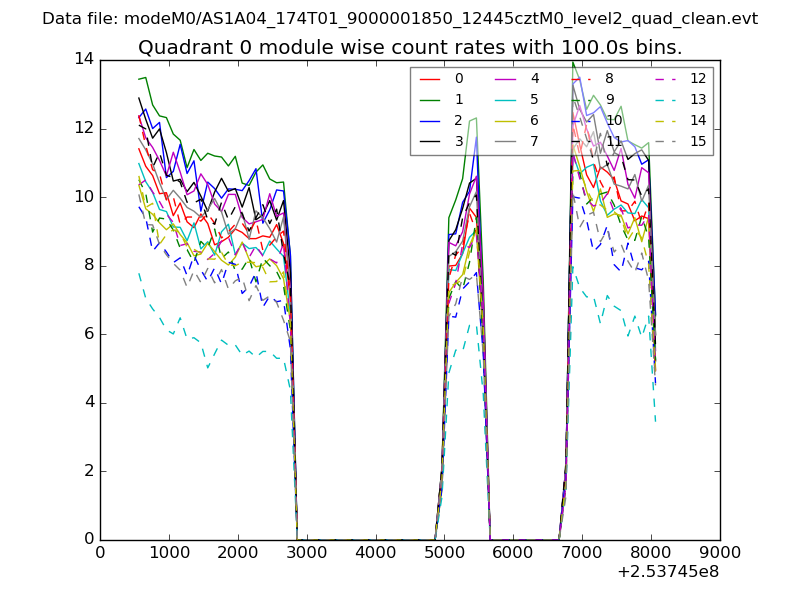 |
 |
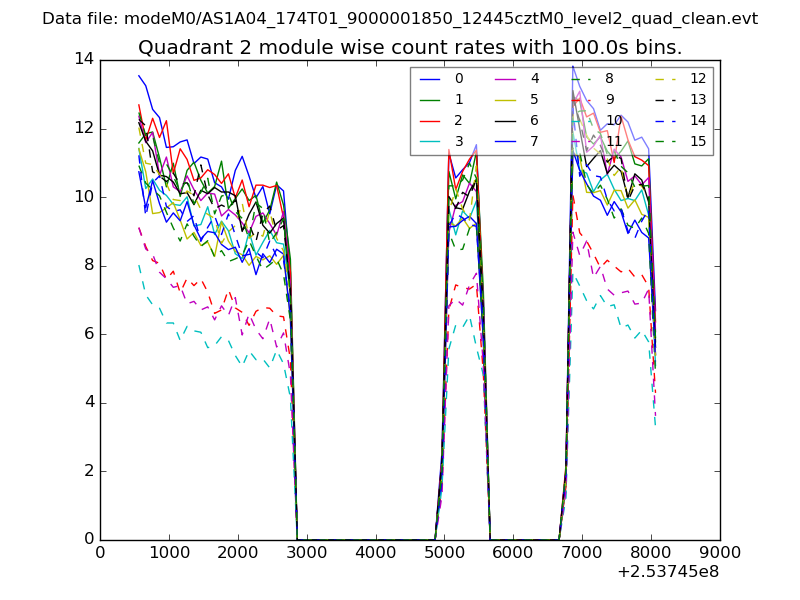
| Module-wise count rates for Quadrant B Data is divided into 100 sec bins |
 |
 |
| Module-wise count rates for Quadrant C Data is divided into 100 sec bins |
 |
 |
| Module-wise count rates for Quadrant D Data is divided into 100 sec bins |
 |
 |
| Parameter | Plot |
|---|---|
| CZT HV Monitor | 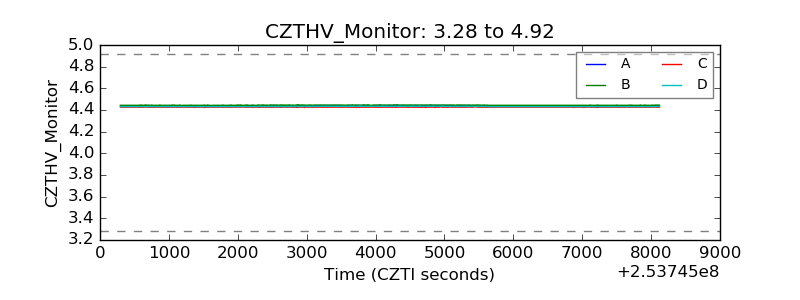 |
| D_VDD | 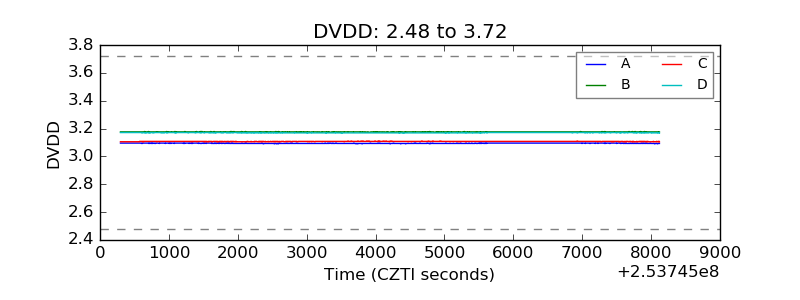 |
| Temperature 1 | 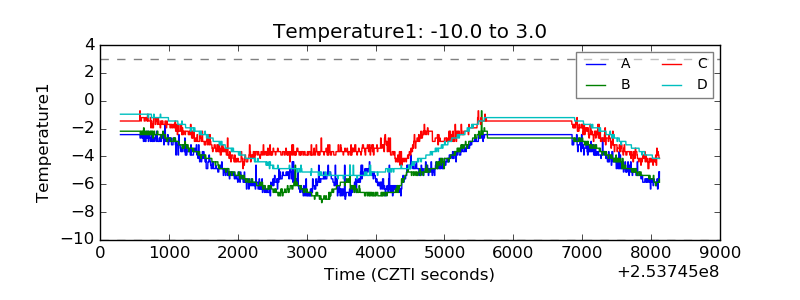 |
| Veto HV Monitor | 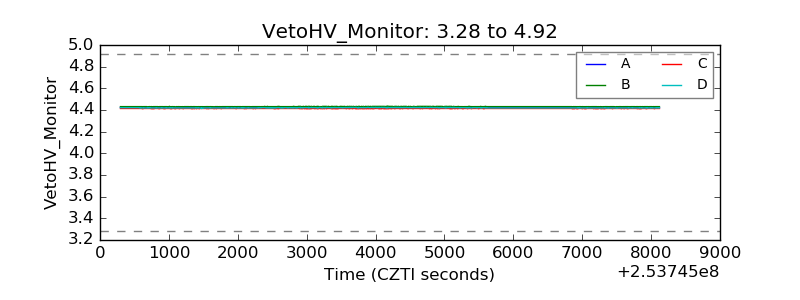 |
| Veto LLD | 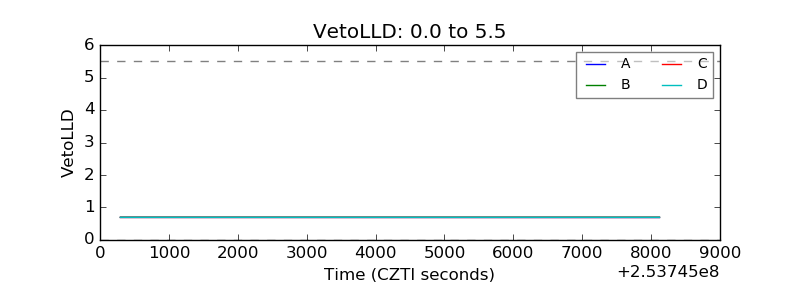 |
| Alpha Counter | 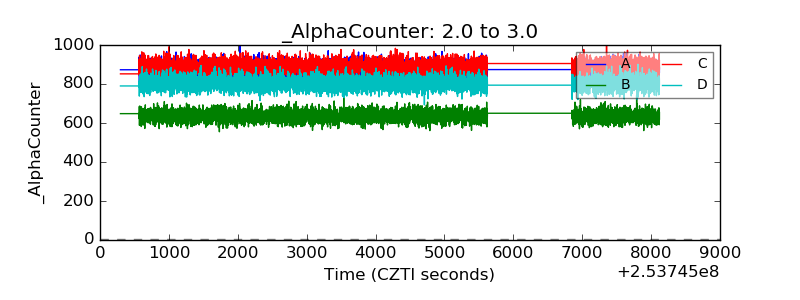 |
| _CPM_Rate | 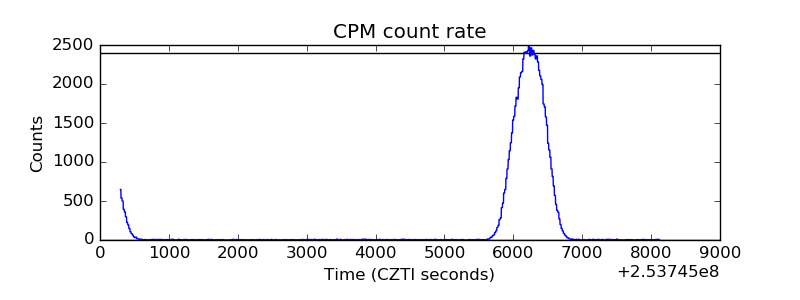 |
| CZT Counter | 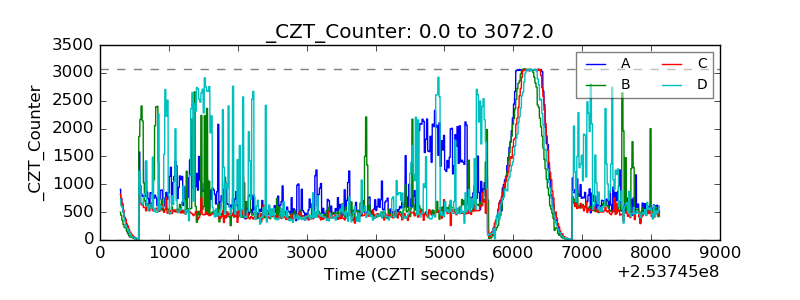 |
| +2.5 Volts monitor |  |
| +5 Volts monitor |  |
| _ROLL_ROT | 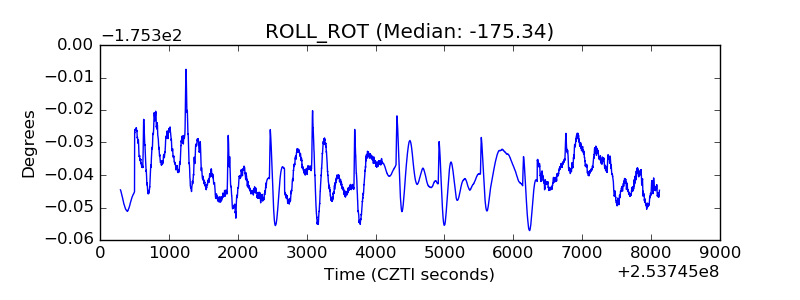 |
| _Roll_DEC | 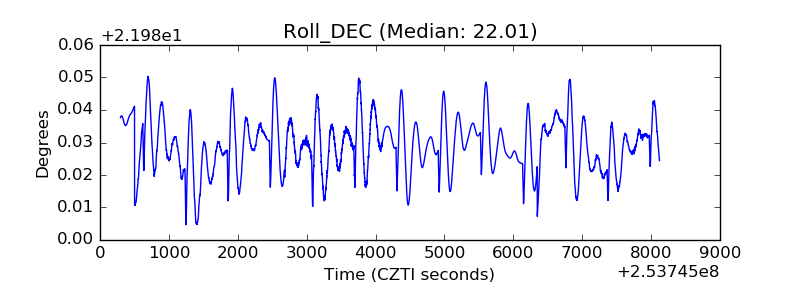 |
| _Roll_RA | 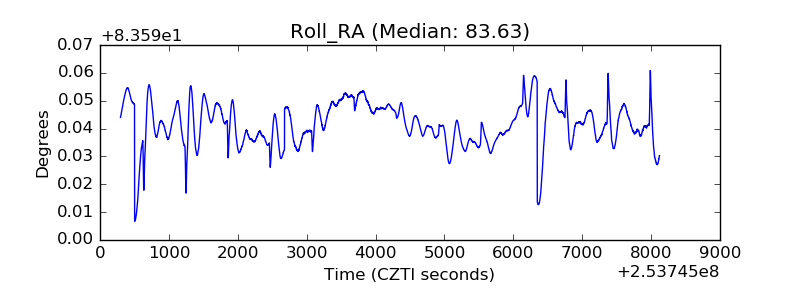 |
| Veto Counter | 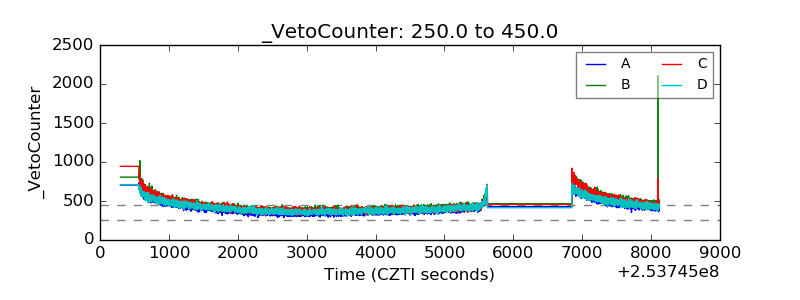 |