| Param | Original file | Final file |
|---|---|---|
| Filename | modeM0/AS1A04_174T01_9000001850_12447cztM0_level2.evt | modeM0/AS1A04_174T01_9000001850_12447cztM0_level2_quad_clean.evt |
| Size (bytes) | 576,532,800 | 93,240,000 |
| Size | 549.8 MB | 88.9 MB |
| Events in quadrant A | 5,963,877 | 602,791 |
| Events in quadrant B | 4,344,655 | 595,181 |
| Events in quadrant C | 3,070,453 | 621,218 |
| Events in quadrant D | 3,663,873 | 573,373 |
| Mode M0 | |||
|---|---|---|---|
| Quadrant | BADHDUFLAG | Total packets | Discarded packets |
| A | 0 | 22123 | 3 |
| B | 0 | 16858 | 2 |
| C | 0 | 12894 | 2 |
| D | 0 | 15017 | 2 |
| Mode M9 | |||
|---|---|---|---|
| Quadrant | BADHDUFLAG | Total packets | Discarded packets |
| A | 0 | 14 | 0 |
| B | 0 | 14 | 0 |
| C | 0 | 14 | 0 |
| D | 0 | 14 | 0 |
| Mode SS | |||
|---|---|---|---|
| Quadrant | BADHDUFLAG | Total packets | Discarded packets |
| A | 0 | 124 | 0 |
| B | 0 | 124 | 0 |
| C | 0 | 124 | 0 |
| D | 0 | 124 | 0 |
| Quadrant | Total seconds | Saturated seconds | Saturation percentage |
|---|---|---|---|
| A | 6179 | 114 | 1.844959% |
| B | 6179 | 462 | 7.476938% |
| C | 6179 | 10 | 0.161838% |
| D | 6180 | 67 | 1.084142% |
Noise dominated data is calculated using 1-second bins in cleaned event files. If a bin has >2000 counts, and if more than 50% of those come from <1% of pixels, then it is considered to be noise-dominated and hence unusable.
| Quadrant | # 1 sec bins | Bins with >0 counts | Bins with >2000 counts | High rate bins dominated by noise | Noise dominated (total time) | Noise dominated (detector-on time) | Marked lightcurve |
|---|---|---|---|---|---|---|---|
| A | 7525 | 6181 | 1 | 1 | 0.01% | 0.02% | 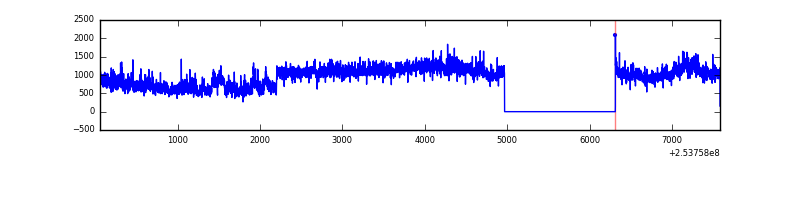 |
| B | 7524 | 6180 | 359 | 359 | 4.77% | 5.81% |  |
| C | 7525 | 6181 | 0 | 0 | 0.00% | 0.00% | 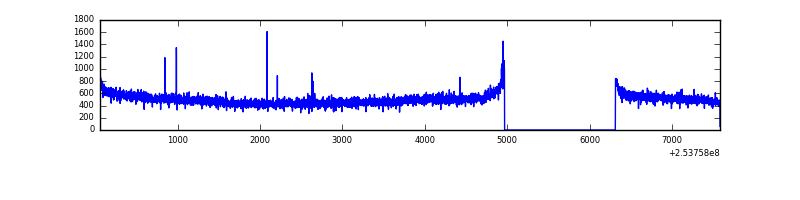 |
| D | 7526 | 6181 | 52 | 52 | 0.69% | 0.84% | 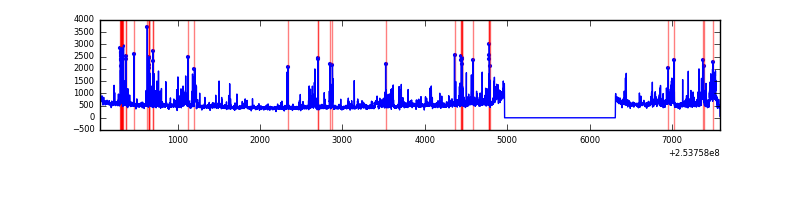 |
Top three noisy pixels from each quadrant. If the there are fewer than three noisy pixels in the level2.evt file, extra rows are filled as -1
| Pixel properties | Quadrant properties | ||||||
|---|---|---|---|---|---|---|---|
| Quadrant | DetID | PixID | Counts | Sigma | Mean | Median | Sigma |
| A | 0 | 23 | 2071182 | 12888.96 | 792 | 778 | 160.6 |
| A | 1 | 162 | 202318 | 1254.65 | 792 | 778 | 160.6 |
| A | 0 | 226 | 155599 | 963.81 | 792 | 778 | 160.6 |
| B | 4 | 239 | 1035604 | 7120.25 | 777 | 758 | 145.3 |
| B | 3 | 64 | 82986 | 565.77 | 777 | 758 | 145.3 |
| B | 0 | 187 | 38886 | 262.34 | 777 | 758 | 145.3 |
| C | 13 | 61 | 5804 | 27.76 | 785 | 793 | 180.5 |
| C | 12 | 4 | 4569 | 20.92 | 785 | 793 | 180.5 |
| C | 0 | 207 | 4060 | 18.1 | 785 | 793 | 180.5 |
| D | 1 | 52 | 343668 | 1878.95 | 765 | 748 | 182.5 |
| D | 13 | 104 | 176434 | 962.63 | 765 | 748 | 182.5 |
| D | 7 | 71 | 106909 | 581.68 | 765 | 748 | 182.5 |
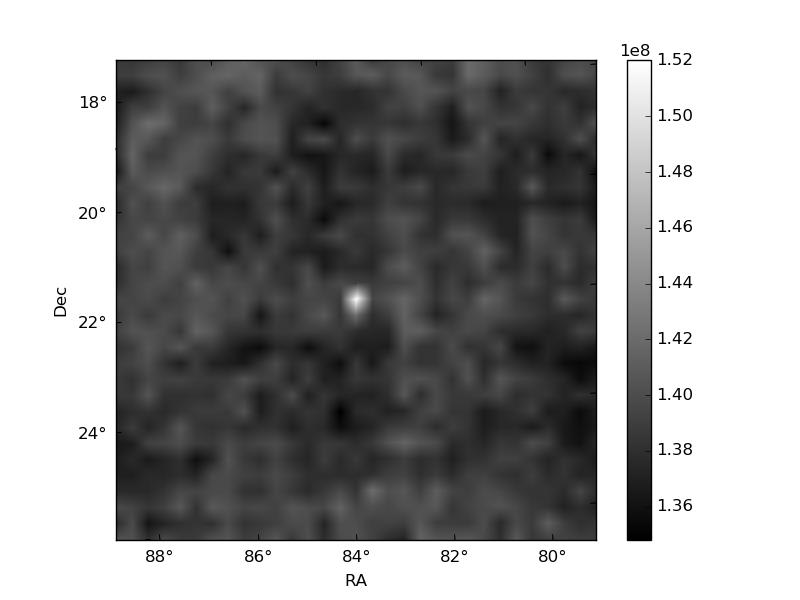
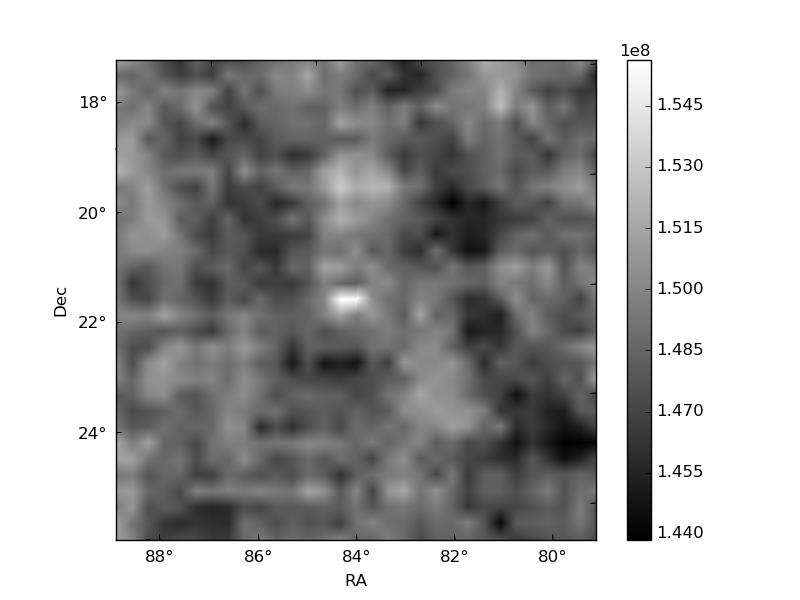
Histogram calculated using DETX and DETY for each event in the final _common_clean file
| Quadrant A | 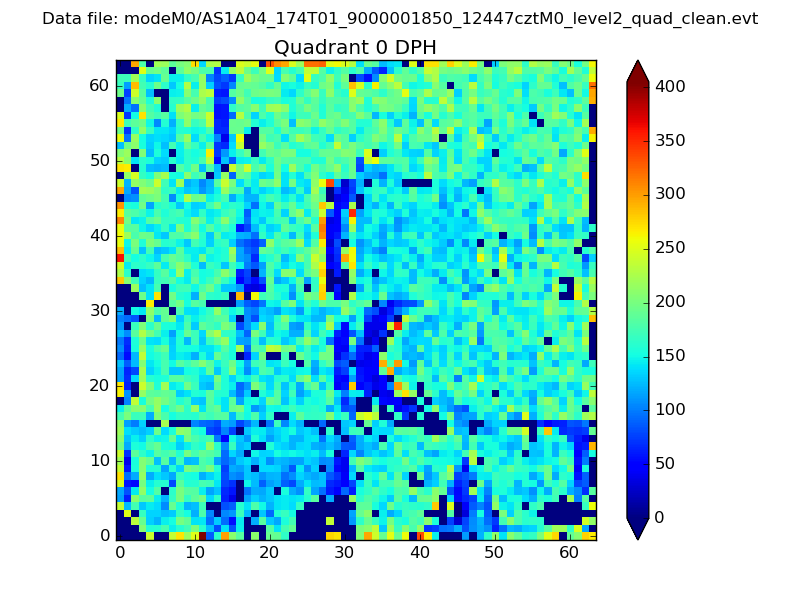 |
 |
Quadrant B |
|---|---|---|---|
| Quadrant D |  |
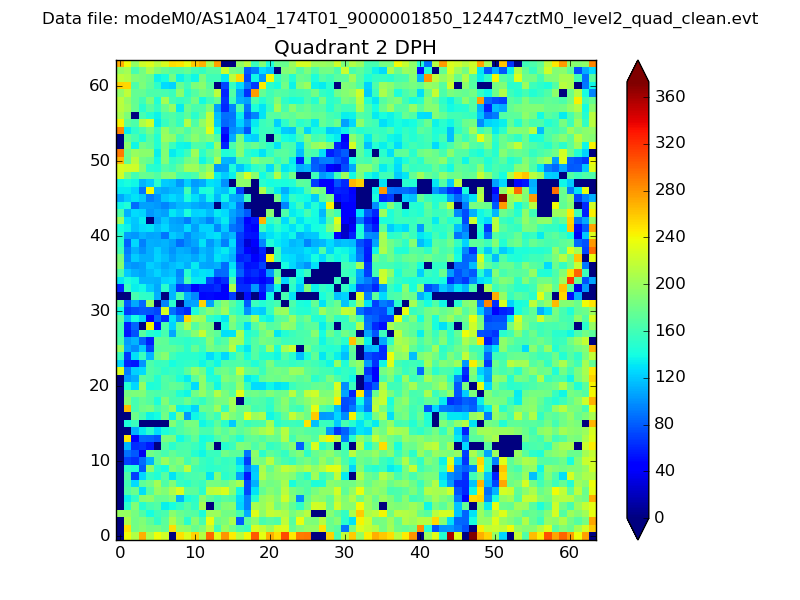 |
Quadrant C |
| Plot type | Count rate plots | Images |
|---|---|---|
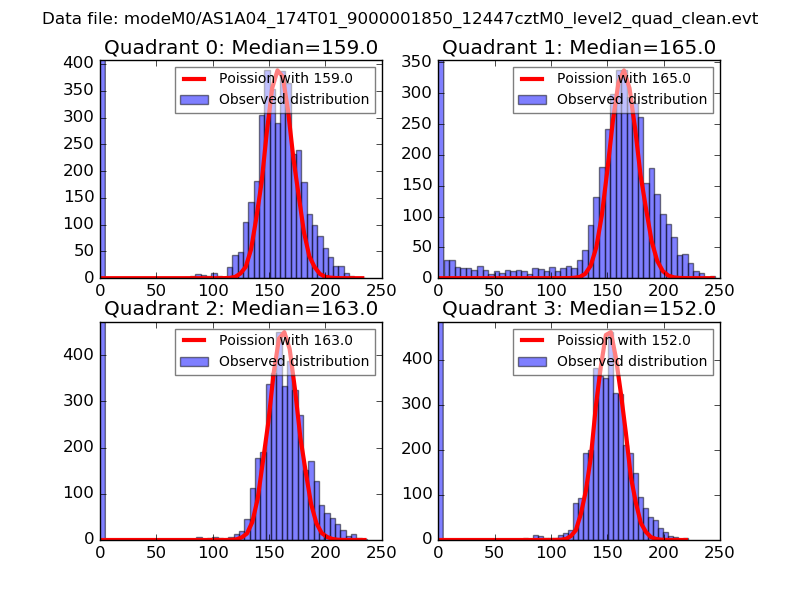
| Comparison with Poisson distribution Blue bars denote a histogram of data divided into 1 sec bins. Red curve is a Poisson curve with rate = median count rate of data. |
 |
 |
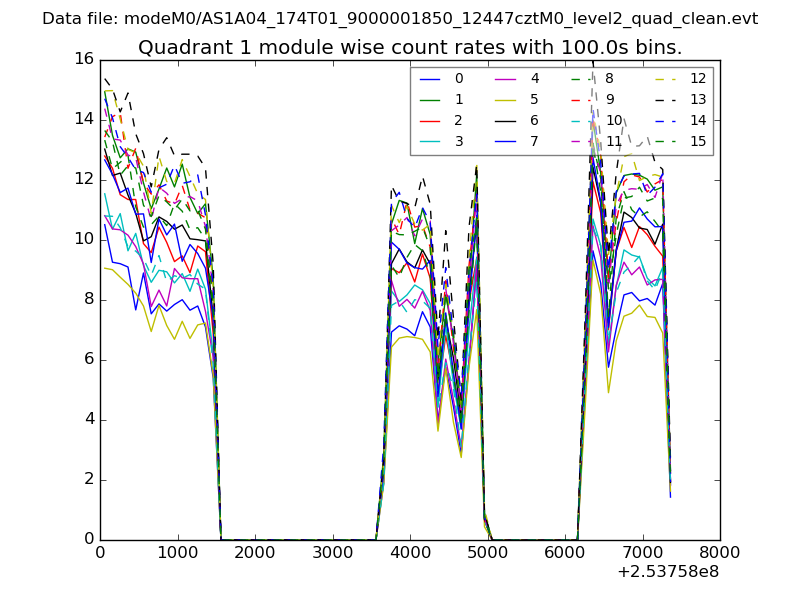
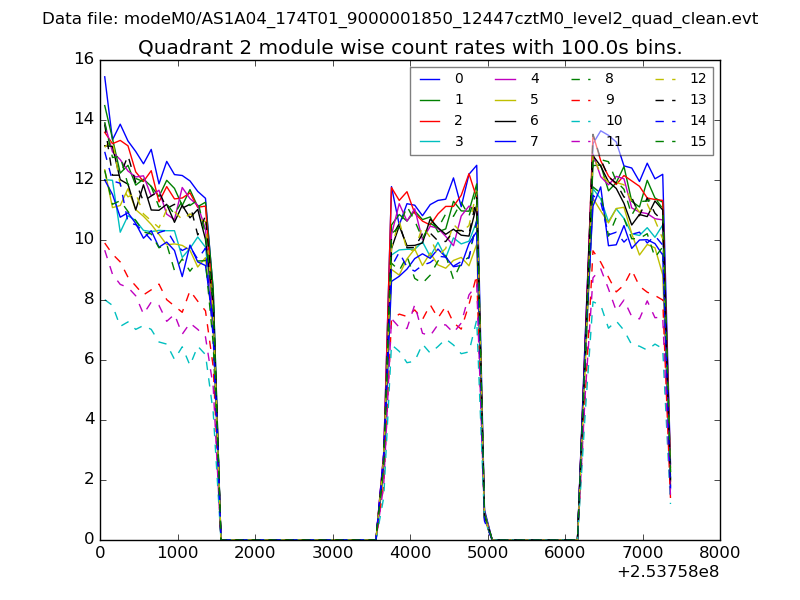
| Quadrant-wise count rates Data is divided into 100 sec bins |
 |
|
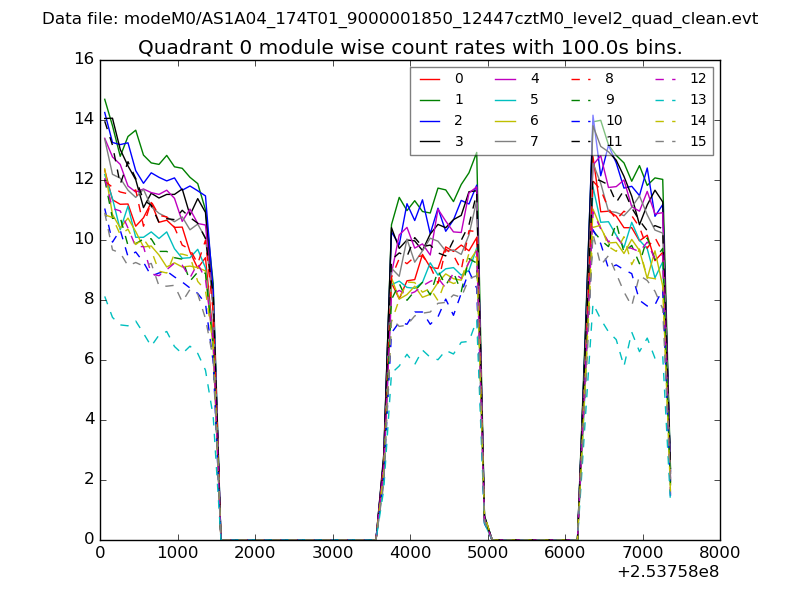
| Module-wise count rates for Quadrant A Data is divided into 100 sec bins |
 |
 |
| Module-wise count rates for Quadrant B Data is divided into 100 sec bins |
 |
 |
| Module-wise count rates for Quadrant C Data is divided into 100 sec bins |
 |
 |
| Module-wise count rates for Quadrant D Data is divided into 100 sec bins |
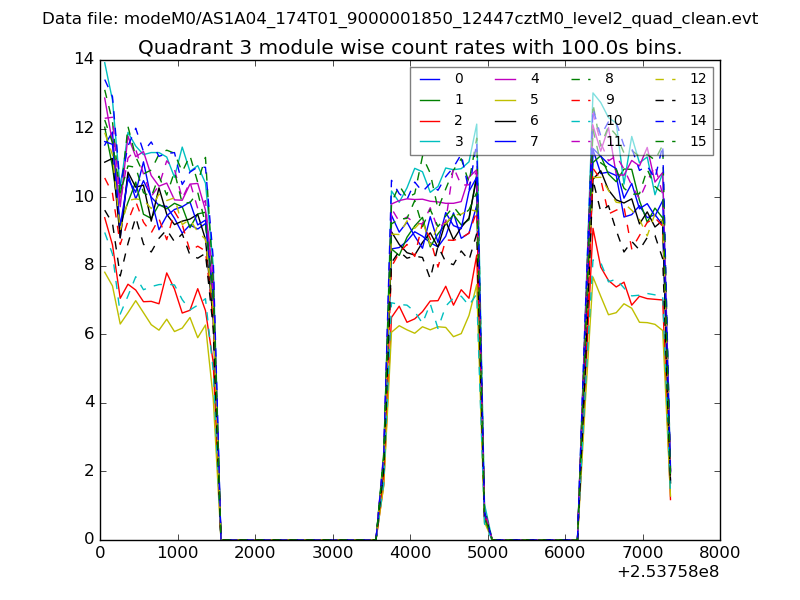 |
 |
| Parameter | Plot |
|---|---|
| CZT HV Monitor | 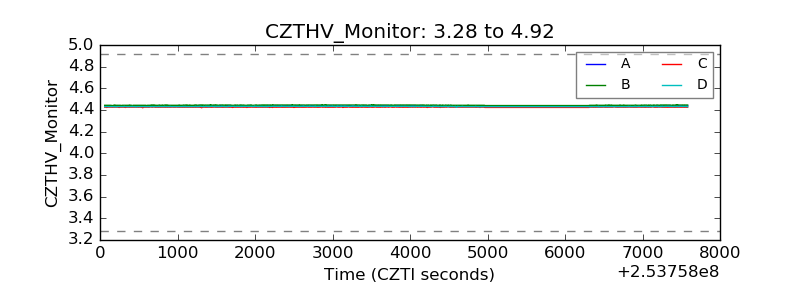 |
| D_VDD | 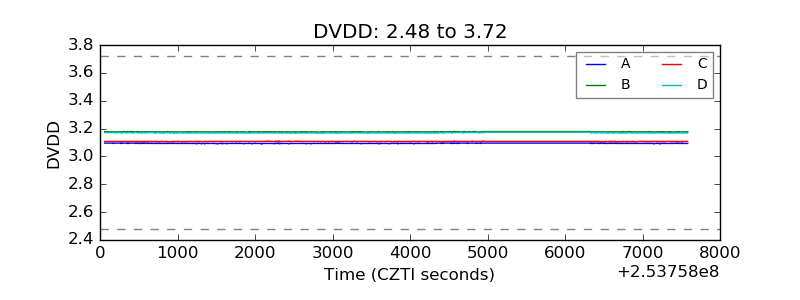 |
| Temperature 1 | 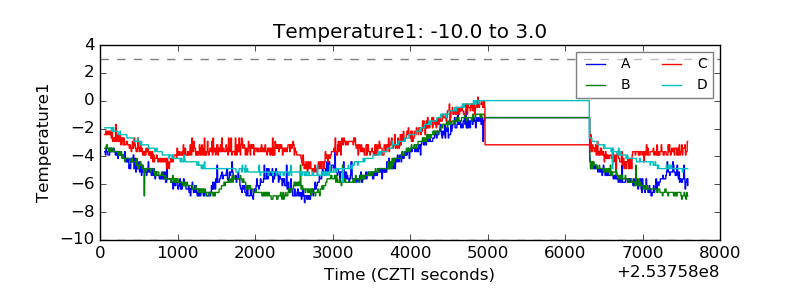 |
| Veto HV Monitor | 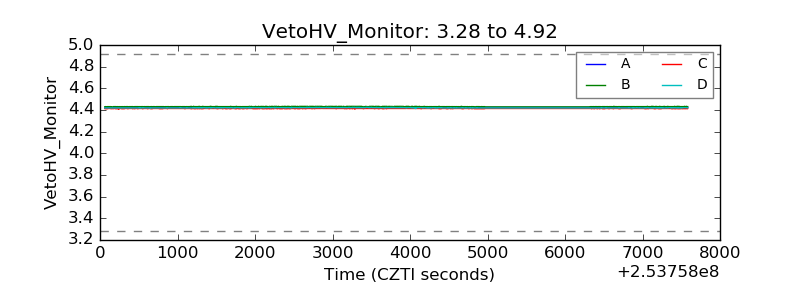 |
| Veto LLD | 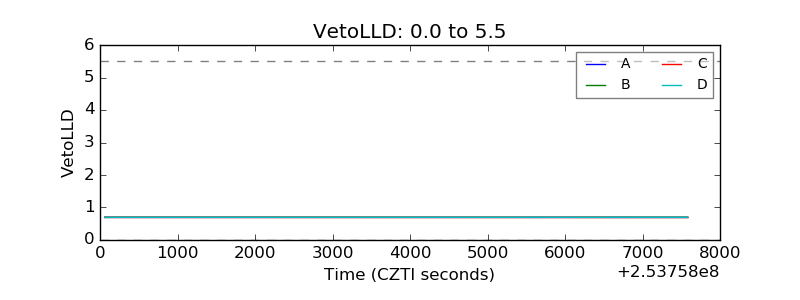 |
| Alpha Counter | 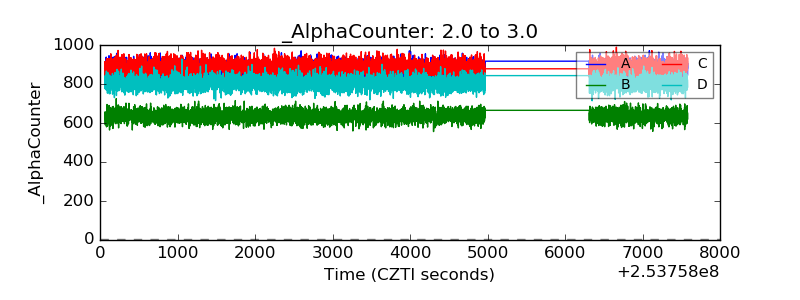 |
| _CPM_Rate | 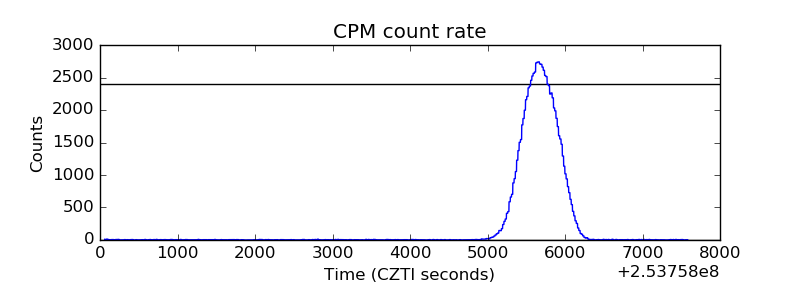 |
| CZT Counter | 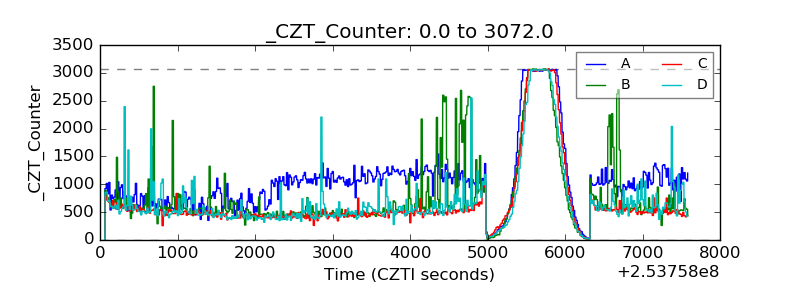 |
| +2.5 Volts monitor |  |
| +5 Volts monitor |  |
| _ROLL_ROT | 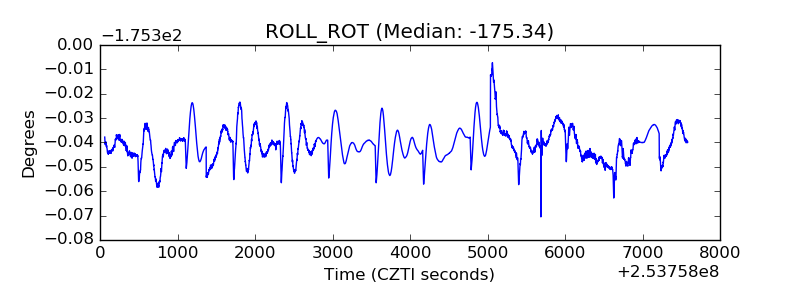 |
| _Roll_DEC | 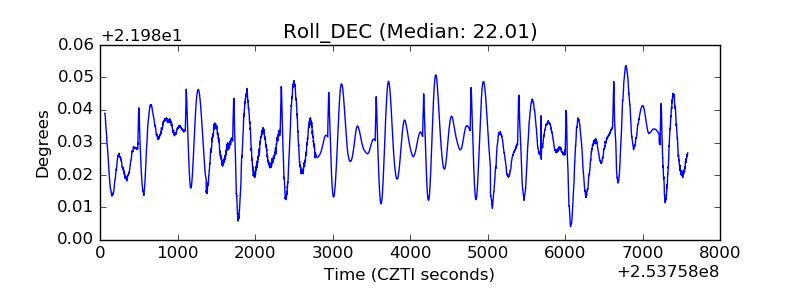 |
| _Roll_RA | 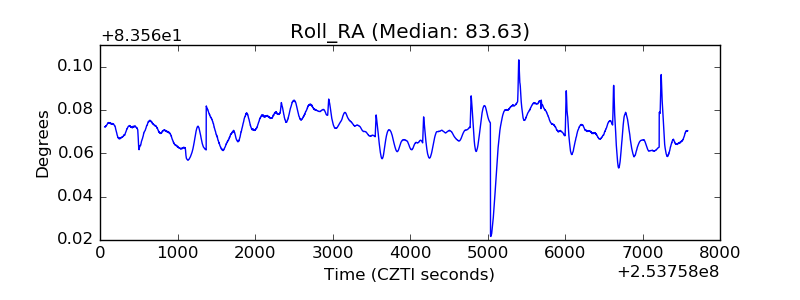 |
| Veto Counter | 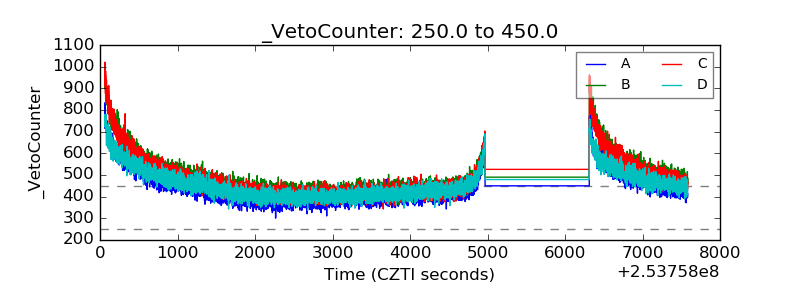 |