| Param | Original file | Final file |
|---|---|---|
| Filename | modeM0/AS1A04_174T01_9000001850_12449cztM0_level2.evt | modeM0/AS1A04_174T01_9000001850_12449cztM0_level2_quad_clean.evt |
| Size (bytes) | 533,157,120 | 69,716,160 |
| Size | 508.5 MB | 66.5 MB |
| Events in quadrant A | 4,624,719 | 422,143 |
| Events in quadrant B | 3,857,351 | 415,234 |
| Events in quadrant C | 3,036,266 | 428,921 |
| Events in quadrant D | 4,195,774 | 399,150 |
| Mode M0 | |||
|---|---|---|---|
| Quadrant | BADHDUFLAG | Total packets | Discarded packets |
| A | 0 | 18534 | 2 |
| B | 0 | 15433 | 1 |
| C | 0 | 13103 | 1 |
| D | 0 | 16765 | 1 |
| Mode M9 | |||
|---|---|---|---|
| Quadrant | BADHDUFLAG | Total packets | Discarded packets |
| A | 0 | 11 | 0 |
| B | 0 | 11 | 0 |
| C | 0 | 11 | 0 |
| D | 0 | 11 | 0 |
| Mode SS | |||
|---|---|---|---|
| Quadrant | BADHDUFLAG | Total packets | Discarded packets |
| A | 0 | 132 | 0 |
| B | 0 | 132 | 0 |
| C | 0 | 132 | 0 |
| D | 0 | 132 | 0 |
| Quadrant | Total seconds | Saturated seconds | Saturation percentage |
|---|---|---|---|
| A | 6375 | 83 | 1.301961% |
| B | 6375 | 307 | 4.815686% |
| C | 6375 | 17 | 0.266667% |
| D | 6375 | 191 | 2.996078% |
Noise dominated data is calculated using 1-second bins in cleaned event files. If a bin has >2000 counts, and if more than 50% of those come from <1% of pixels, then it is considered to be noise-dominated and hence unusable.
| Quadrant | # 1 sec bins | Bins with >0 counts | Bins with >2000 counts | High rate bins dominated by noise | Noise dominated (total time) | Noise dominated (detector-on time) | Marked lightcurve |
|---|---|---|---|---|---|---|---|
| A | 7556 | 6376 | 1 | 1 | 0.01% | 0.02% | 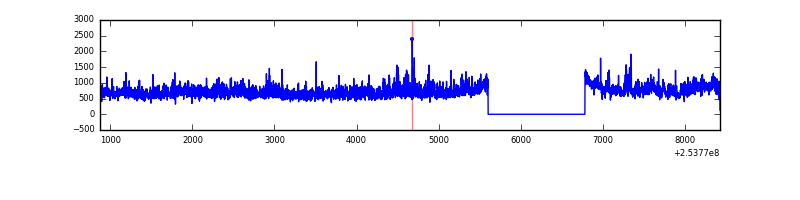 |
| B | 7556 | 6377 | 212 | 212 | 2.81% | 3.32% | 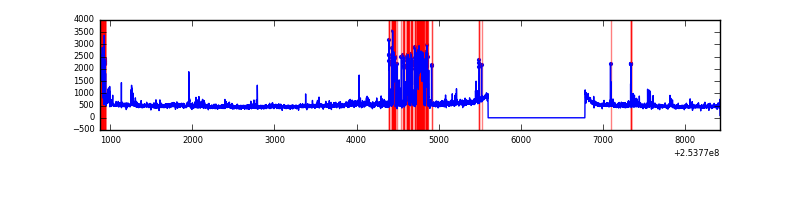 |
| C | 7556 | 6377 | 0 | 0 | 0.00% | 0.00% | 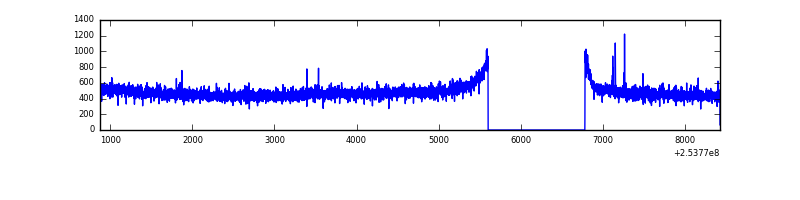 |
| D | 7556 | 6377 | 170 | 170 | 2.25% | 2.67% | 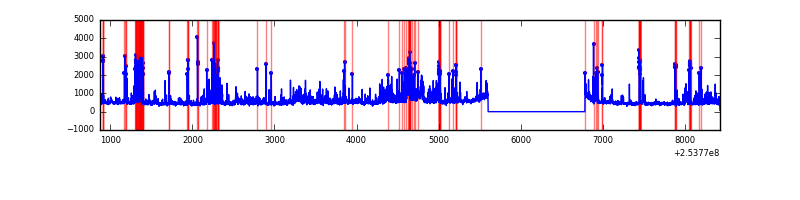 |
Top three noisy pixels from each quadrant. If the there are fewer than three noisy pixels in the level2.evt file, extra rows are filled as -1
| Pixel properties | Quadrant properties | ||||||
|---|---|---|---|---|---|---|---|
| Quadrant | DetID | PixID | Counts | Sigma | Mean | Median | Sigma |
| A | 0 | 23 | 465114 | 2891.53 | 790 | 775 | 160.6 |
| A | 13 | 251 | 374871 | 2329.57 | 790 | 775 | 160.6 |
| A | 1 | 162 | 239340 | 1485.59 | 790 | 775 | 160.6 |
| B | 4 | 239 | 615814 | 4115.58 | 787 | 772 | 149.4 |
| B | 11 | 51 | 58583 | 386.84 | 787 | 772 | 149.4 |
| B | 0 | 187 | 46952 | 309.02 | 787 | 772 | 149.4 |
| C | 15 | 208 | 9049 | 45.96 | 776 | 784 | 179.8 |
| C | 13 | 61 | 5746 | 27.59 | 776 | 784 | 179.8 |
| C | 3 | 202 | 1872 | 6.05 | 776 | 784 | 179.8 |
| D | 1 | 52 | 994019 | 5475.52 | 753 | 731 | 181.4 |
| D | 13 | 104 | 205070 | 1126.42 | 753 | 731 | 181.4 |
| D | 5 | 184 | 55278 | 300.69 | 753 | 731 | 181.4 |
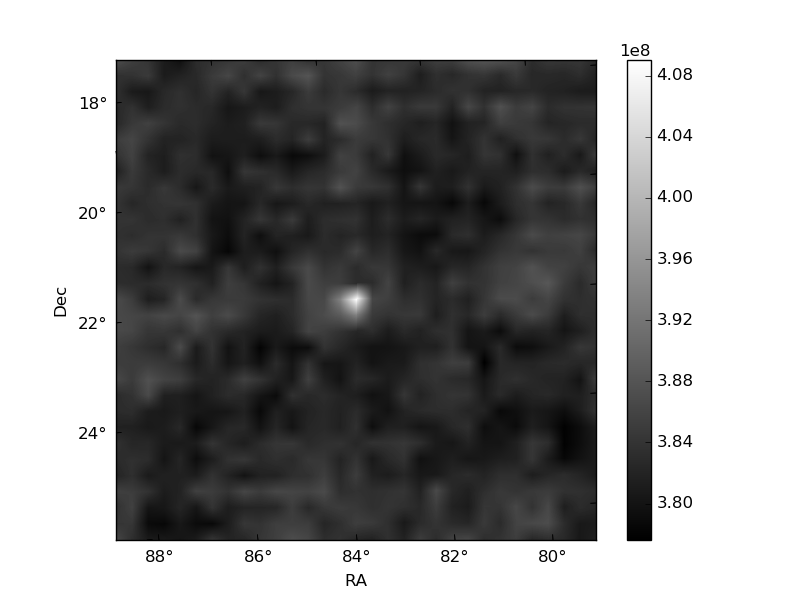
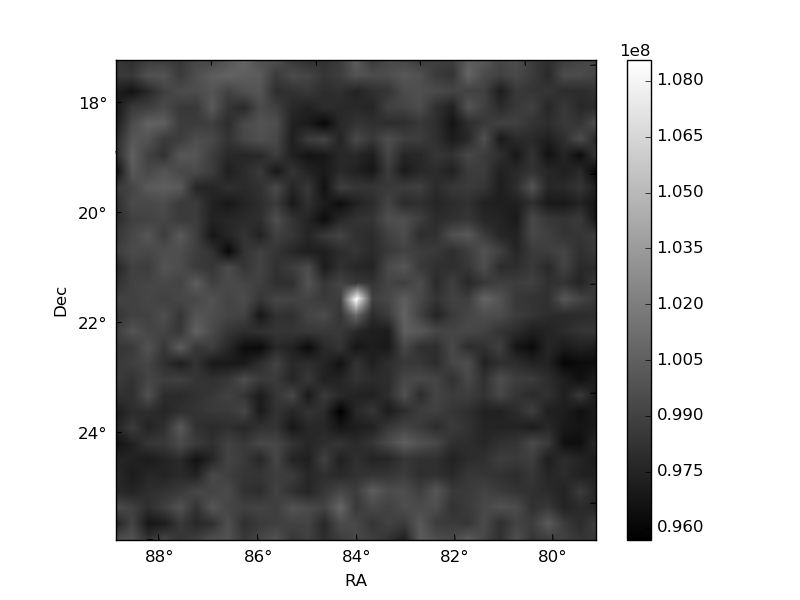
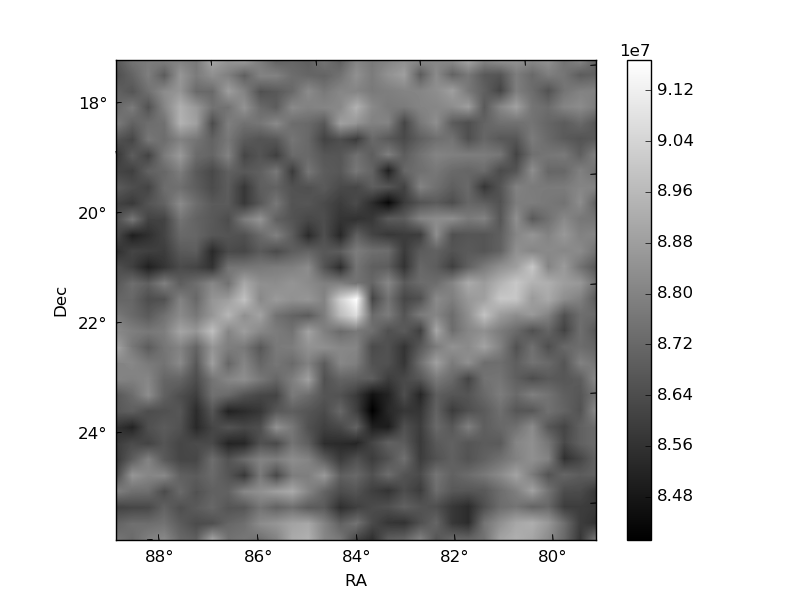
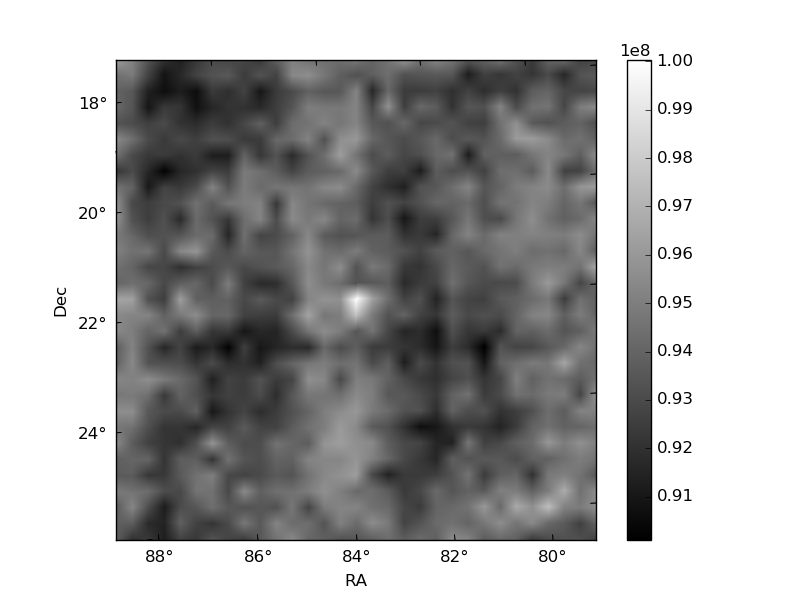
Histogram calculated using DETX and DETY for each event in the final _common_clean file
| Quadrant A | 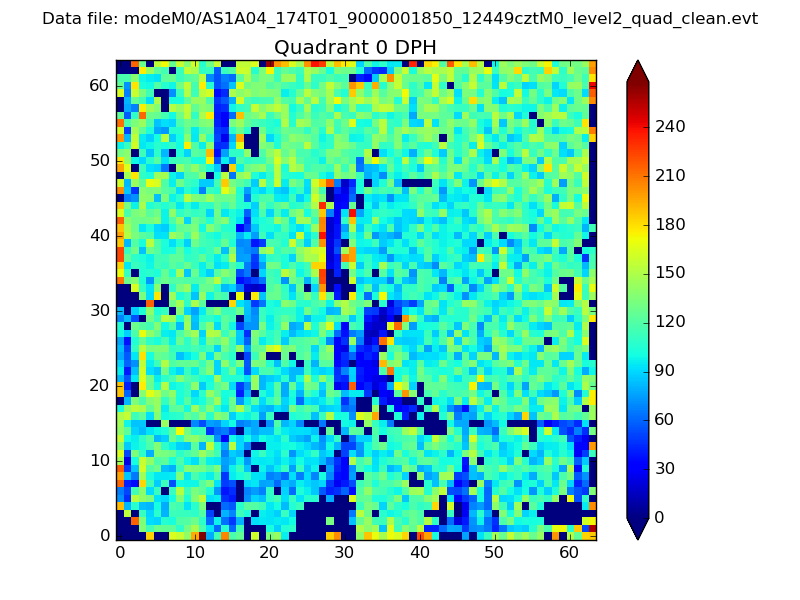 |
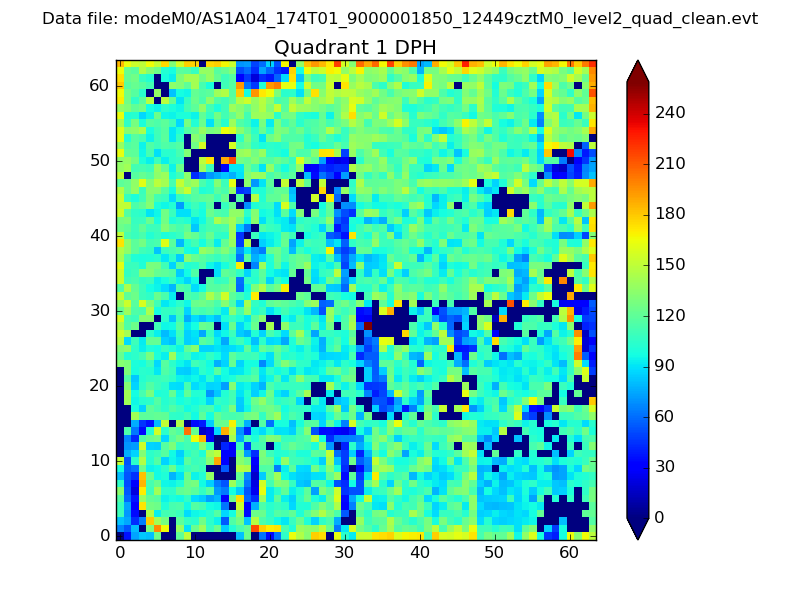 |
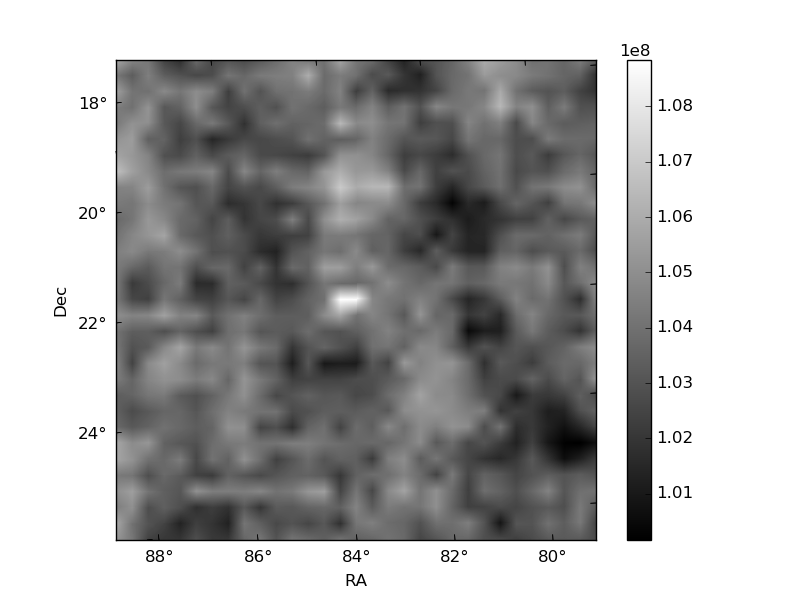
Quadrant B |
|---|---|---|---|
| Quadrant D | 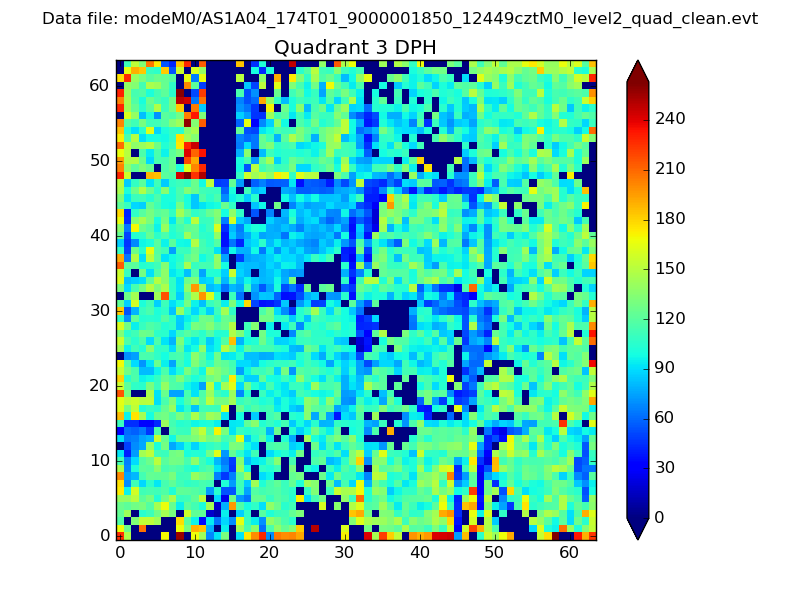 |
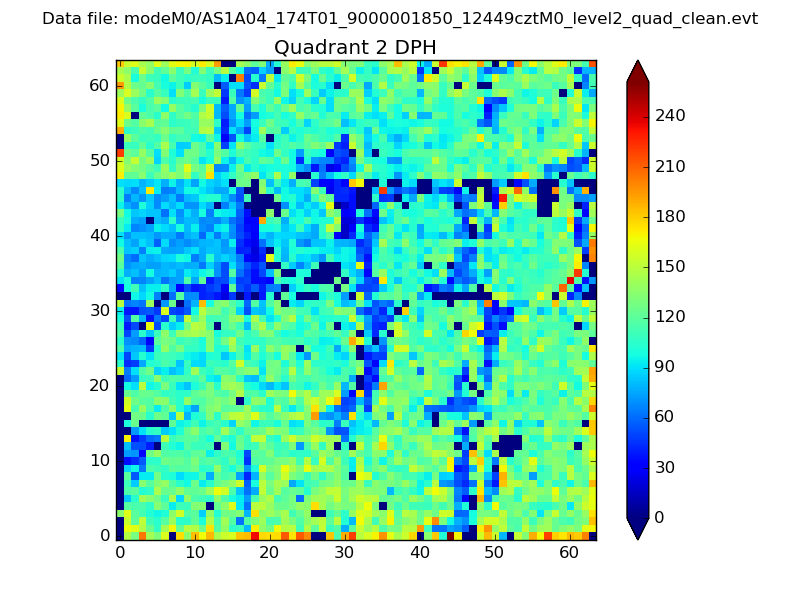 |
Quadrant C |
| Plot type | Count rate plots | Images |
|---|---|---|
| Comparison with Poisson distribution Blue bars denote a histogram of data divided into 1 sec bins. Red curve is a Poisson curve with rate = median count rate of data. |
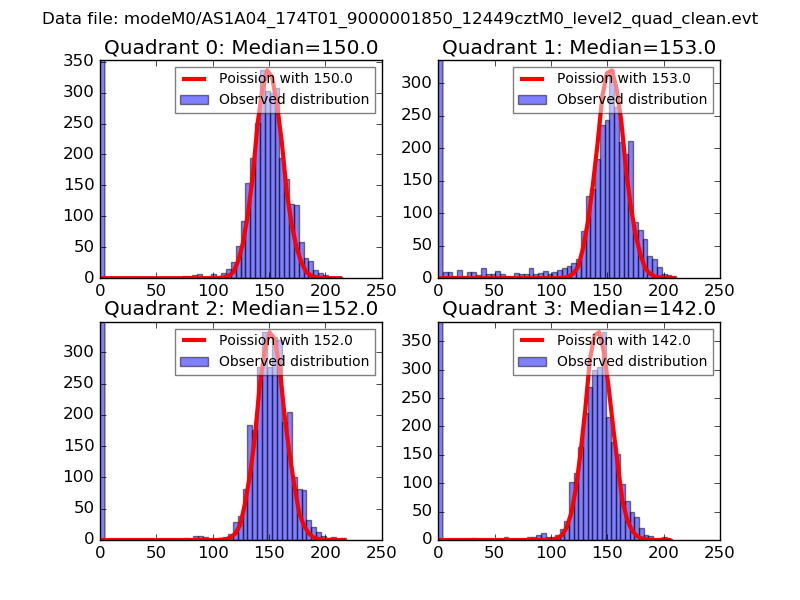 |
 |
| Quadrant-wise count rates Data is divided into 100 sec bins |
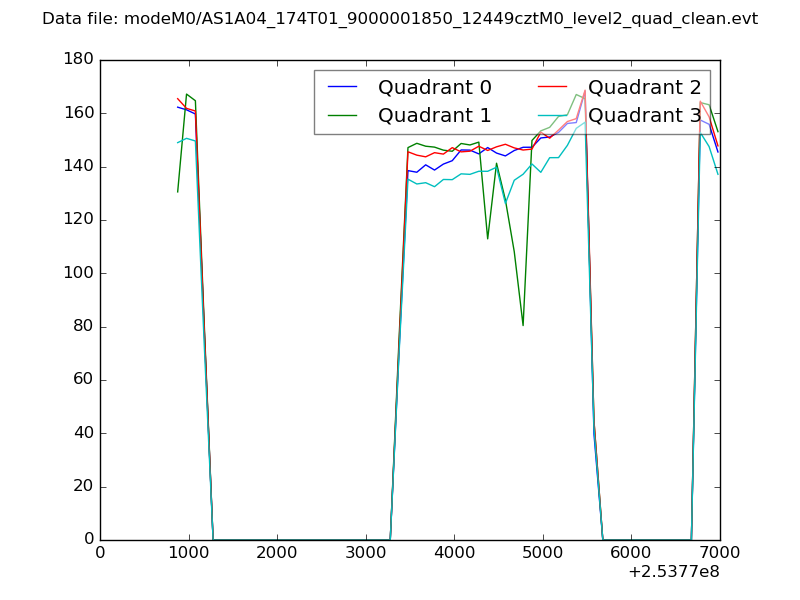 |
|
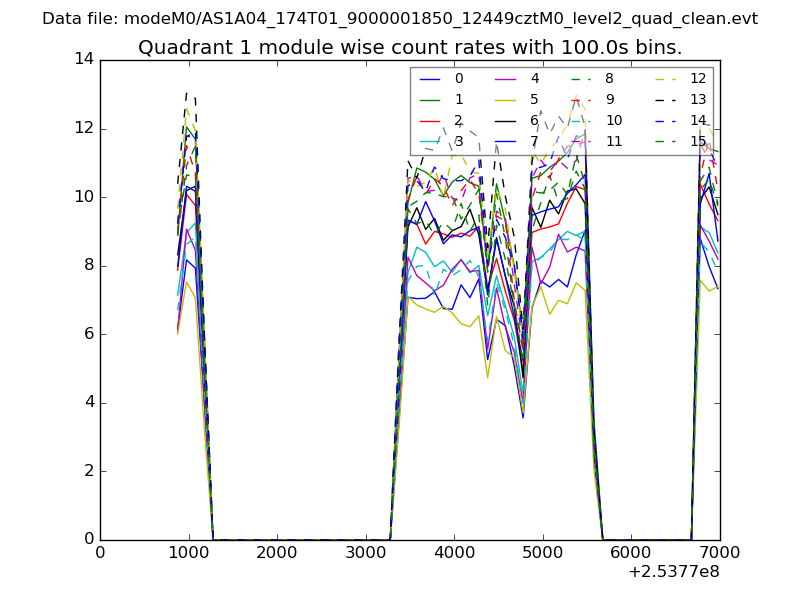
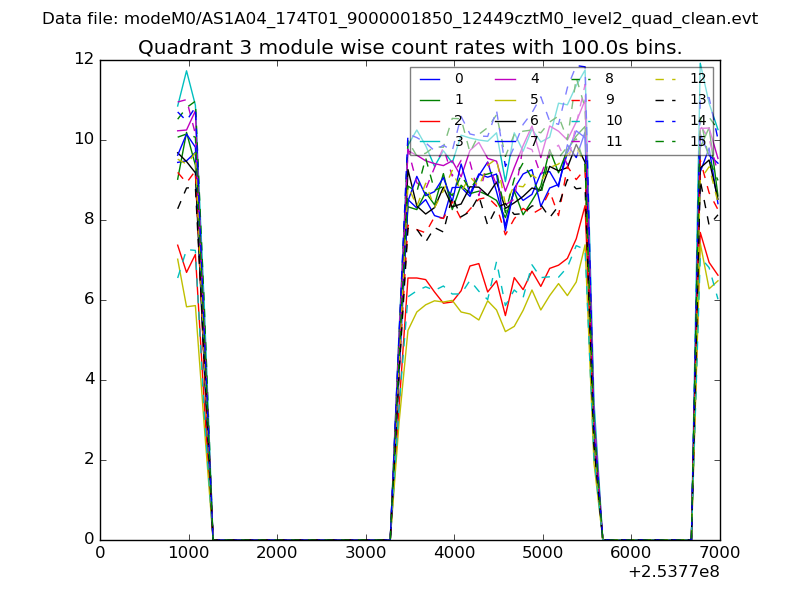
| Module-wise count rates for Quadrant A Data is divided into 100 sec bins |
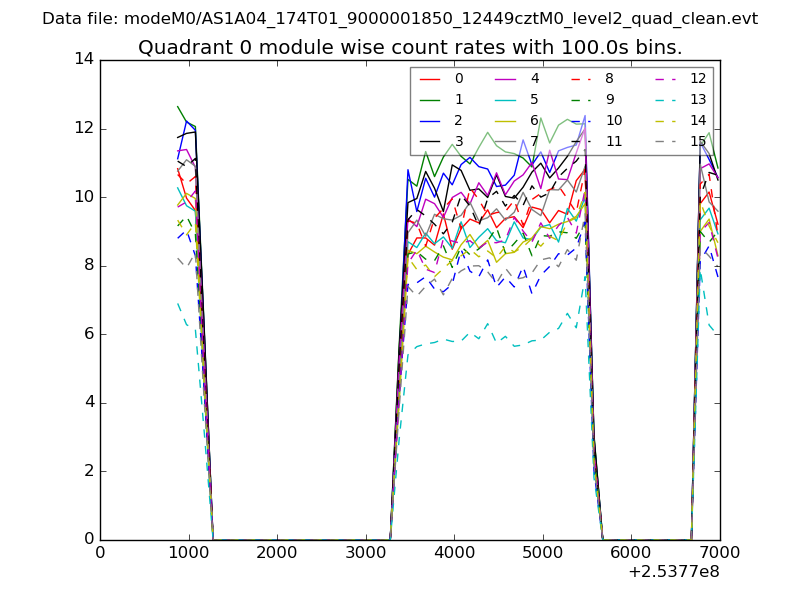 |
 |
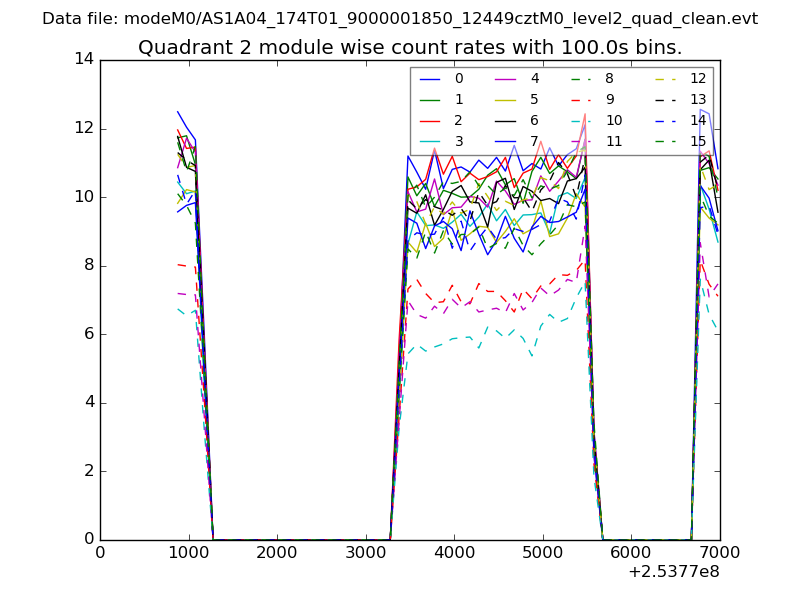
| Module-wise count rates for Quadrant B Data is divided into 100 sec bins |
 |
 |
| Module-wise count rates for Quadrant C Data is divided into 100 sec bins |
 |
 |
| Module-wise count rates for Quadrant D Data is divided into 100 sec bins |
 |
 |
| Parameter | Plot |
|---|---|
| CZT HV Monitor | 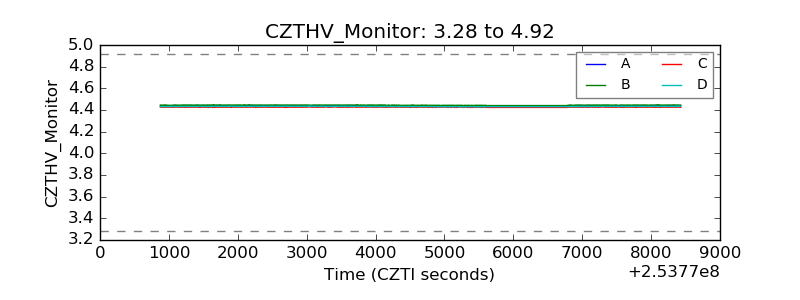 |
| D_VDD | 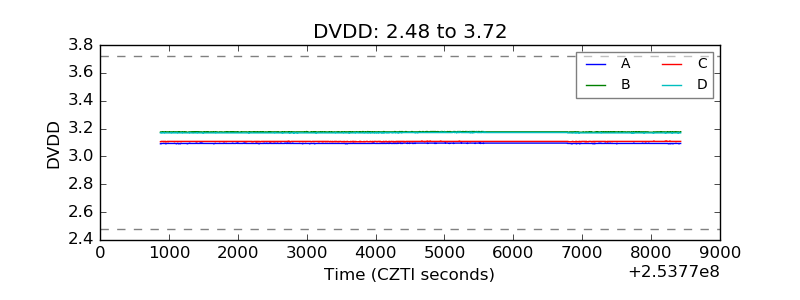 |
| Temperature 1 | 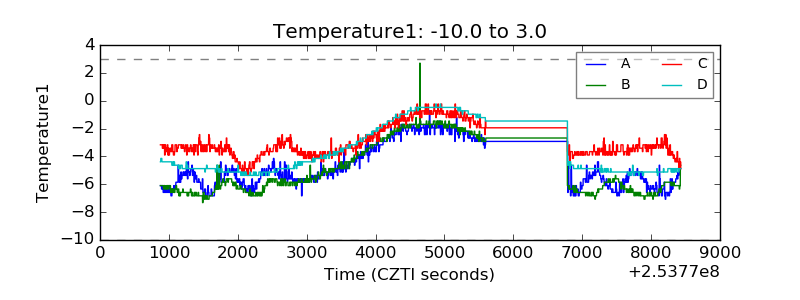 |
| Veto HV Monitor | 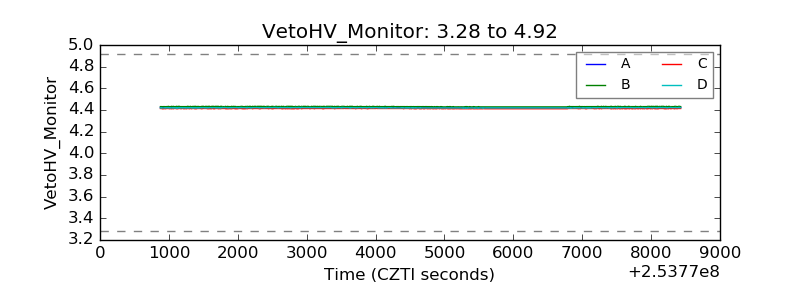 |
| Veto LLD | 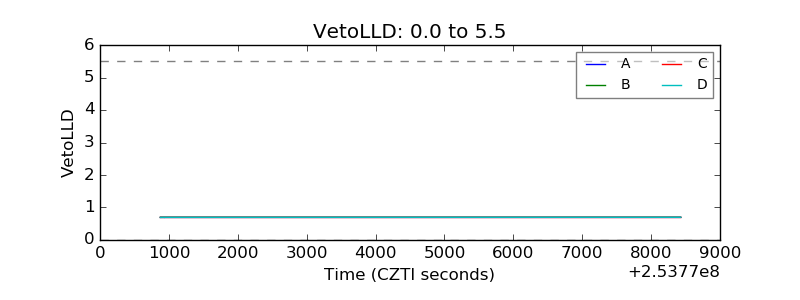 |
| Alpha Counter | 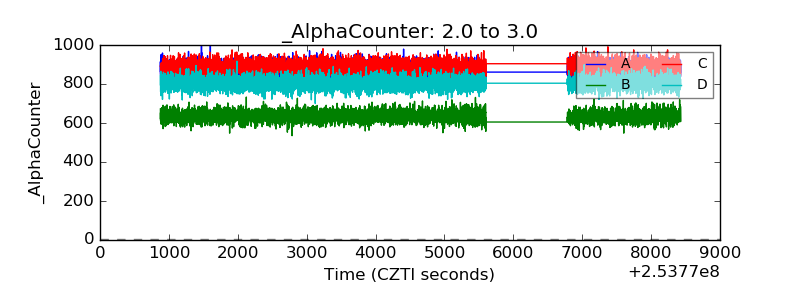 |
| _CPM_Rate | 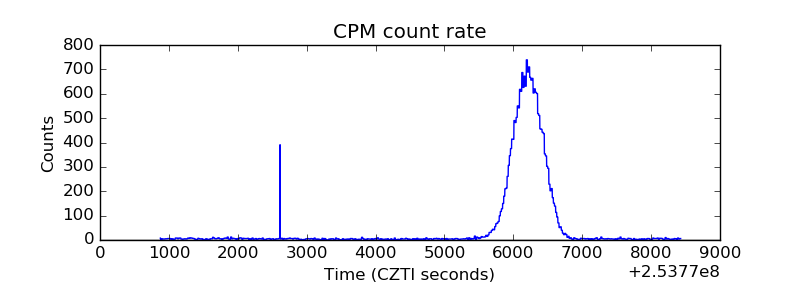 |
| CZT Counter | 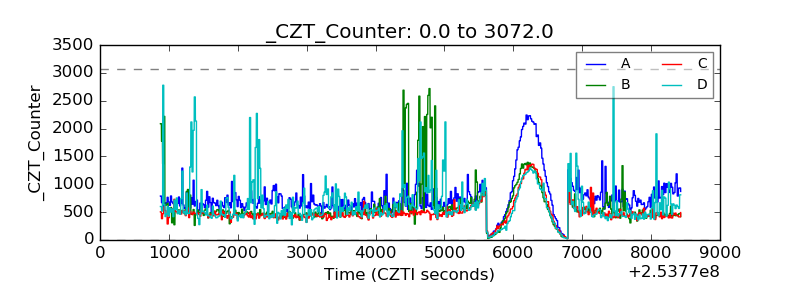 |
| +2.5 Volts monitor |  |
| +5 Volts monitor |  |
| _ROLL_ROT | 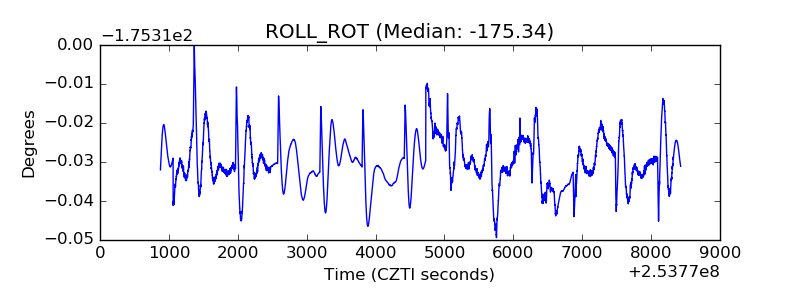 |
| _Roll_DEC | 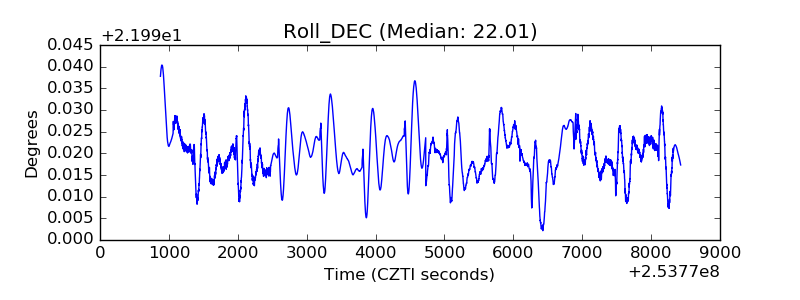 |
| _Roll_RA | 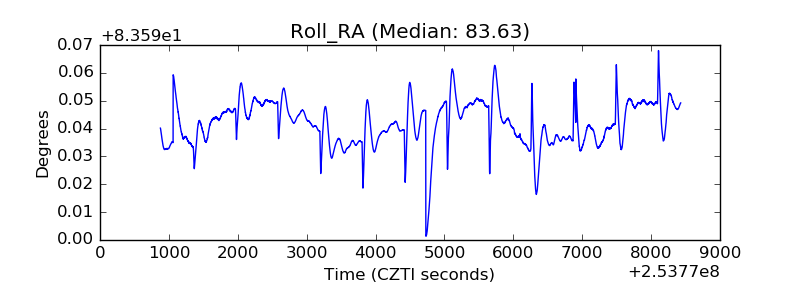 |
| Veto Counter | 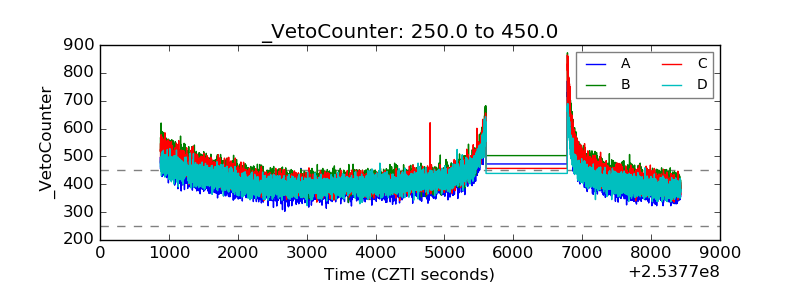 |