| Param | Original file | Final file |
|---|---|---|
| Filename | modeM0/AS1A04_174T01_9000001850_12450cztM0_level2.evt | modeM0/AS1A04_174T01_9000001850_12450cztM0_level2_quad_clean.evt |
| Size (bytes) | 574,243,200 | 66,101,760 |
| Size | 547.6 MB | 63.0 MB |
| Events in quadrant A | 5,390,064 | 407,931 |
| Events in quadrant B | 4,265,089 | 364,066 |
| Events in quadrant C | 3,067,989 | 413,402 |
| Events in quadrant D | 4,223,447 | 358,099 |
| Mode M0 | |||
|---|---|---|---|
| Quadrant | BADHDUFLAG | Total packets | Discarded packets |
| A | 0 | 20899 | 2 |
| B | 0 | 16814 | 1 |
| C | 0 | 13430 | 1 |
| D | 0 | 17024 | 1 |
| Mode M9 | |||
|---|---|---|---|
| Quadrant | BADHDUFLAG | Total packets | Discarded packets |
| A | 0 | 9 | 0 |
| B | 0 | 9 | 0 |
| C | 0 | 9 | 0 |
| D | 0 | 9 | 0 |
| Mode SS | |||
|---|---|---|---|
| Quadrant | BADHDUFLAG | Total packets | Discarded packets |
| A | 0 | 134 | 0 |
| B | 0 | 134 | 0 |
| C | 0 | 134 | 0 |
| D | 0 | 134 | 0 |
| Quadrant | Total seconds | Saturated seconds | Saturation percentage |
|---|---|---|---|
| A | 6556 | 88 | 1.342282% |
| B | 6556 | 551 | 8.404515% |
| C | 6556 | 11 | 0.167785% |
| D | 6556 | 471 | 7.184259% |
Noise dominated data is calculated using 1-second bins in cleaned event files. If a bin has >2000 counts, and if more than 50% of those come from <1% of pixels, then it is considered to be noise-dominated and hence unusable.
| Quadrant | # 1 sec bins | Bins with >0 counts | Bins with >2000 counts | High rate bins dominated by noise | Noise dominated (total time) | Noise dominated (detector-on time) | Marked lightcurve |
|---|---|---|---|---|---|---|---|
| A | 7472 | 6558 | 12 | 12 | 0.16% | 0.18% | 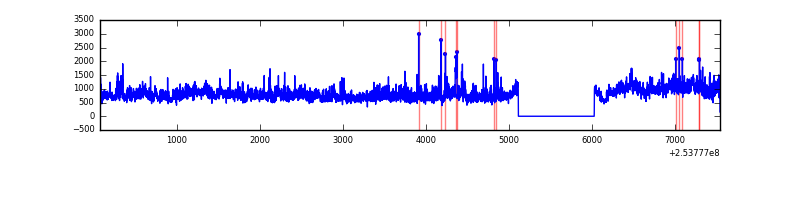 |
| B | 7472 | 6558 | 336 | 336 | 4.50% | 5.12% | 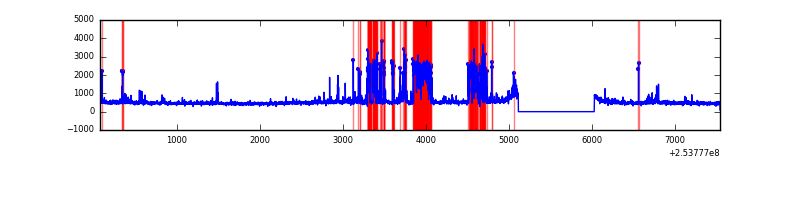 |
| C | 7472 | 6558 | 1 | 1 | 0.01% | 0.02% | 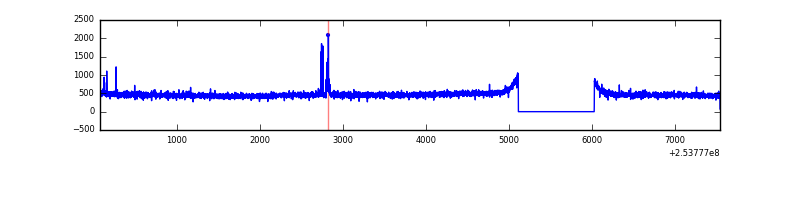 |
| D | 7472 | 6558 | 395 | 395 | 5.29% | 6.02% | 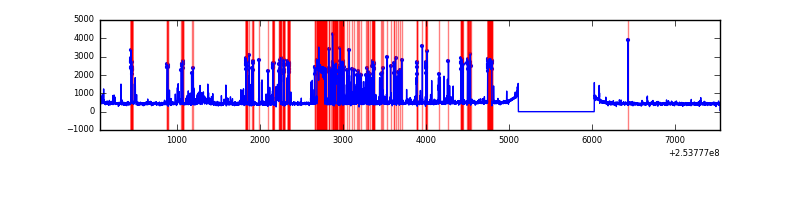 |
Top three noisy pixels from each quadrant. If the there are fewer than three noisy pixels in the level2.evt file, extra rows are filled as -1
| Pixel properties | Quadrant properties | ||||||
|---|---|---|---|---|---|---|---|
| Quadrant | DetID | PixID | Counts | Sigma | Mean | Median | Sigma |
| A | 0 | 23 | 1007815 | 6184.72 | 792 | 778 | 162.8 |
| A | 13 | 251 | 615578 | 3775.8 | 792 | 778 | 162.8 |
| A | 1 | 162 | 232507 | 1423.16 | 792 | 778 | 162.8 |
| B | 4 | 239 | 1126242 | 7691.92 | 762 | 746 | 146.3 |
| B | 11 | 51 | 68995 | 466.43 | 762 | 746 | 146.3 |
| B | 0 | 187 | 60624 | 409.22 | 762 | 746 | 146.3 |
| C | 15 | 208 | 33897 | 183.09 | 778 | 785 | 180.9 |
| C | 13 | 61 | 5716 | 27.27 | 778 | 785 | 180.9 |
| C | 3 | 202 | 1922 | 6.29 | 778 | 785 | 180.9 |
| D | 1 | 52 | 1176658 | 6650.21 | 738 | 720 | 176.8 |
| D | 13 | 104 | 151260 | 851.34 | 738 | 720 | 176.8 |
| D | 5 | 184 | 56098 | 313.17 | 738 | 720 | 176.8 |
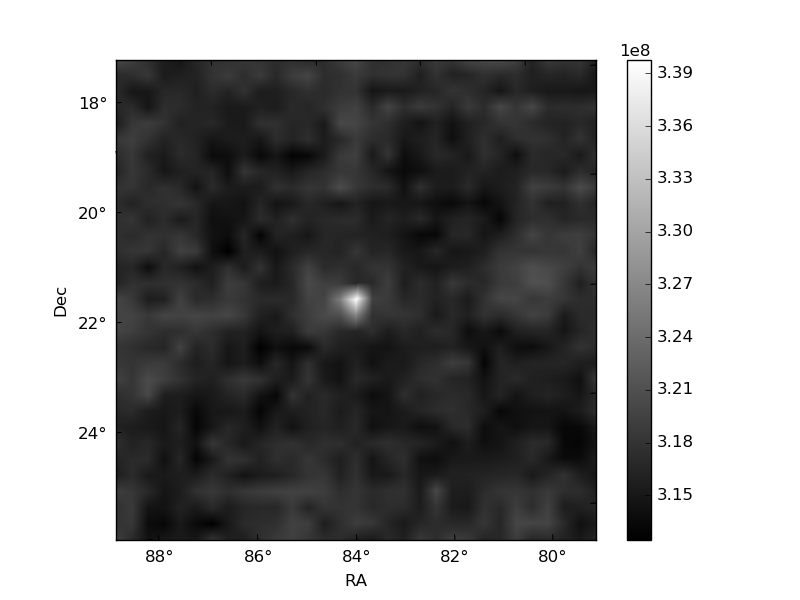
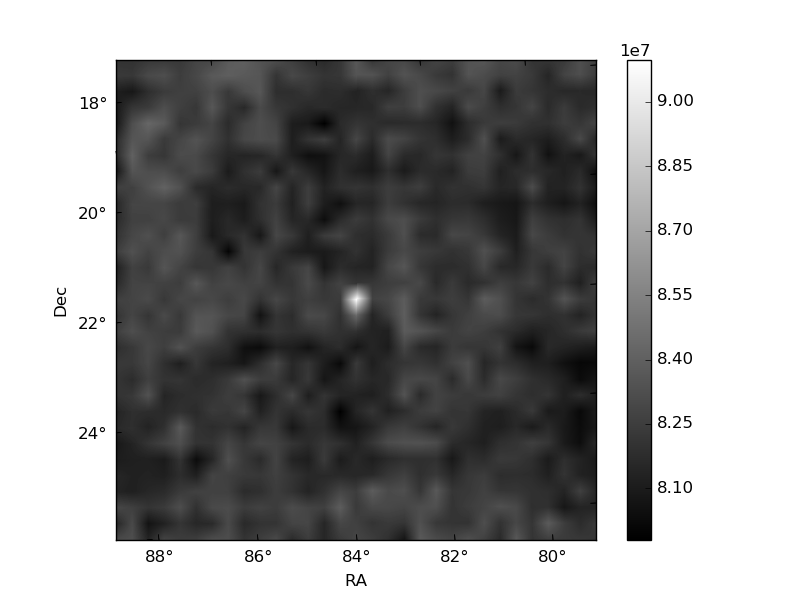
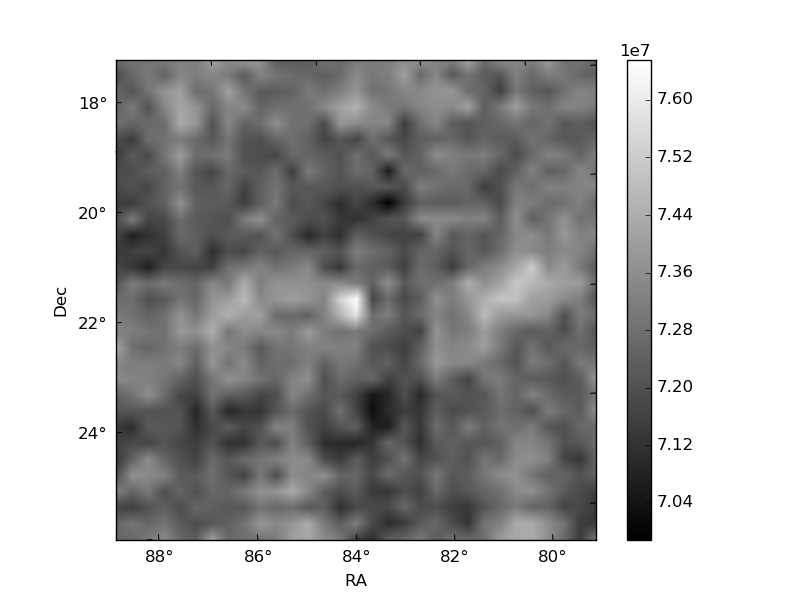
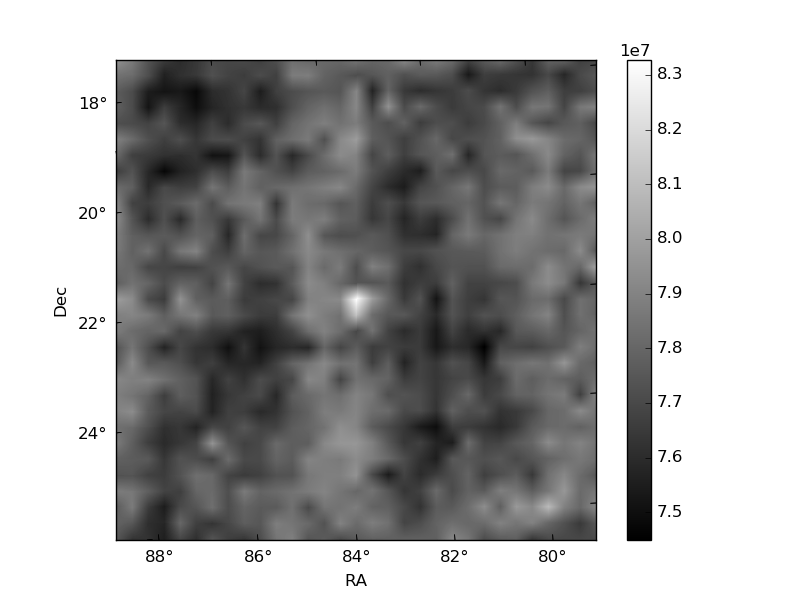
Histogram calculated using DETX and DETY for each event in the final _common_clean file
| Quadrant A | 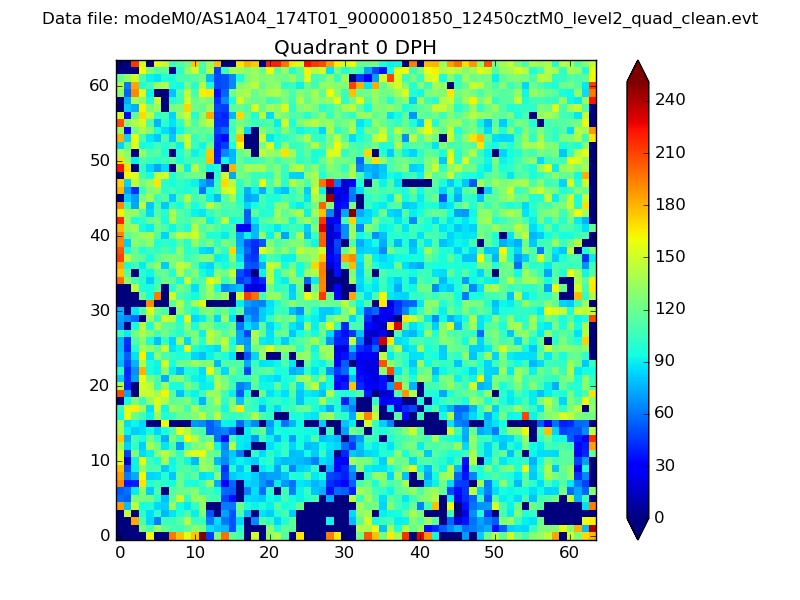 |
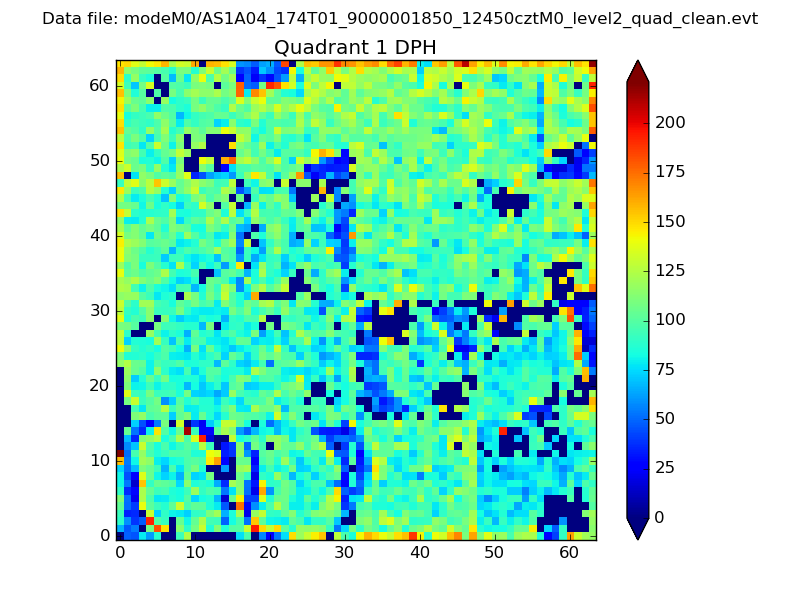 |
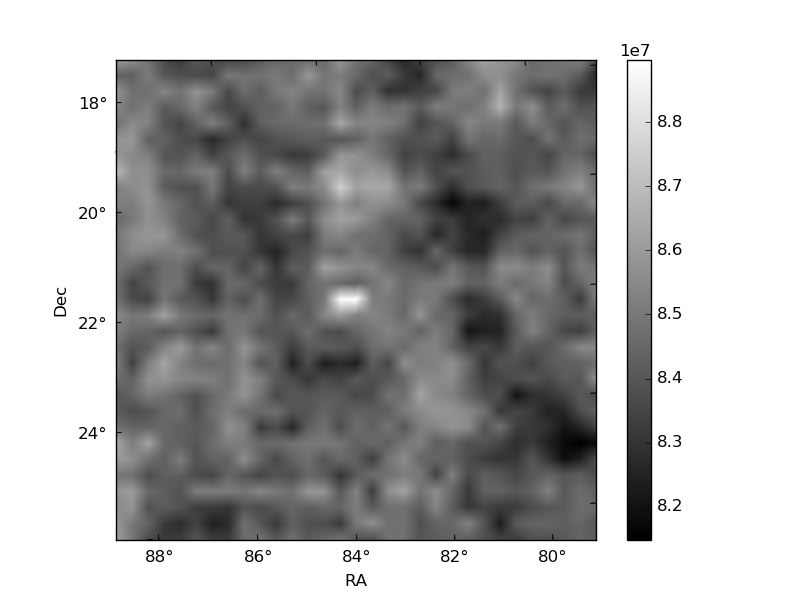
Quadrant B |
|---|---|---|---|
| Quadrant D | 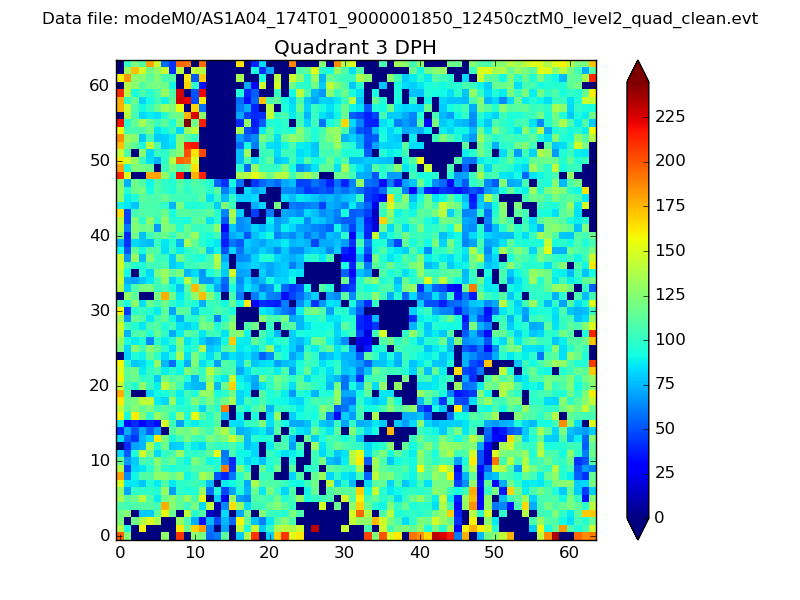 |
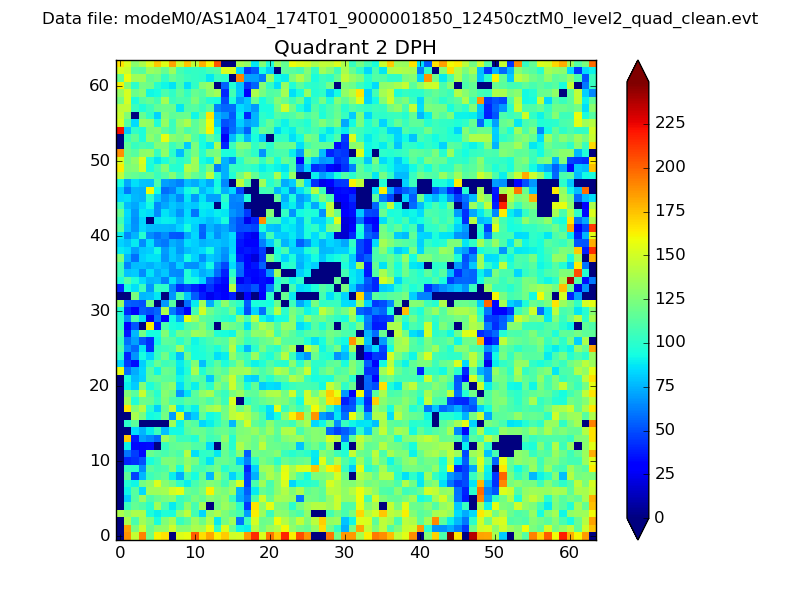 |
Quadrant C |
| Plot type | Count rate plots | Images |
|---|---|---|
| Comparison with Poisson distribution Blue bars denote a histogram of data divided into 1 sec bins. Red curve is a Poisson curve with rate = median count rate of data. |
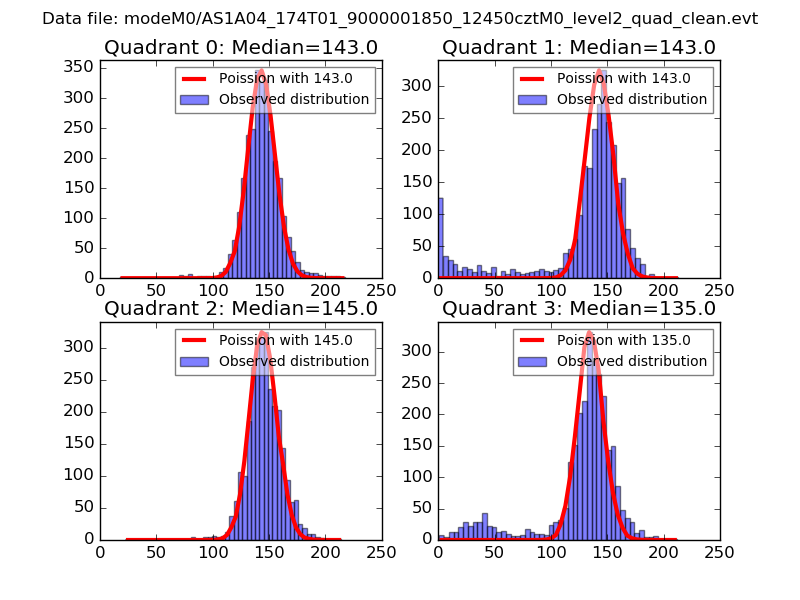 |
 |
| Quadrant-wise count rates Data is divided into 100 sec bins |
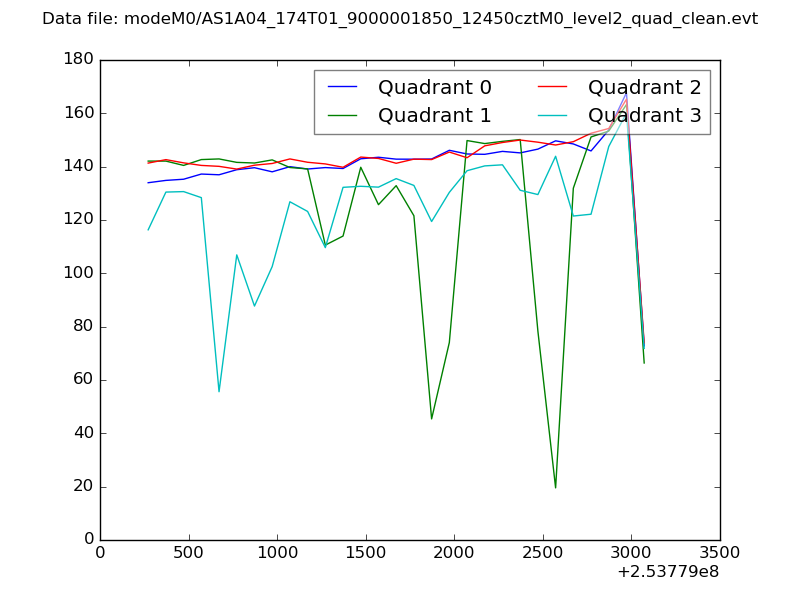 |
|
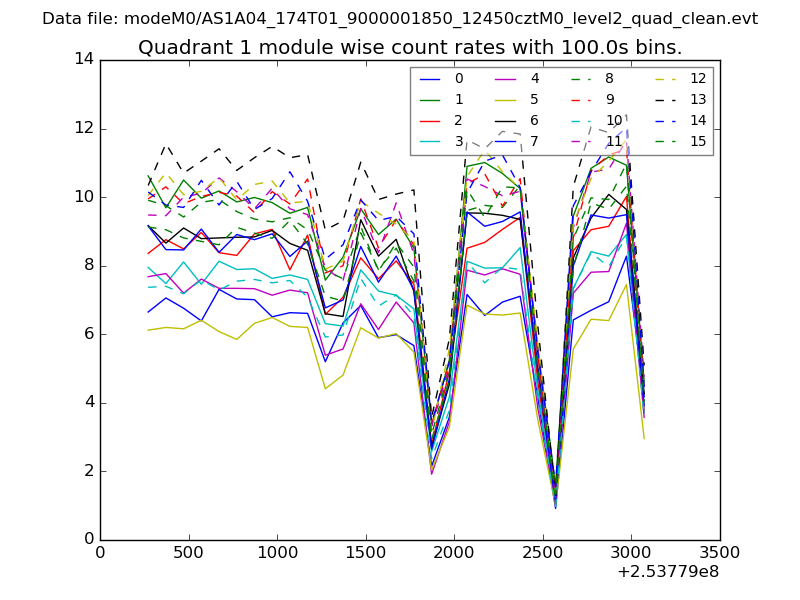
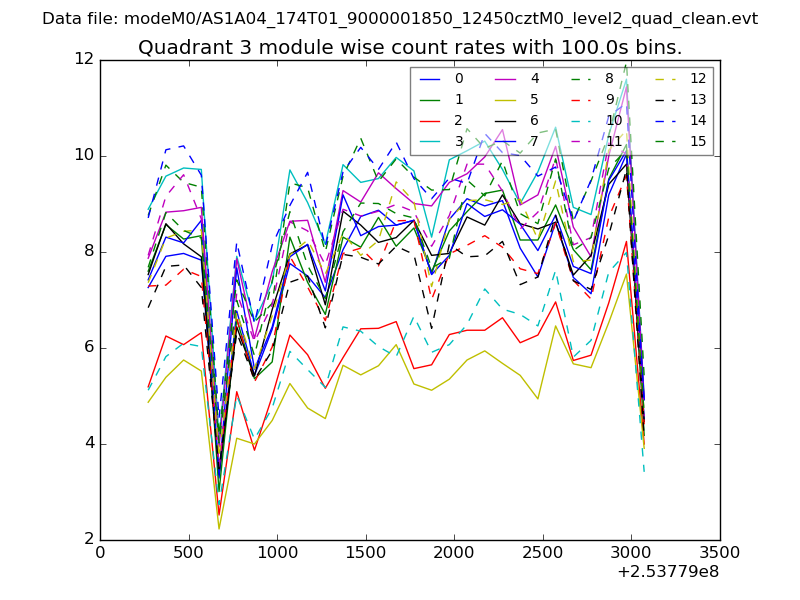
| Module-wise count rates for Quadrant A Data is divided into 100 sec bins |
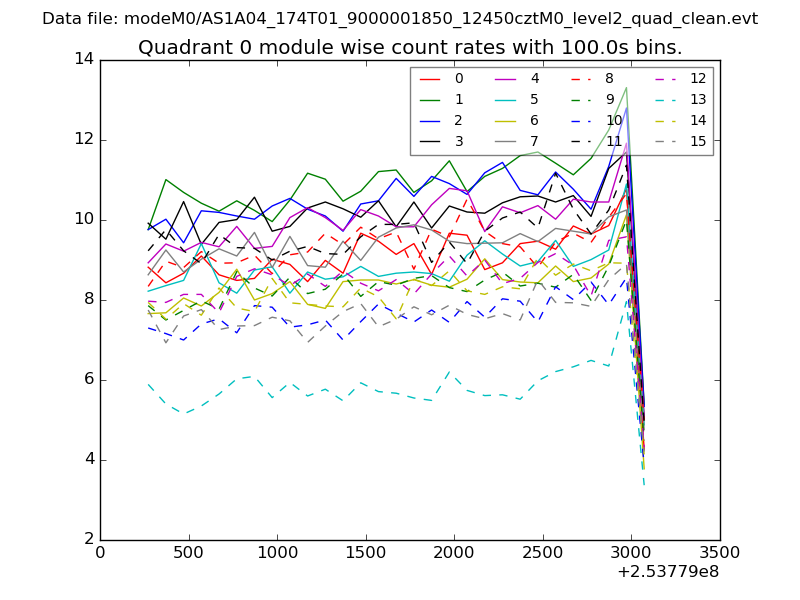 |
 |
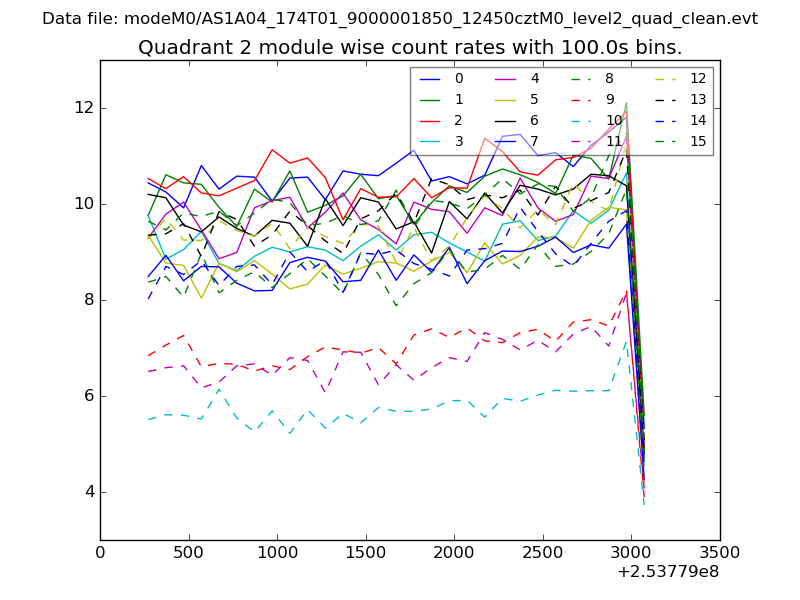
| Module-wise count rates for Quadrant B Data is divided into 100 sec bins |
 |
 |
| Module-wise count rates for Quadrant C Data is divided into 100 sec bins |
 |
 |
| Module-wise count rates for Quadrant D Data is divided into 100 sec bins |
 |
 |
| Parameter | Plot |
|---|---|
| CZT HV Monitor | 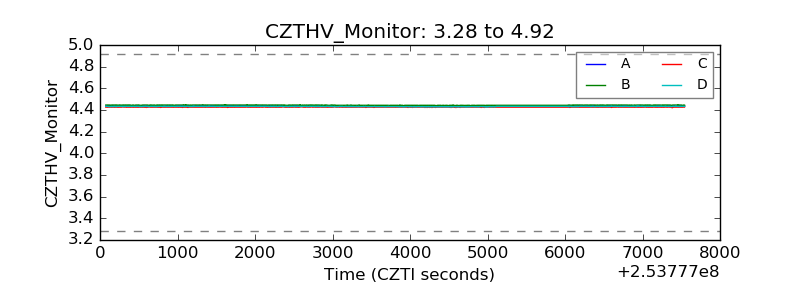 |
| D_VDD | 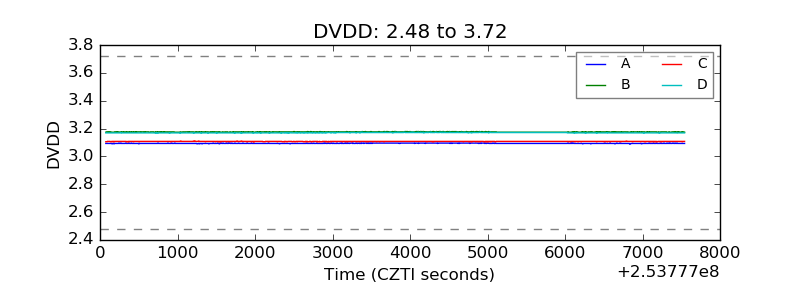 |
| Temperature 1 | 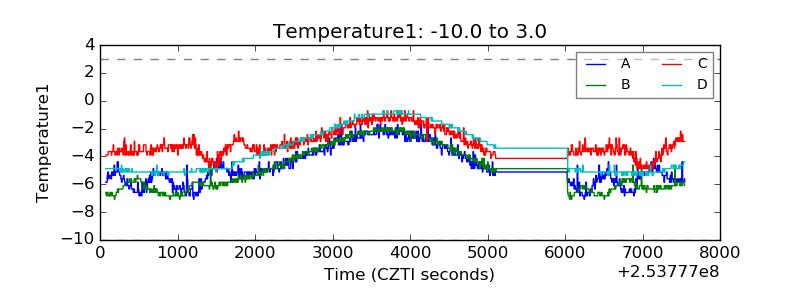 |
| Veto HV Monitor | 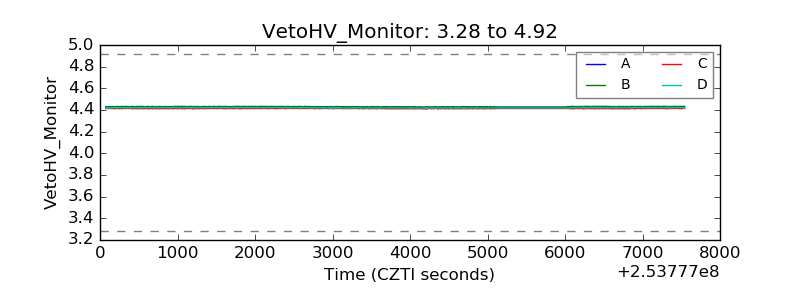 |
| Veto LLD | 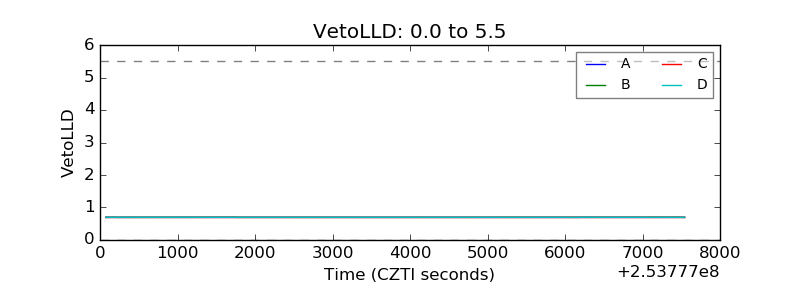 |
| Alpha Counter | 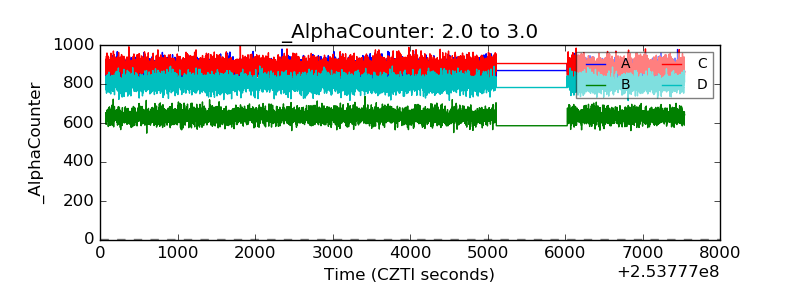 |
| _CPM_Rate | 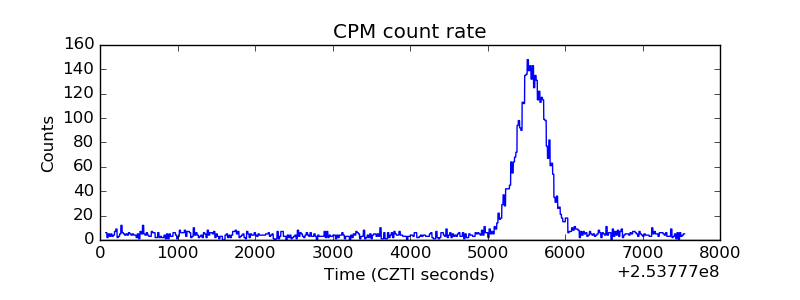 |
| CZT Counter | 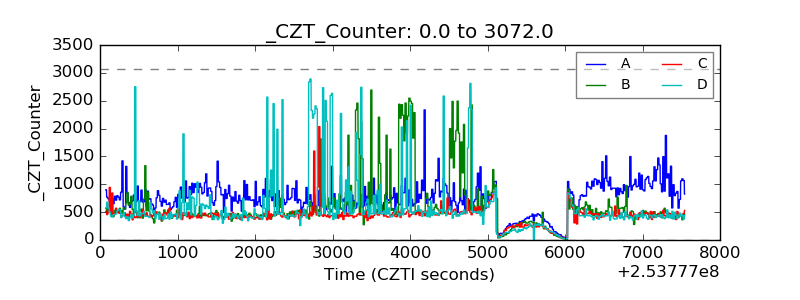 |
| +2.5 Volts monitor | 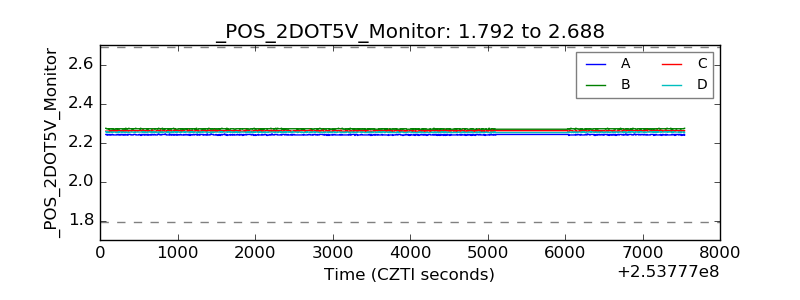 |
| +5 Volts monitor |  |
| _ROLL_ROT | 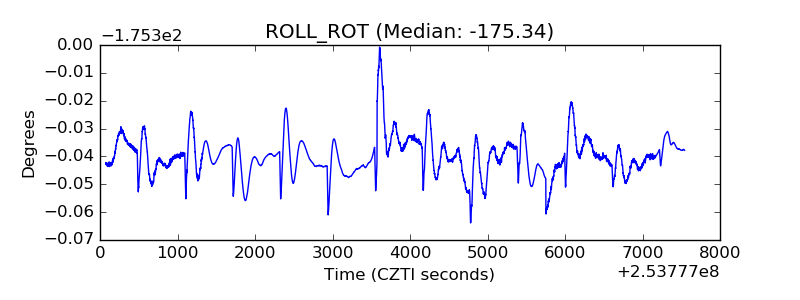 |
| _Roll_DEC | 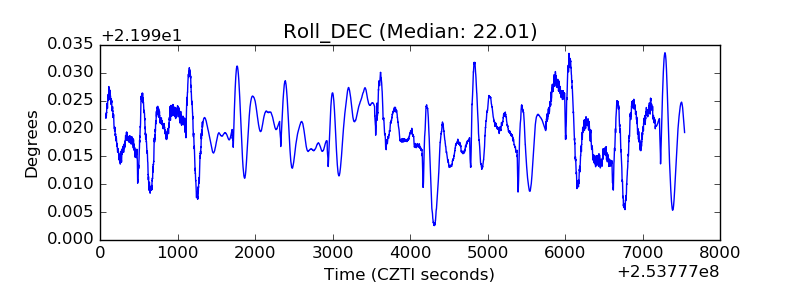 |
| _Roll_RA | 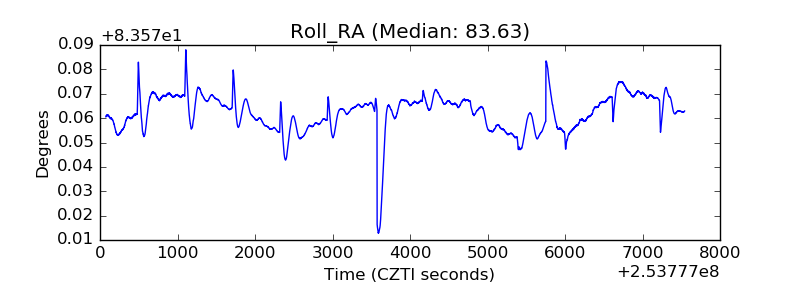 |
| Veto Counter |  |