| Param | Original file | Final file |
|---|---|---|
| Filename | modeM0/AS1A04_174T01_9000001850_12451cztM0_level2.evt | modeM0/AS1A04_174T01_9000001850_12451cztM0_level2_quad_clean.evt |
| Size (bytes) | 577,944,000 | 83,162,880 |
| Size | 551.2 MB | 79.3 MB |
| Events in quadrant A | 5,885,074 | 503,542 |
| Events in quadrant B | 4,172,175 | 506,539 |
| Events in quadrant C | 3,397,499 | 517,360 |
| Events in quadrant D | 3,561,472 | 490,612 |
| Mode M0 | |||
|---|---|---|---|
| Quadrant | BADHDUFLAG | Total packets | Discarded packets |
| A | 0 | 22553 | 2 |
| B | 0 | 16863 | 1 |
| C | 0 | 14839 | 1 |
| D | 0 | 15502 | 1 |
| Mode M9 | |||
|---|---|---|---|
| Quadrant | BADHDUFLAG | Total packets | Discarded packets |
| A | 0 | 4 | 0 |
| B | 0 | 4 | 0 |
| C | 0 | 4 | 0 |
| D | 0 | 4 | 0 |
| Mode SS | |||
|---|---|---|---|
| Quadrant | BADHDUFLAG | Total packets | Discarded packets |
| A | 0 | 144 | 0 |
| B | 0 | 144 | 0 |
| C | 0 | 144 | 0 |
| D | 0 | 144 | 0 |
| Quadrant | Total seconds | Saturated seconds | Saturation percentage |
|---|---|---|---|
| A | 7189 | 259 | 3.602726% |
| B | 7189 | 359 | 4.993740% |
| C | 7189 | 130 | 1.808318% |
| D | 7189 | 171 | 2.378634% |
Noise dominated data is calculated using 1-second bins in cleaned event files. If a bin has >2000 counts, and if more than 50% of those come from <1% of pixels, then it is considered to be noise-dominated and hence unusable.
| Quadrant | # 1 sec bins | Bins with >0 counts | Bins with >2000 counts | High rate bins dominated by noise | Noise dominated (total time) | Noise dominated (detector-on time) | Marked lightcurve |
|---|---|---|---|---|---|---|---|
| A | 7555 | 7190 | 29 | 29 | 0.38% | 0.40% |  |
| B | 7555 | 7190 | 134 | 134 | 1.77% | 1.86% |  |
| C | 7555 | 7190 | 0 | 0 | 0.00% | 0.00% | 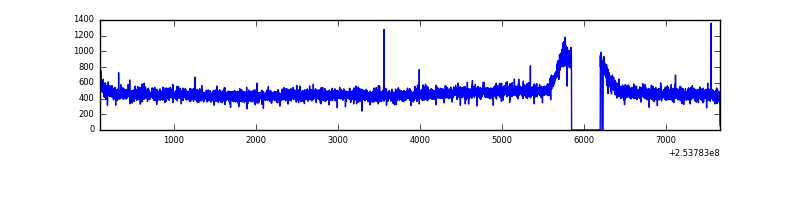 |
| D | 7555 | 7191 | 32 | 32 | 0.42% | 0.45% |  |
Top three noisy pixels from each quadrant. If the there are fewer than three noisy pixels in the level2.evt file, extra rows are filled as -1
| Pixel properties | Quadrant properties | ||||||
|---|---|---|---|---|---|---|---|
| Quadrant | DetID | PixID | Counts | Sigma | Mean | Median | Sigma |
| A | 13 | 251 | 1008012 | 5593.74 | 876 | 857 | 180.1 |
| A | 0 | 23 | 944507 | 5241.03 | 876 | 857 | 180.1 |
| A | 1 | 162 | 182523 | 1008.97 | 876 | 857 | 180.1 |
| B | 4 | 239 | 540066 | 3156.86 | 880 | 857 | 170.8 |
| B | 0 | 187 | 69343 | 400.96 | 880 | 857 | 170.8 |
| B | 11 | 51 | 53524 | 308.34 | 880 | 857 | 170.8 |
| C | 13 | 61 | 6390 | 27.16 | 871 | 876 | 203.0 |
| C | 8 | 222 | 2838 | 9.66 | 871 | 876 | 203.0 |
| C | 3 | 202 | 2159 | 6.32 | 871 | 876 | 203.0 |
| D | 8 | 195 | 123739 | 599.17 | 855 | 833 | 205.1 |
| D | 10 | 199 | 54957 | 263.85 | 855 | 833 | 205.1 |
| D | 7 | 71 | 49691 | 238.18 | 855 | 833 | 205.1 |
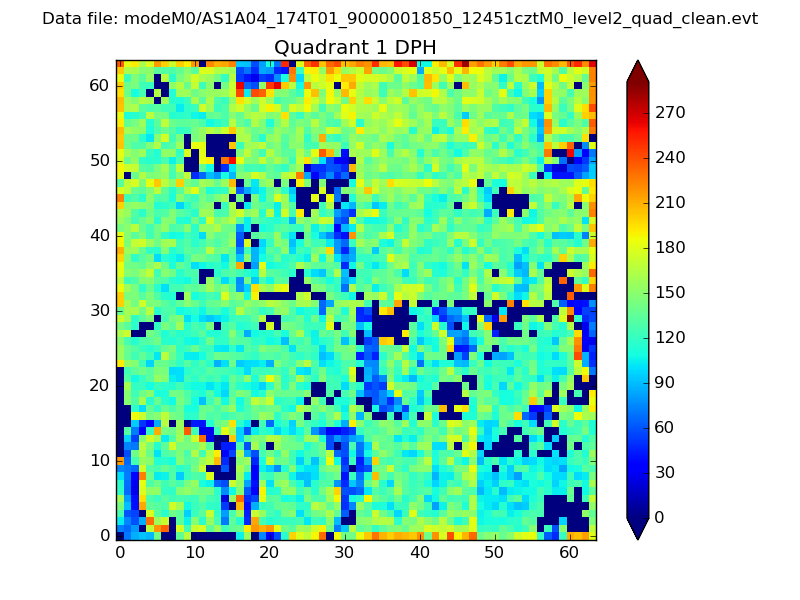
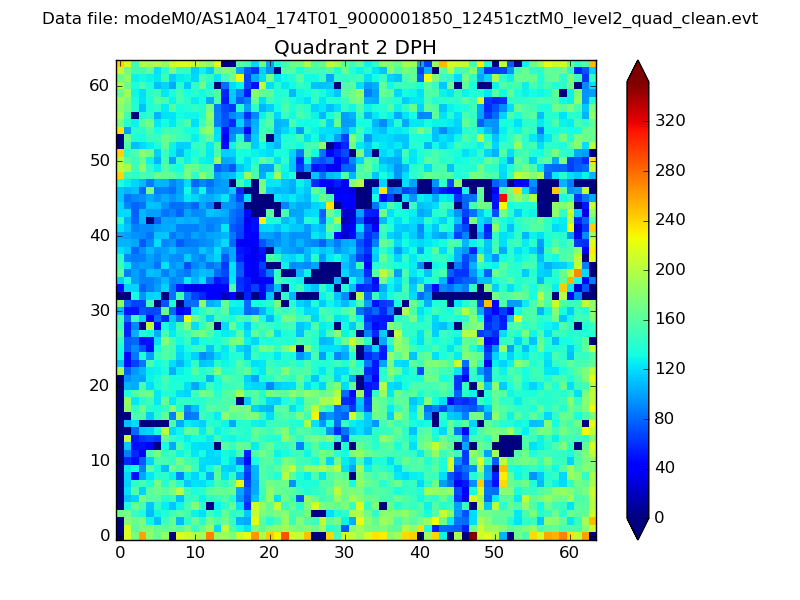
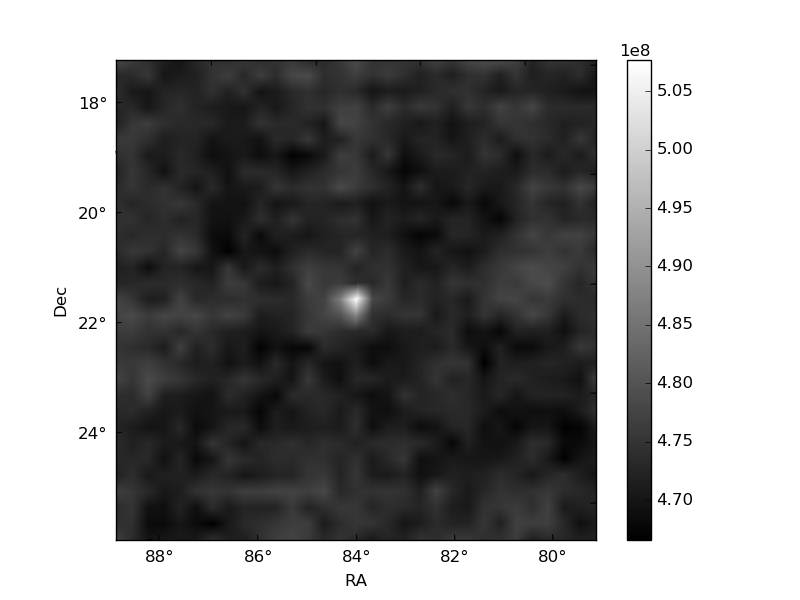
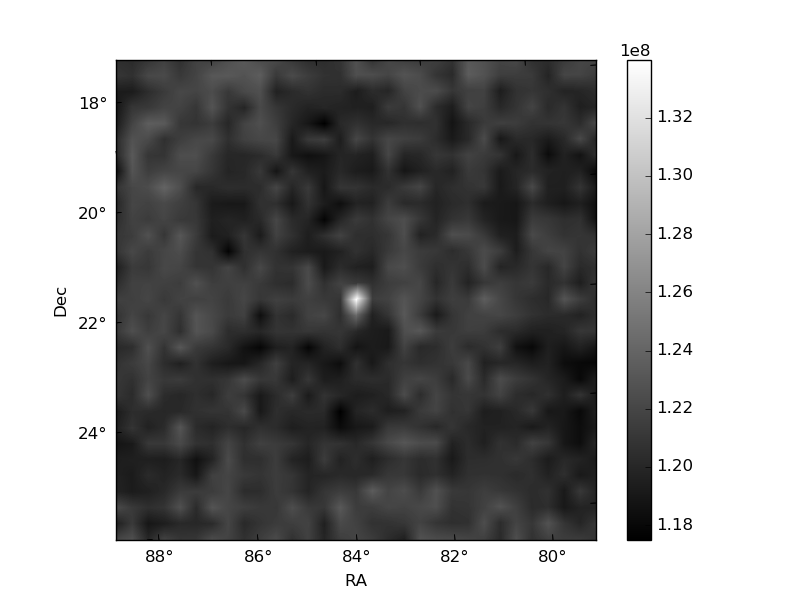
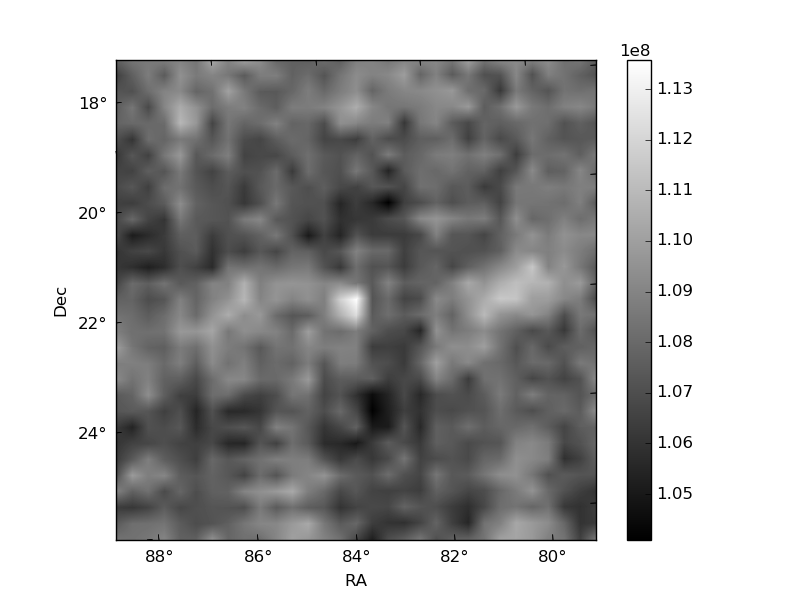
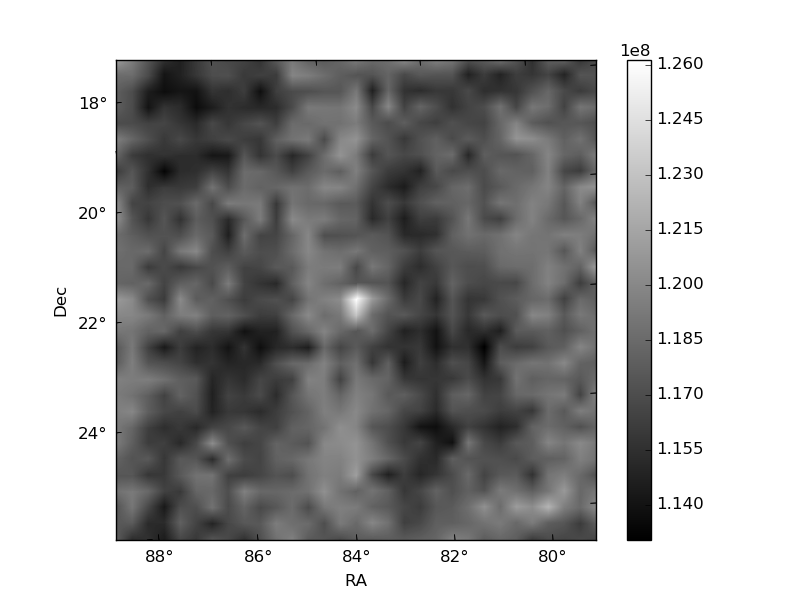
Histogram calculated using DETX and DETY for each event in the final _common_clean file
| Quadrant A |  |
 |
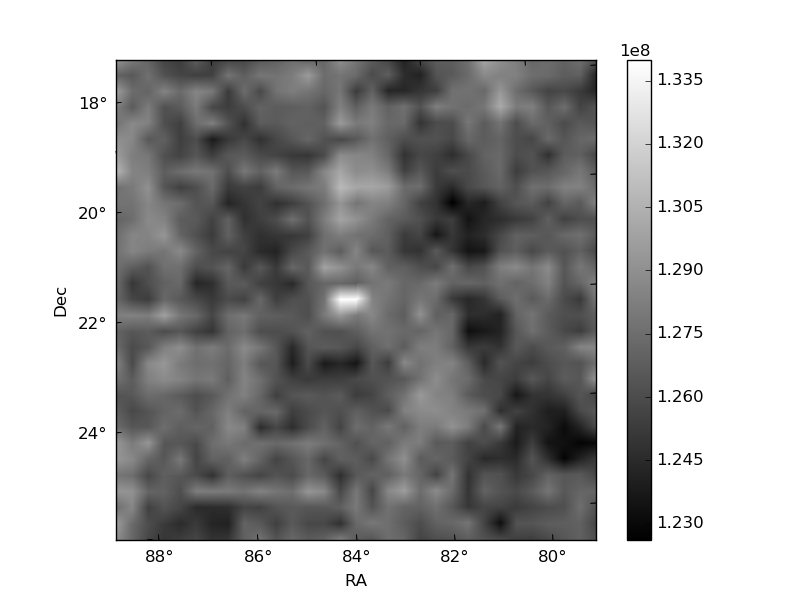
Quadrant B |
|---|---|---|---|
| Quadrant D | 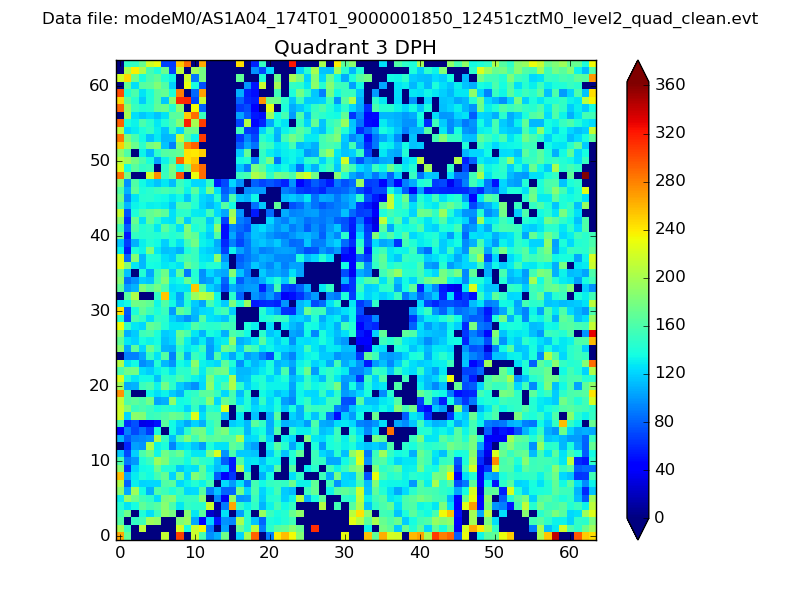 |
 |
Quadrant C |
| Plot type | Count rate plots | Images |
|---|---|---|
| Comparison with Poisson distribution Blue bars denote a histogram of data divided into 1 sec bins. Red curve is a Poisson curve with rate = median count rate of data. |
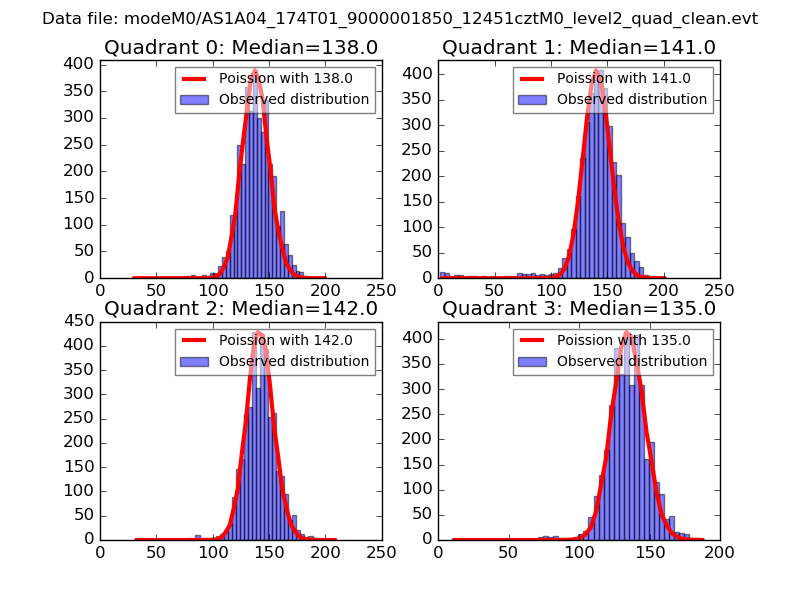 |
 |
| Quadrant-wise count rates Data is divided into 100 sec bins |
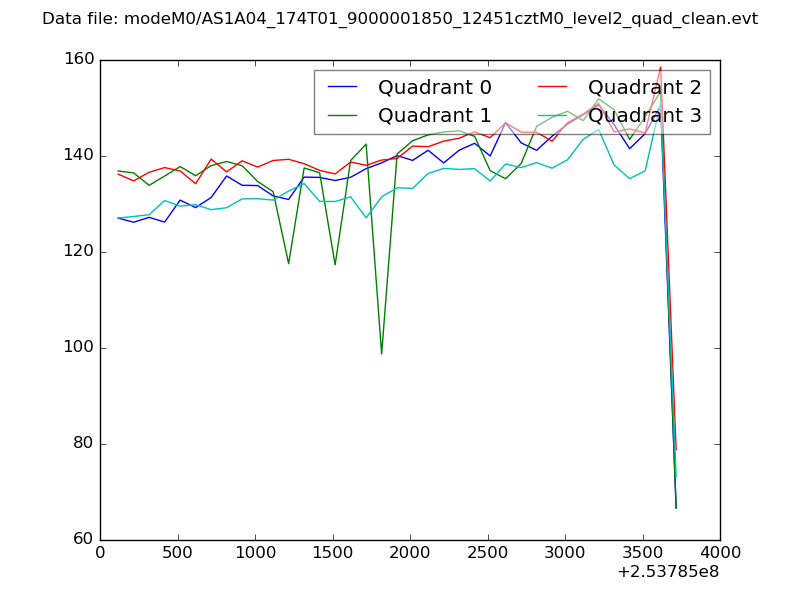 |
|
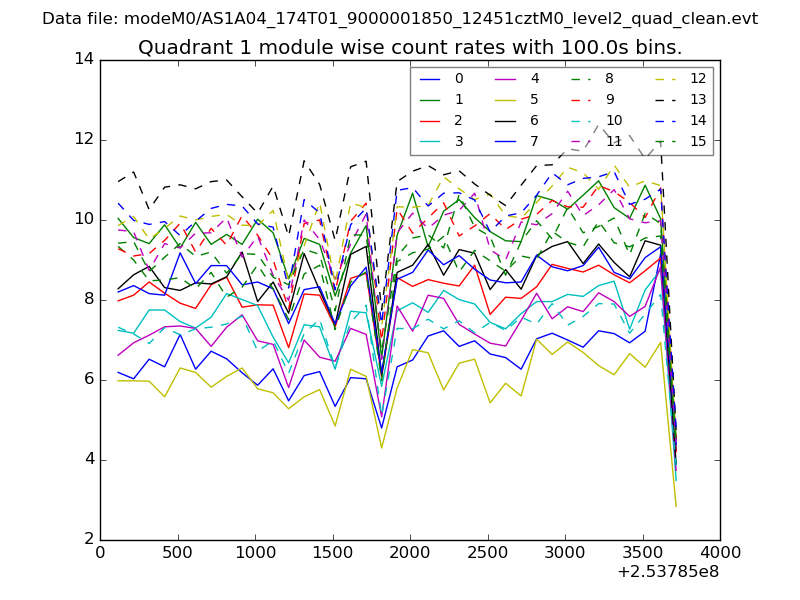
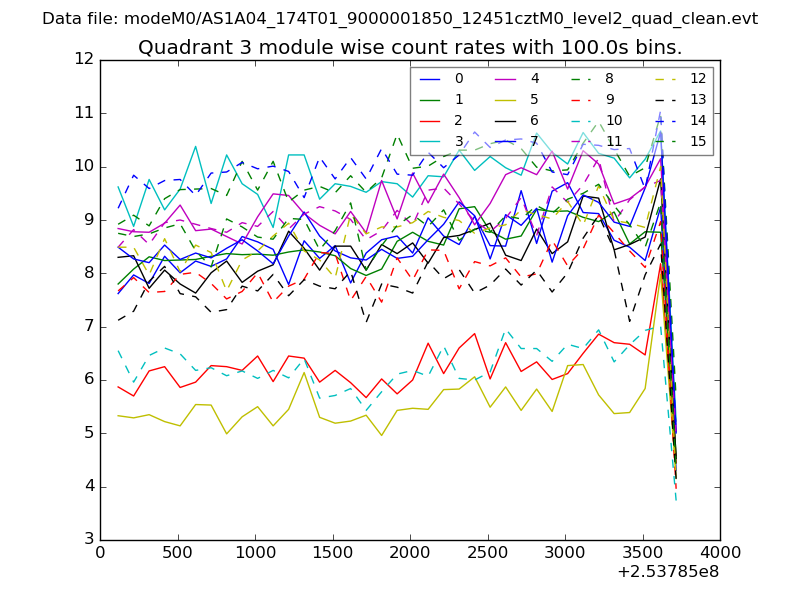
| Module-wise count rates for Quadrant A Data is divided into 100 sec bins |
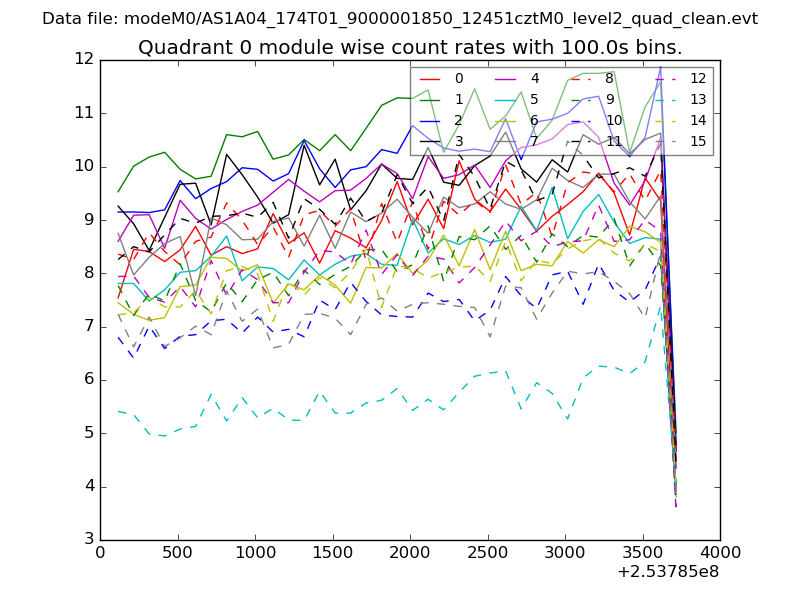 |
 |
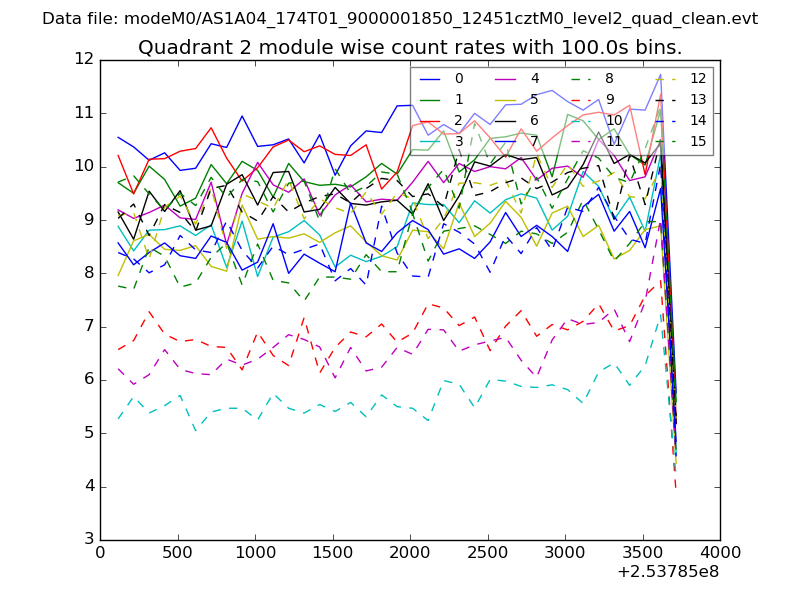
| Module-wise count rates for Quadrant B Data is divided into 100 sec bins |
 |
 |
| Module-wise count rates for Quadrant C Data is divided into 100 sec bins |
 |
 |
| Module-wise count rates for Quadrant D Data is divided into 100 sec bins |
 |
 |
| Parameter | Plot |
|---|---|
| CZT HV Monitor | 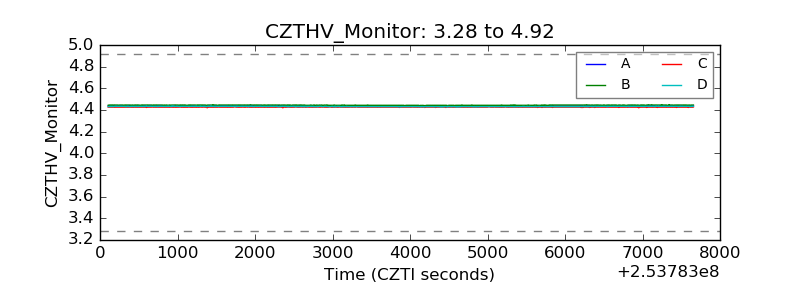 |
| D_VDD | 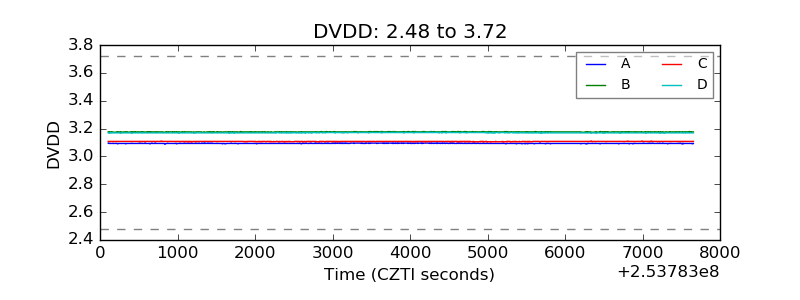 |
| Temperature 1 | 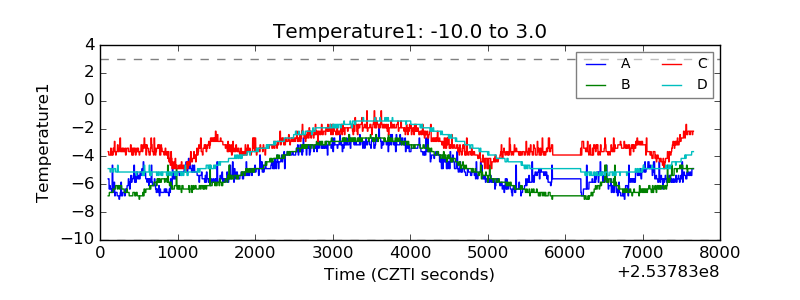 |
| Veto HV Monitor | 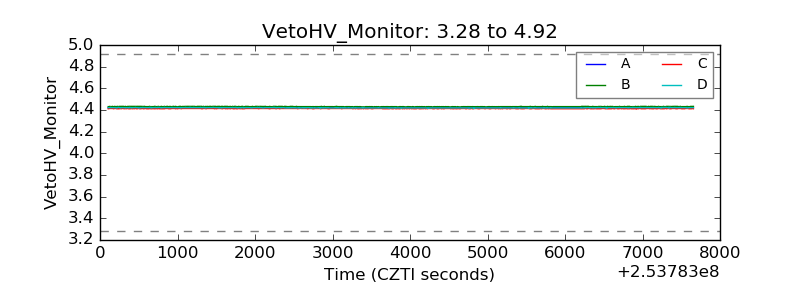 |
| Veto LLD | 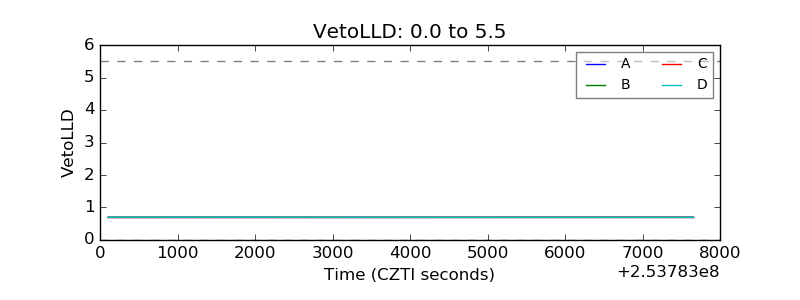 |
| Alpha Counter | 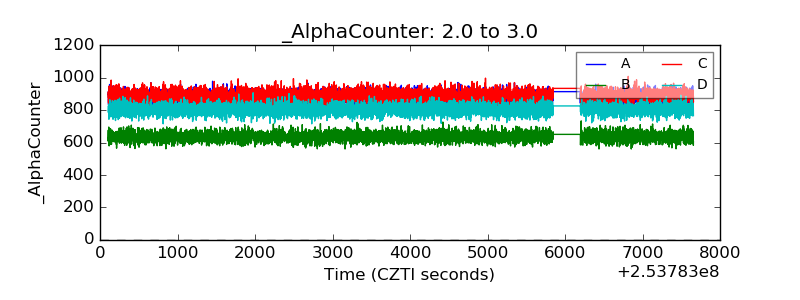 |
| _CPM_Rate | 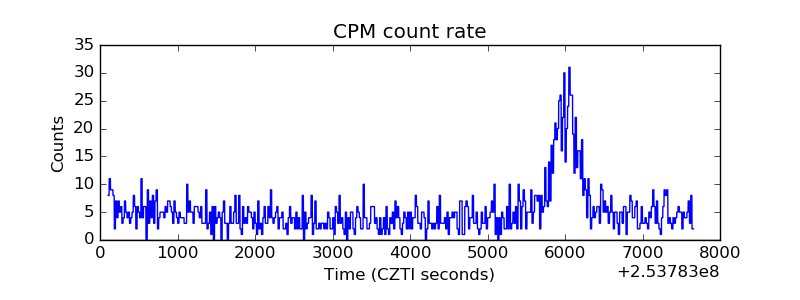 |
| CZT Counter | 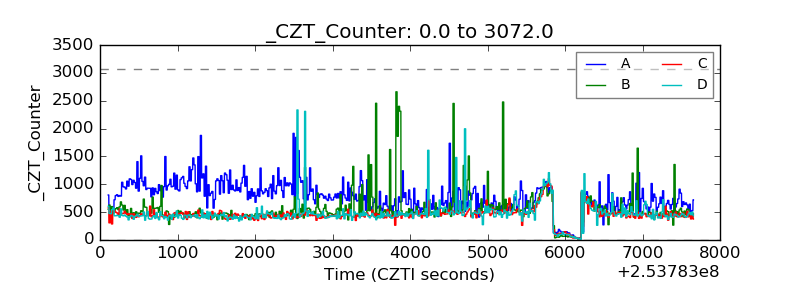 |
| +2.5 Volts monitor |  |
| +5 Volts monitor |  |
| _ROLL_ROT | 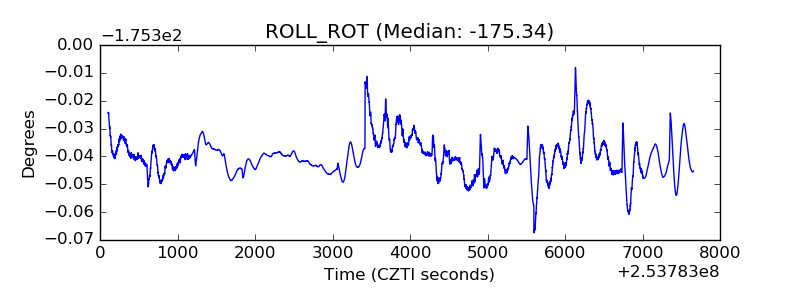 |
| _Roll_DEC | 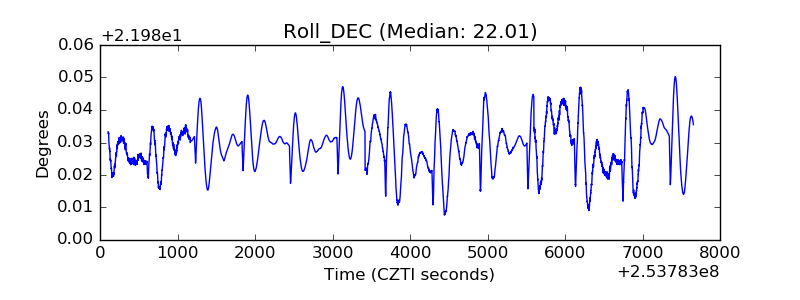 |
| _Roll_RA | 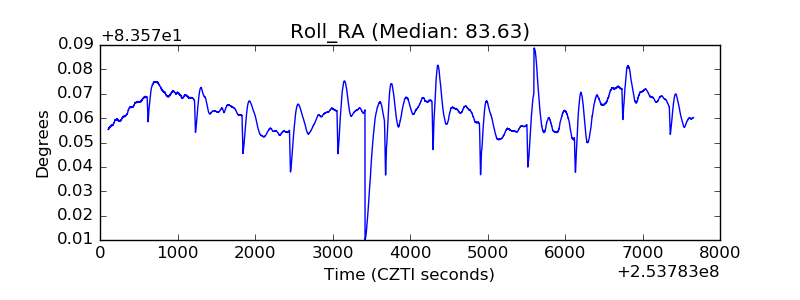 |
| Veto Counter | 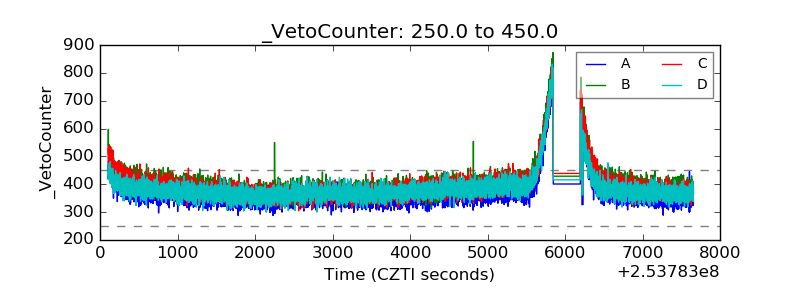 |