| Param | Original file | Final file |
|---|---|---|
| Filename | modeM0/AS1A04_174T01_9000001850_12452cztM0_level2.evt | modeM0/AS1A04_174T01_9000001850_12452cztM0_level2_quad_clean.evt |
| Size (bytes) | 707,736,960 | 97,899,840 |
| Size | 675.0 MB | 93.4 MB |
| Events in quadrant A | 6,908,071 | 592,561 |
| Events in quadrant B | 5,256,392 | 592,873 |
| Events in quadrant C | 4,145,245 | 613,250 |
| Events in quadrant D | 4,554,024 | 581,071 |
| Mode M0 | |||
|---|---|---|---|
| Quadrant | BADHDUFLAG | Total packets | Discarded packets |
| A | 0 | 26596 | 2 |
| B | 0 | 20841 | 1 |
| C | 0 | 17857 | 1 |
| D | 0 | 19199 | 1 |
| Mode M9 | |||
|---|---|---|---|
| Quadrant | BADHDUFLAG | Total packets | Discarded packets |
| A | 0 | 4 | 0 |
| B | 0 | 4 | 0 |
| C | 0 | 4 | 0 |
| D | 0 | 4 | 0 |
| Mode SS | |||
|---|---|---|---|
| Quadrant | BADHDUFLAG | Total packets | Discarded packets |
| A | 0 | 170 | 0 |
| B | 0 | 170 | 0 |
| C | 0 | 170 | 0 |
| D | 0 | 170 | 0 |
| Quadrant | Total seconds | Saturated seconds | Saturation percentage |
|---|---|---|---|
| A | 8419 | 752 | 8.932177% |
| B | 8419 | 800 | 9.502316% |
| C | 8419 | 313 | 3.717781% |
| D | 8419 | 443 | 5.261908% |
Noise dominated data is calculated using 1-second bins in cleaned event files. If a bin has >2000 counts, and if more than 50% of those come from <1% of pixels, then it is considered to be noise-dominated and hence unusable.
| Quadrant | # 1 sec bins | Bins with >0 counts | Bins with >2000 counts | High rate bins dominated by noise | Noise dominated (total time) | Noise dominated (detector-on time) | Marked lightcurve |
|---|---|---|---|---|---|---|---|
| A | 8785 | 8420 | 118 | 118 | 1.34% | 1.40% | 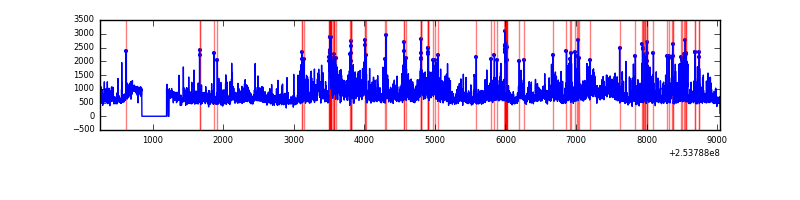 |
| B | 8785 | 8420 | 251 | 251 | 2.86% | 2.98% | 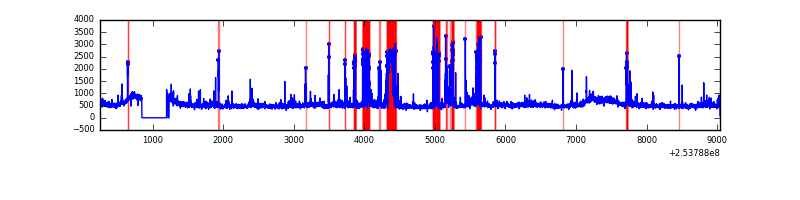 |
| C | 8785 | 8420 | 0 | 0 | 0.00% | 0.00% | 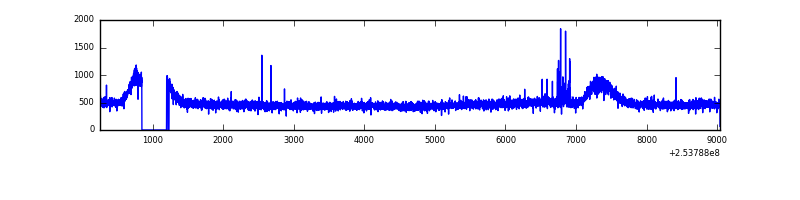 |
| D | 8785 | 8421 | 84 | 84 | 0.96% | 1.00% | 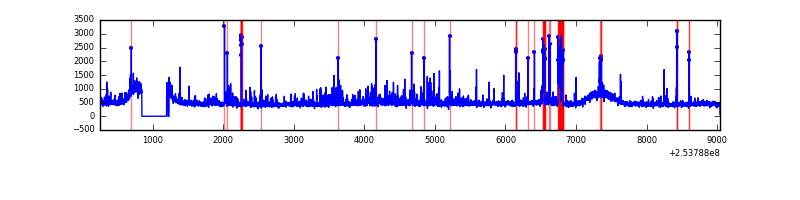 |
Top three noisy pixels from each quadrant. If the there are fewer than three noisy pixels in the level2.evt file, extra rows are filled as -1
| Pixel properties | Quadrant properties | ||||||
|---|---|---|---|---|---|---|---|
| Quadrant | DetID | PixID | Counts | Sigma | Mean | Median | Sigma |
| A | 13 | 251 | 1740973 | 8027.45 | 1049 | 1023 | 216.7 |
| A | 0 | 23 | 441391 | 2031.69 | 1049 | 1023 | 216.7 |
| A | 1 | 162 | 231831 | 1064.86 | 1049 | 1023 | 216.7 |
| B | 4 | 239 | 862050 | 4167.81 | 1058 | 1031 | 206.6 |
| B | 11 | 51 | 117043 | 561.56 | 1058 | 1031 | 206.6 |
| B | 0 | 187 | 73038 | 348.55 | 1058 | 1031 | 206.6 |
| C | 15 | 208 | 31116 | 122.1 | 1055 | 1061 | 246.1 |
| C | 13 | 61 | 7884 | 27.72 | 1055 | 1061 | 246.1 |
| C | 3 | 202 | 2511 | 5.89 | 1055 | 1061 | 246.1 |
| D | 13 | 104 | 239239 | 953.3 | 1038 | 1008 | 249.9 |
| D | 8 | 195 | 225107 | 896.75 | 1038 | 1008 | 249.9 |
| D | 10 | 199 | 88125 | 348.61 | 1038 | 1008 | 249.9 |
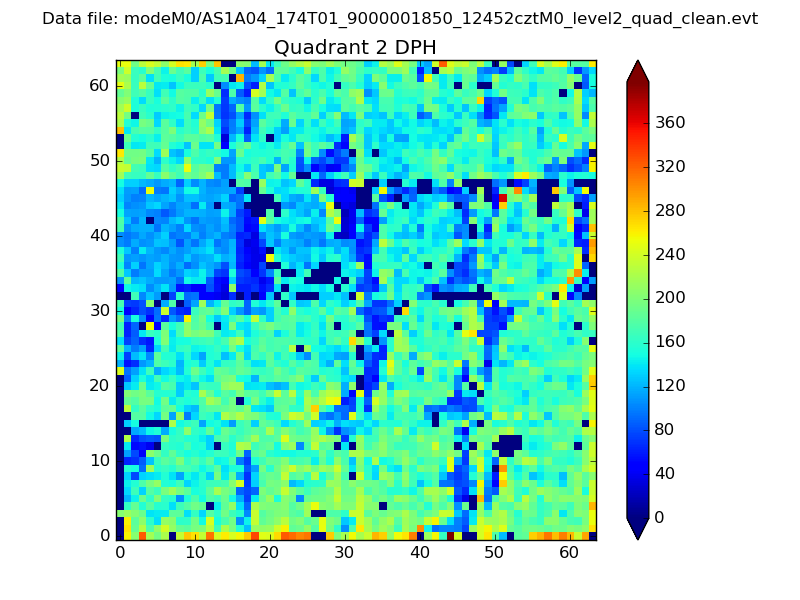
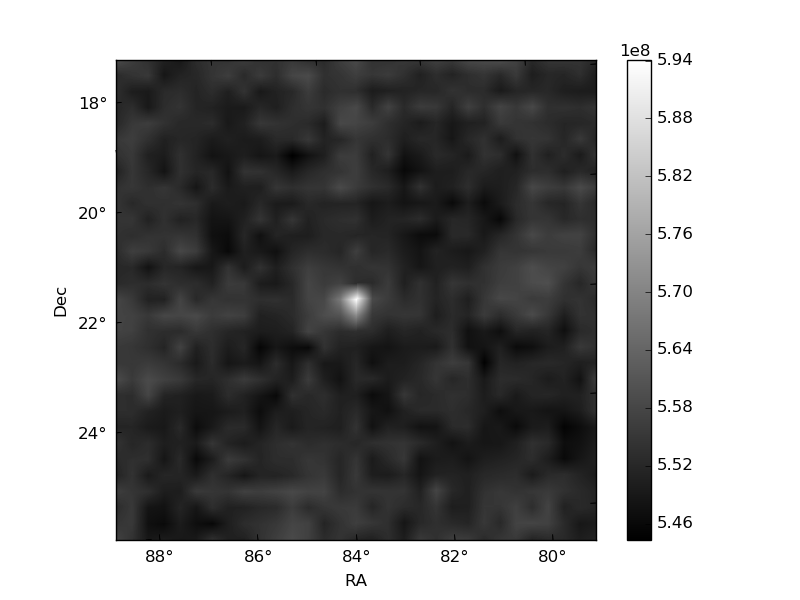
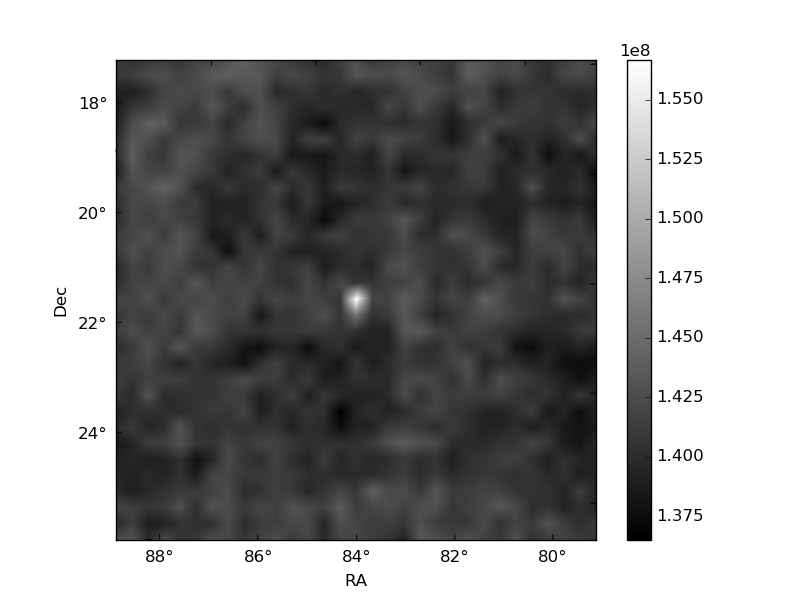
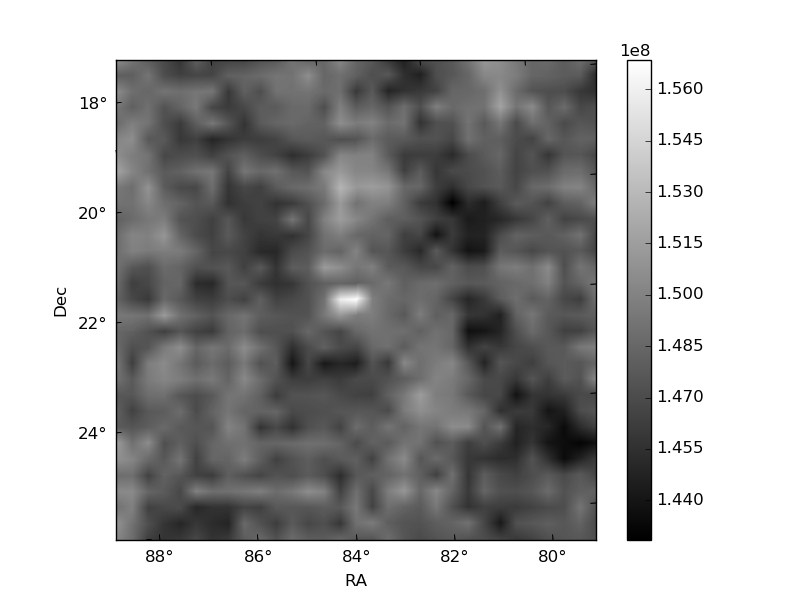
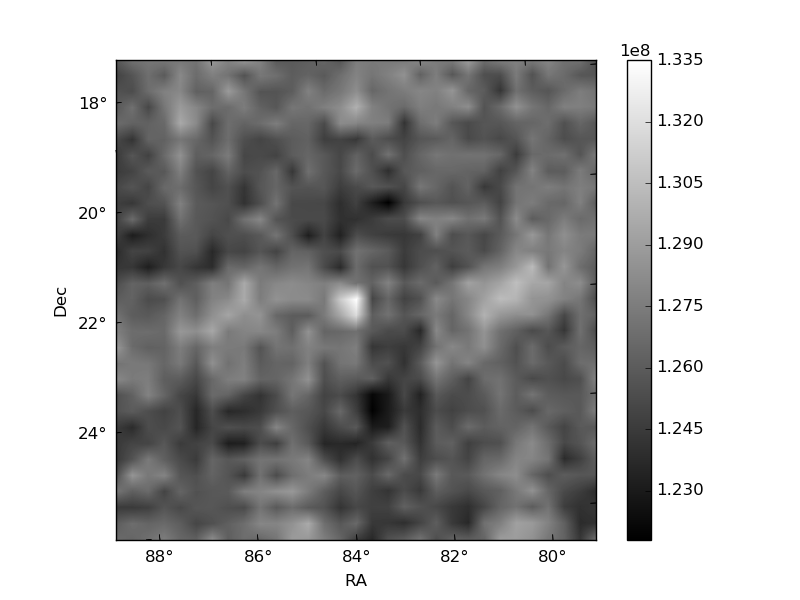
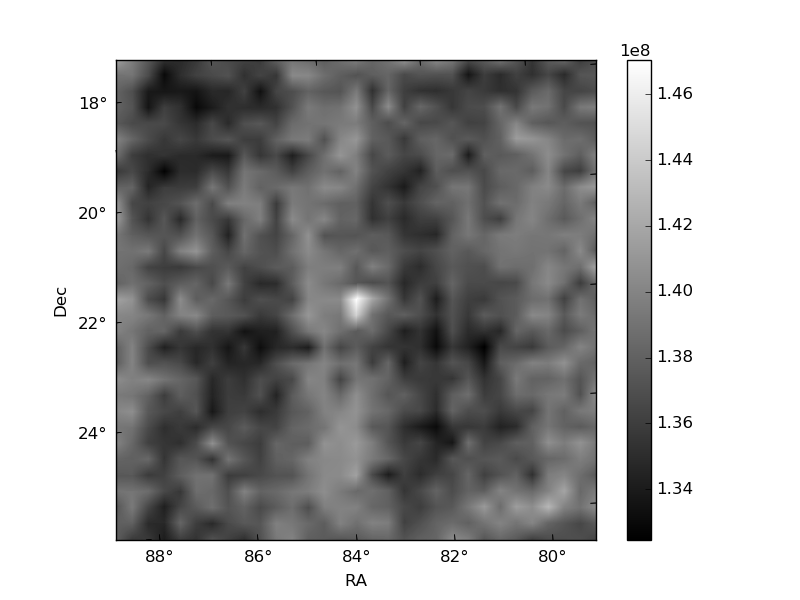
Histogram calculated using DETX and DETY for each event in the final _common_clean file
| Quadrant A | 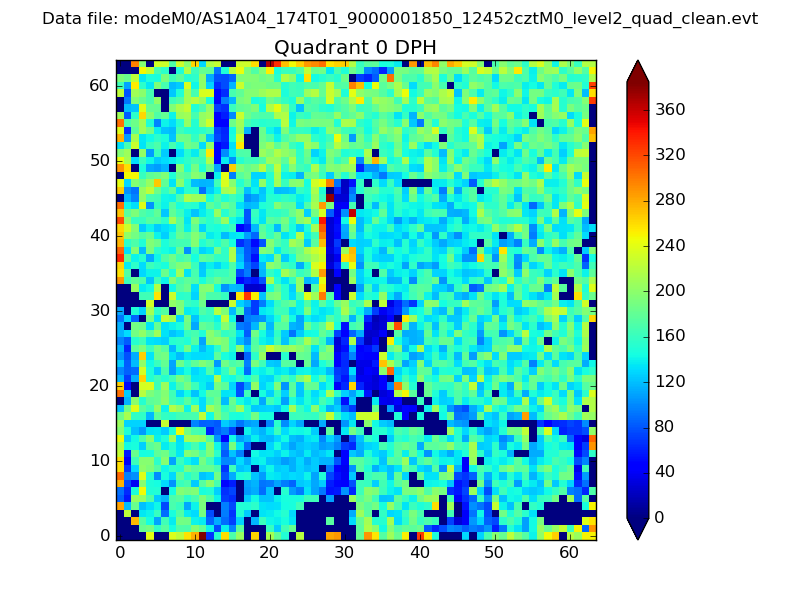 |
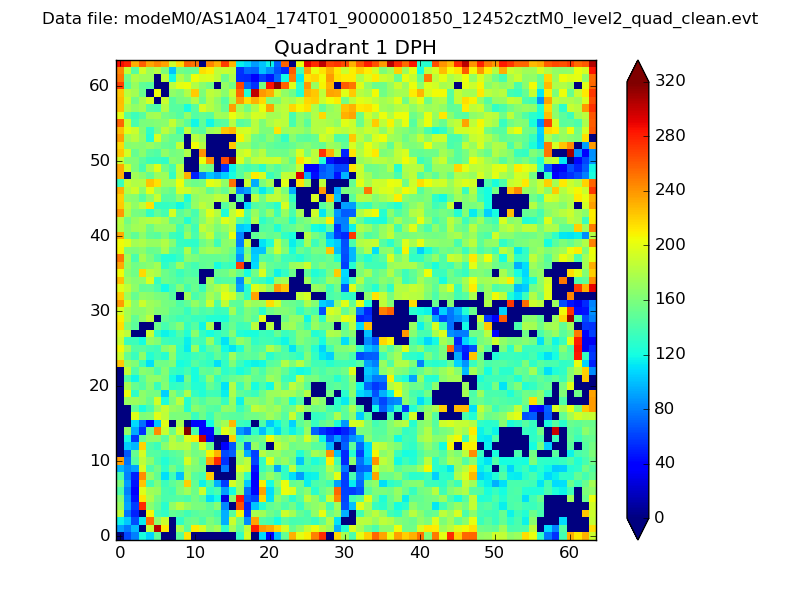 |
Quadrant B |
|---|---|---|---|
| Quadrant D | 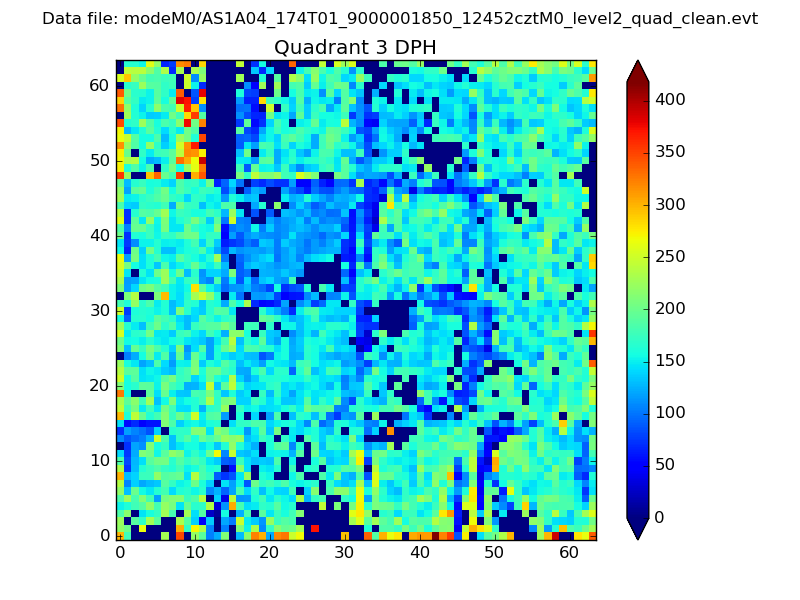 |
 |
Quadrant C |
| Plot type | Count rate plots | Images |
|---|---|---|
| Comparison with Poisson distribution Blue bars denote a histogram of data divided into 1 sec bins. Red curve is a Poisson curve with rate = median count rate of data. |
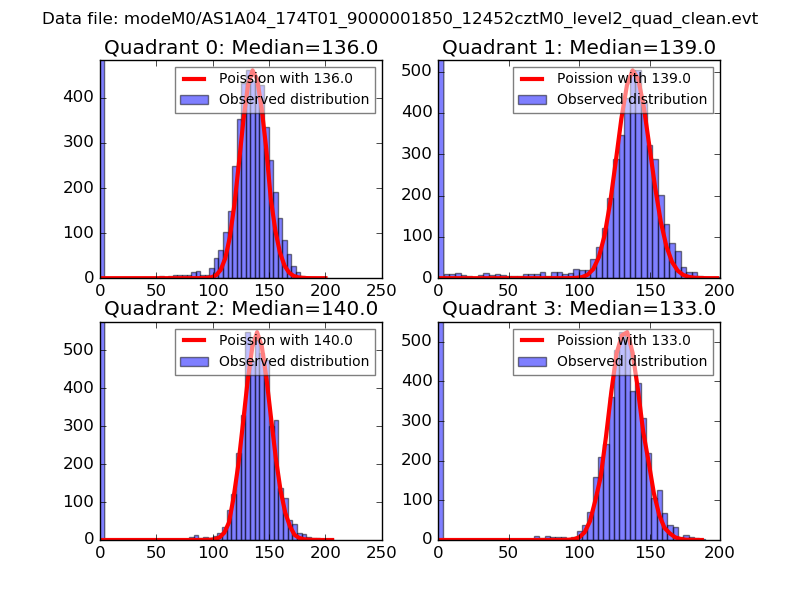 |
 |
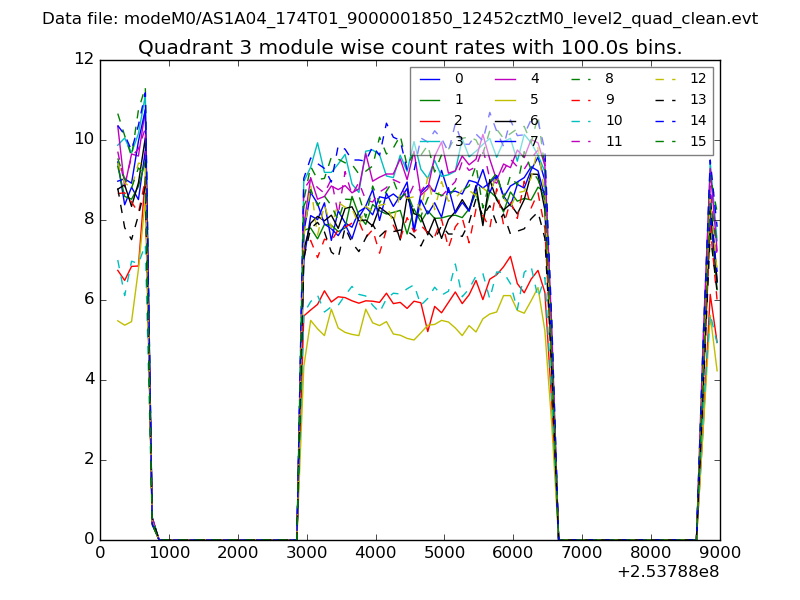
| Quadrant-wise count rates Data is divided into 100 sec bins |
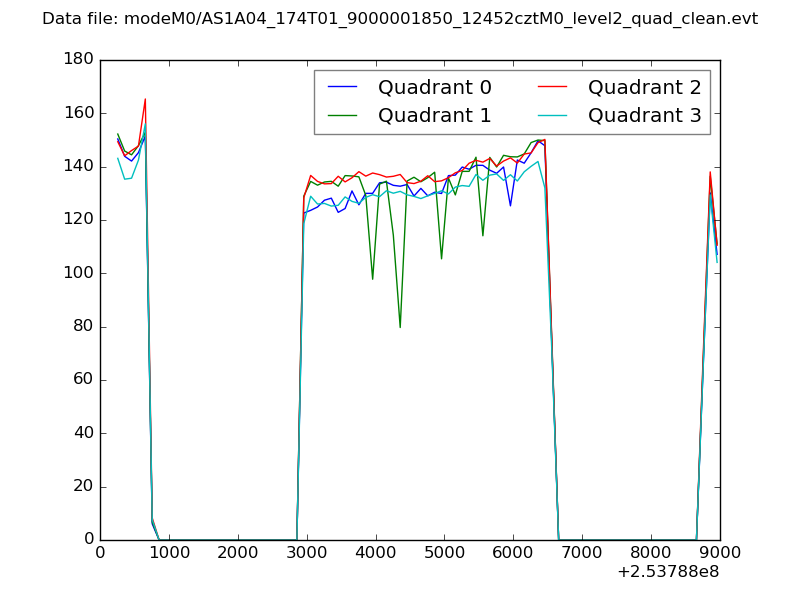 |
|
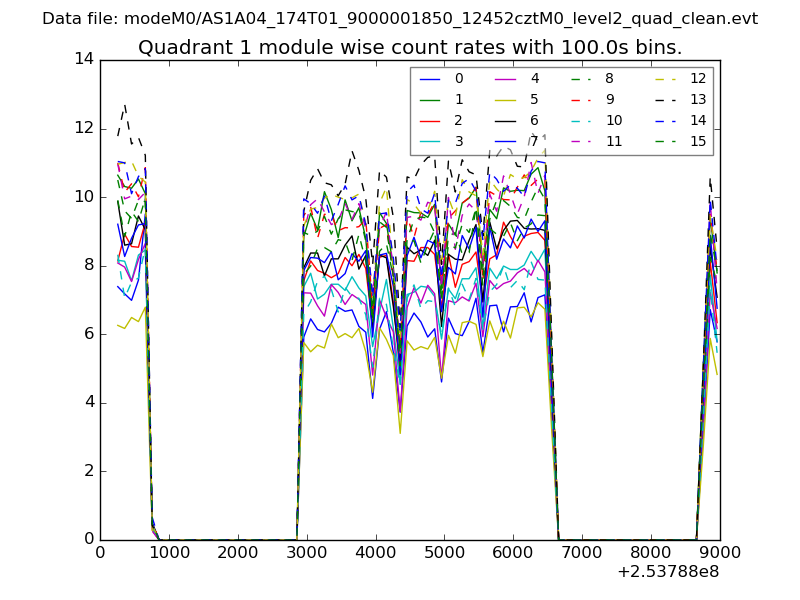
| Module-wise count rates for Quadrant A Data is divided into 100 sec bins |
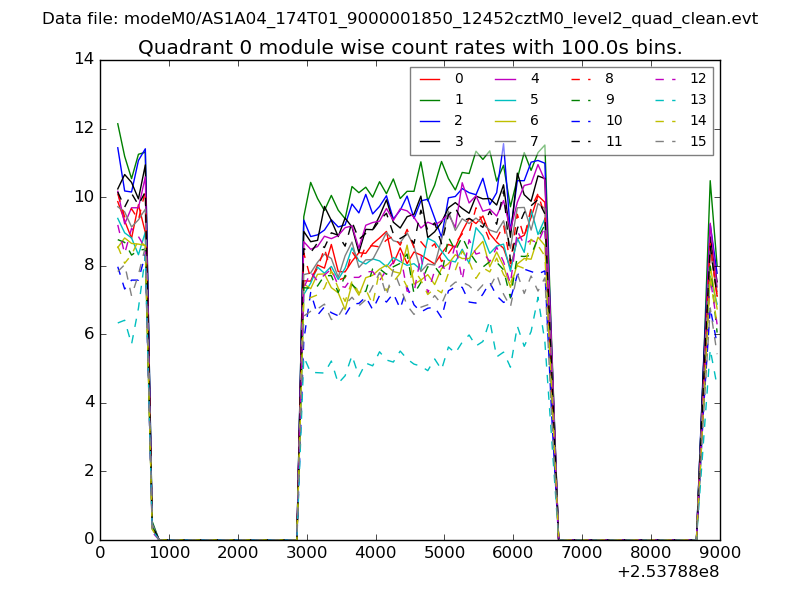 |
 |
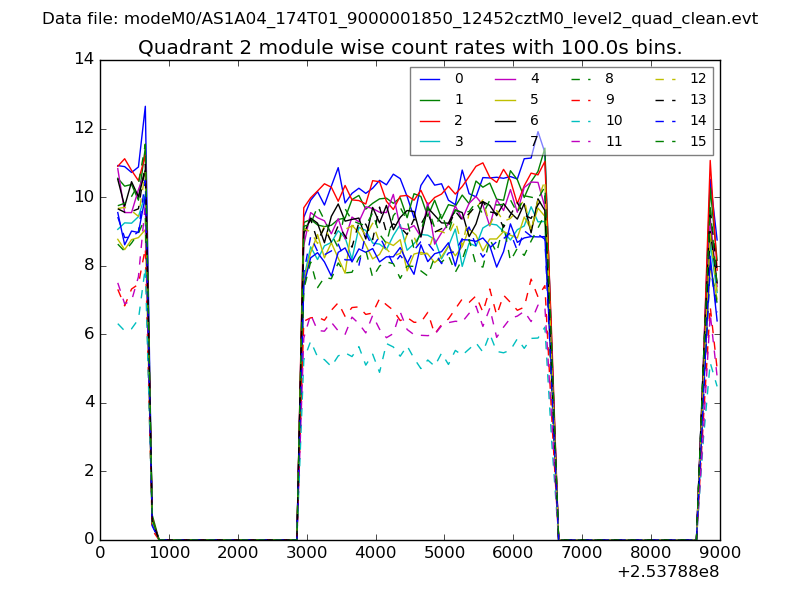
| Module-wise count rates for Quadrant B Data is divided into 100 sec bins |
 |
 |
| Module-wise count rates for Quadrant C Data is divided into 100 sec bins |
 |
 |
| Module-wise count rates for Quadrant D Data is divided into 100 sec bins |
 |
 |
| Parameter | Plot |
|---|---|
| CZT HV Monitor | 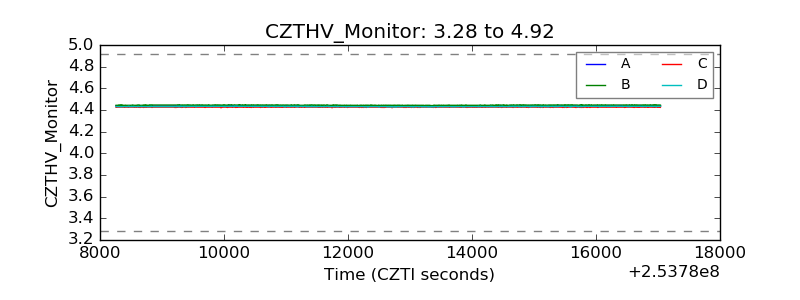 |
| D_VDD | 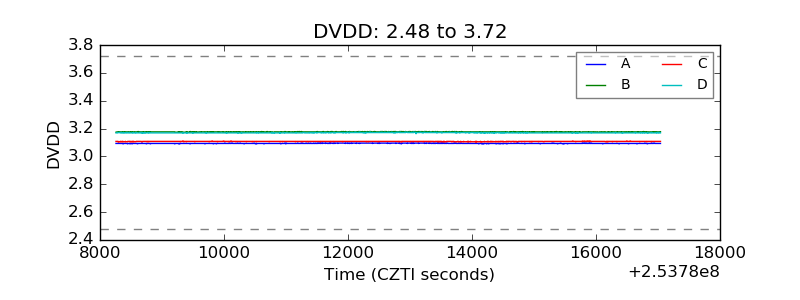 |
| Temperature 1 | 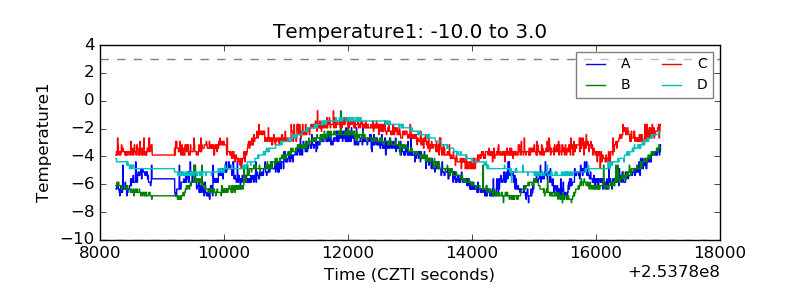 |
| Veto HV Monitor | 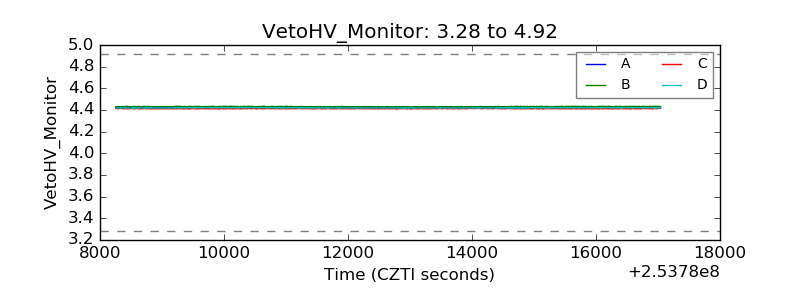 |
| Veto LLD | 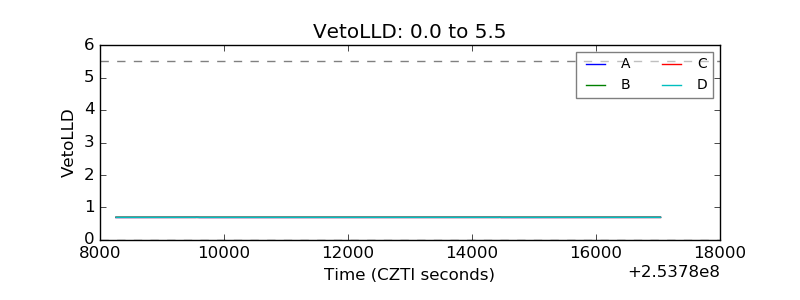 |
| Alpha Counter | 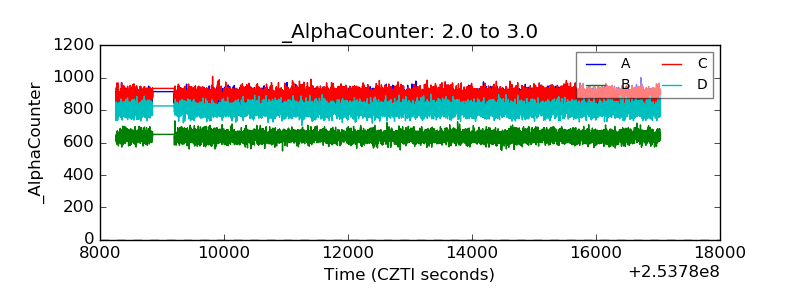 |
| _CPM_Rate | 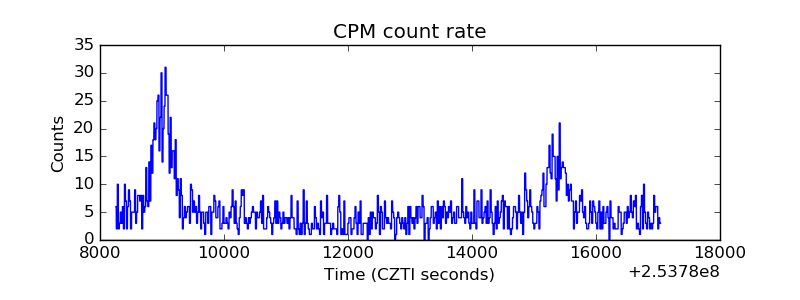 |
| CZT Counter | 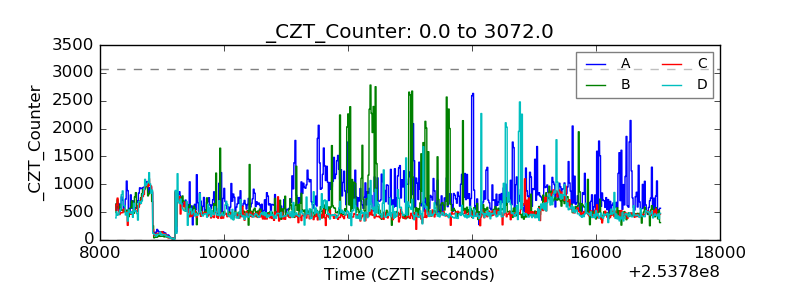 |
| +2.5 Volts monitor | 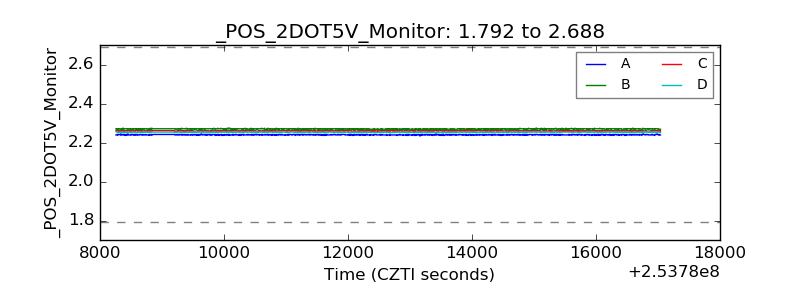 |
| +5 Volts monitor |  |
| _ROLL_ROT | 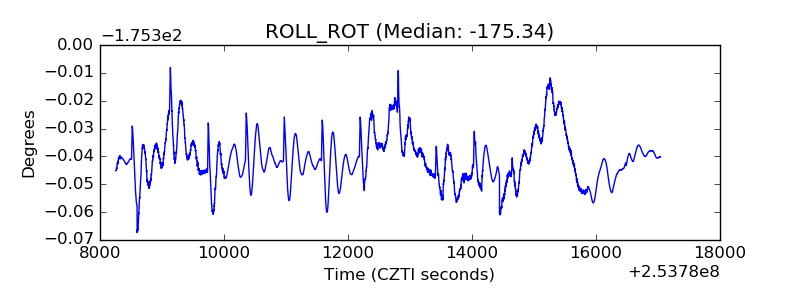 |
| _Roll_DEC | 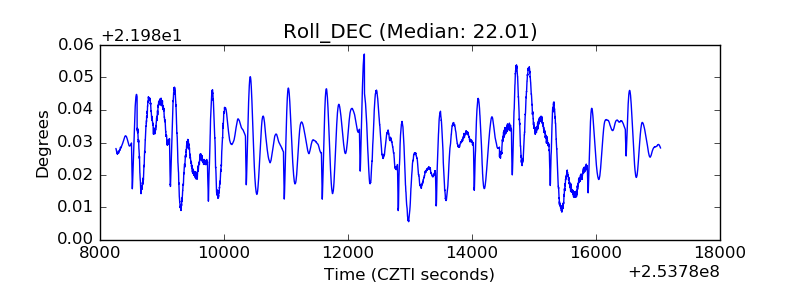 |
| _Roll_RA | 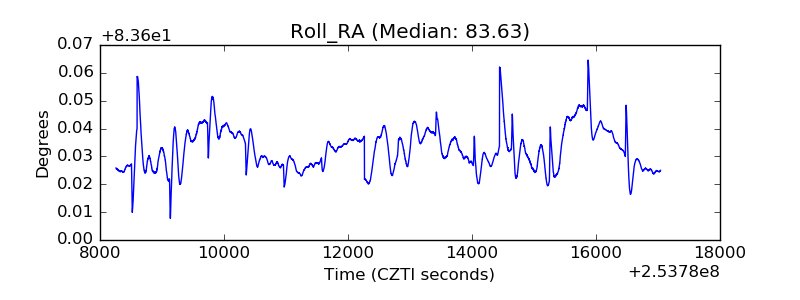 |
| Veto Counter | 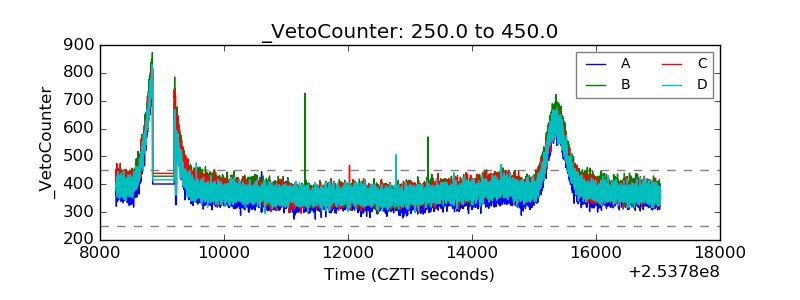 |