| Param | Original file | Final file |
|---|---|---|
| Filename | modeM0/AS1A04_174T01_9000001850_12457cztM0_level2.evt | modeM0/AS1A04_174T01_9000001850_12457cztM0_level2_quad_clean.evt |
| Size (bytes) | 675,305,280 | 94,308,480 |
| Size | 644.0 MB | 89.9 MB |
| Events in quadrant A | 9,504,640 | 578,481 |
| Events in quadrant B | 3,881,099 | 607,943 |
| Events in quadrant C | 3,044,080 | 621,223 |
| Events in quadrant D | 3,578,491 | 590,252 |
| Mode M0 | |||
|---|---|---|---|
| Quadrant | BADHDUFLAG | Total packets | Discarded packets |
| A | 0 | 32864 | 2 |
| B | 0 | 15864 | 1 |
| C | 0 | 13402 | 1 |
| D | 0 | 14948 | 1 |
| Mode M9 | |||
|---|---|---|---|
| Quadrant | BADHDUFLAG | Total packets | Discarded packets |
| A | 0 | 10 | 0 |
| B | 0 | 10 | 0 |
| C | 0 | 10 | 0 |
| D | 0 | 10 | 0 |
| Mode SS | |||
|---|---|---|---|
| Quadrant | BADHDUFLAG | Total packets | Discarded packets |
| A | 0 | 132 | 0 |
| B | 0 | 132 | 0 |
| C | 0 | 132 | 0 |
| D | 0 | 132 | 0 |
| Quadrant | Total seconds | Saturated seconds | Saturation percentage |
|---|---|---|---|
| A | 6567 | 1331 | 20.268007% |
| B | 6567 | 278 | 4.233288% |
| C | 6567 | 34 | 0.517740% |
| D | 6567 | 81 | 1.233440% |
Noise dominated data is calculated using 1-second bins in cleaned event files. If a bin has >2000 counts, and if more than 50% of those come from <1% of pixels, then it is considered to be noise-dominated and hence unusable.
| Quadrant | # 1 sec bins | Bins with >0 counts | Bins with >2000 counts | High rate bins dominated by noise | Noise dominated (total time) | Noise dominated (detector-on time) | Marked lightcurve |
|---|---|---|---|---|---|---|---|
| A | 7578 | 6568 | 1071 | 1071 | 14.13% | 16.31% | 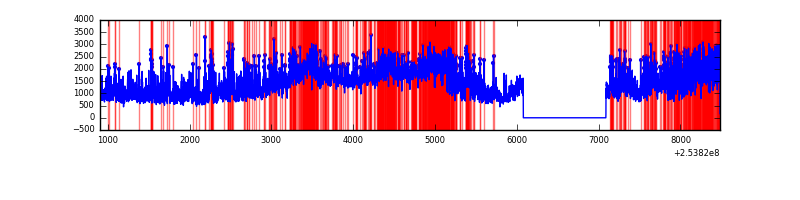 |
| B | 7578 | 6568 | 161 | 161 | 2.12% | 2.45% | 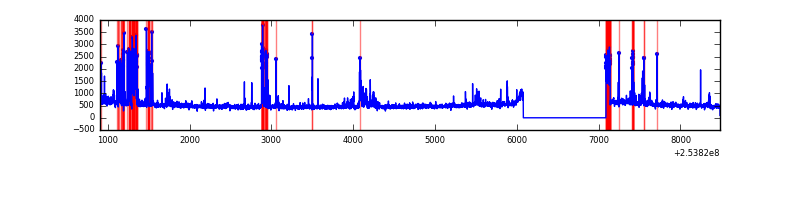 |
| C | 7578 | 6568 | 0 | 0 | 0.00% | 0.00% | 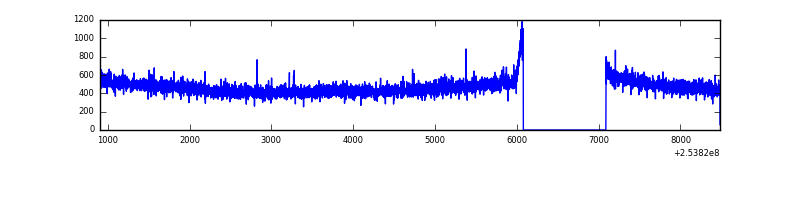 |
| D | 7578 | 6568 | 43 | 43 | 0.57% | 0.65% | 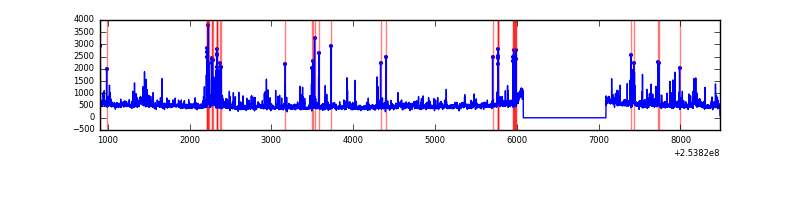 |
Top three noisy pixels from each quadrant. If the there are fewer than three noisy pixels in the level2.evt file, extra rows are filled as -1
| Pixel properties | Quadrant properties | ||||||
|---|---|---|---|---|---|---|---|
| Quadrant | DetID | PixID | Counts | Sigma | Mean | Median | Sigma |
| A | 13 | 251 | 3701385 | 23724.11 | 767 | 751 | 156.0 |
| A | 0 | 23 | 2253081 | 14439.29 | 767 | 751 | 156.0 |
| A | 12 | 189 | 248852 | 1590.53 | 767 | 751 | 156.0 |
| B | 4 | 239 | 621335 | 4109.84 | 788 | 769 | 151.0 |
| B | 11 | 51 | 75582 | 495.47 | 788 | 769 | 151.0 |
| B | 3 | 209 | 44493 | 289.57 | 788 | 769 | 151.0 |
| C | 13 | 61 | 5624 | 26.51 | 781 | 788 | 182.5 |
| C | 3 | 202 | 2024 | 6.77 | 781 | 788 | 182.5 |
| C | -1 | -1 | -1 | -1.0 | 781 | 788 | 182.5 |
| D | 1 | 52 | 468833 | 2512.6 | 777 | 757 | 186.3 |
| D | 8 | 195 | 54676 | 289.43 | 777 | 757 | 186.3 |
| D | 13 | 249 | 45319 | 239.2 | 777 | 757 | 186.3 |
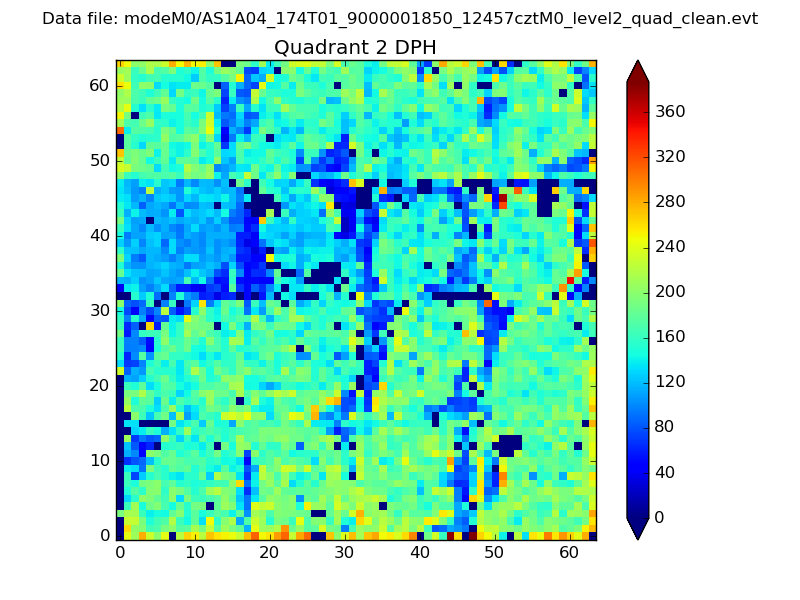
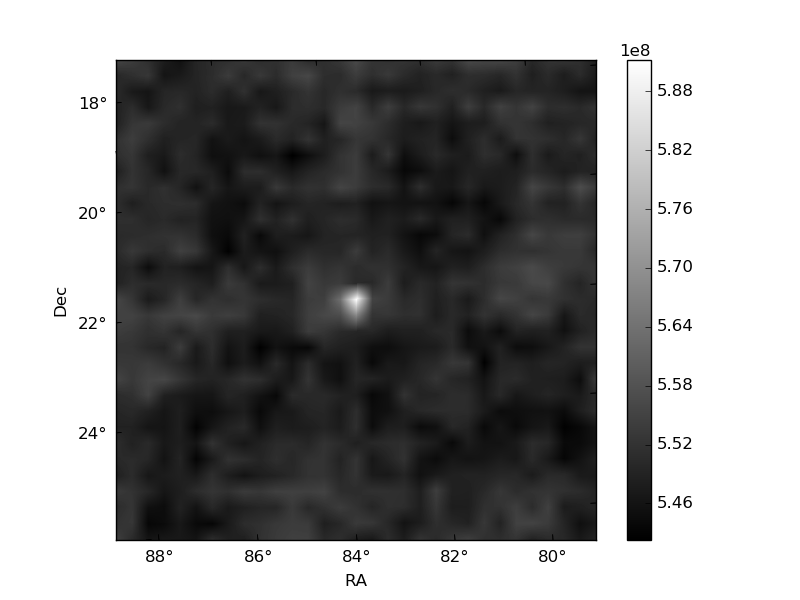
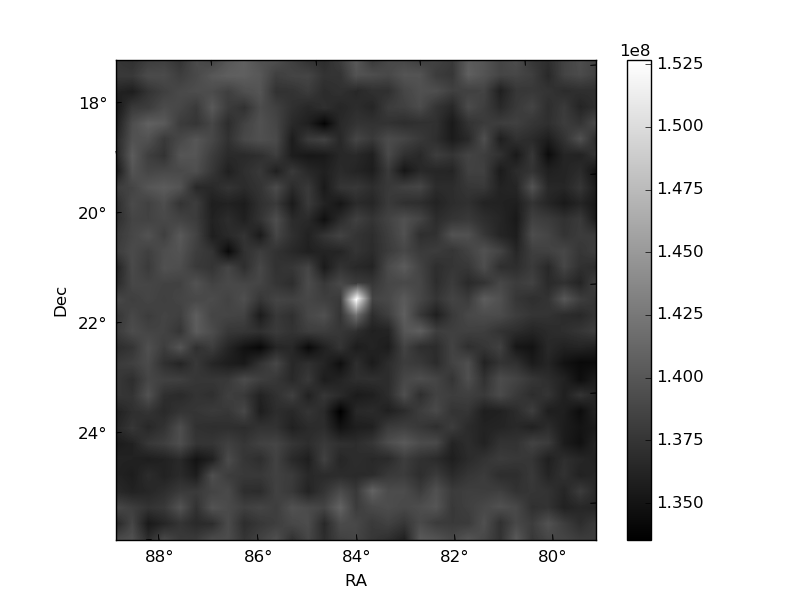
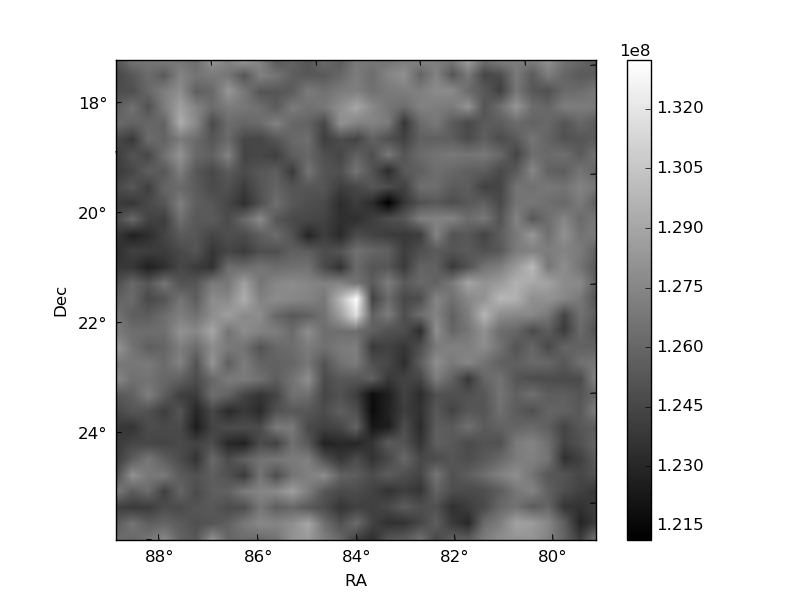
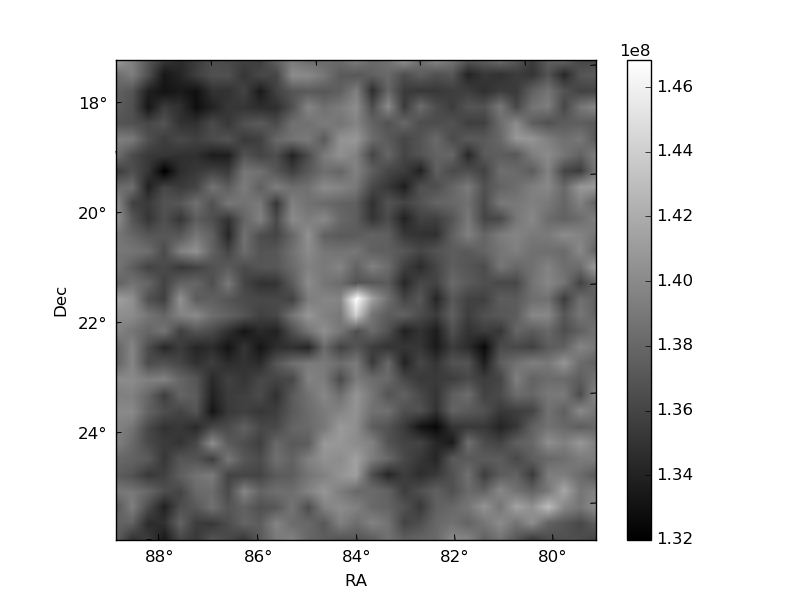
Histogram calculated using DETX and DETY for each event in the final _common_clean file
| Quadrant A | 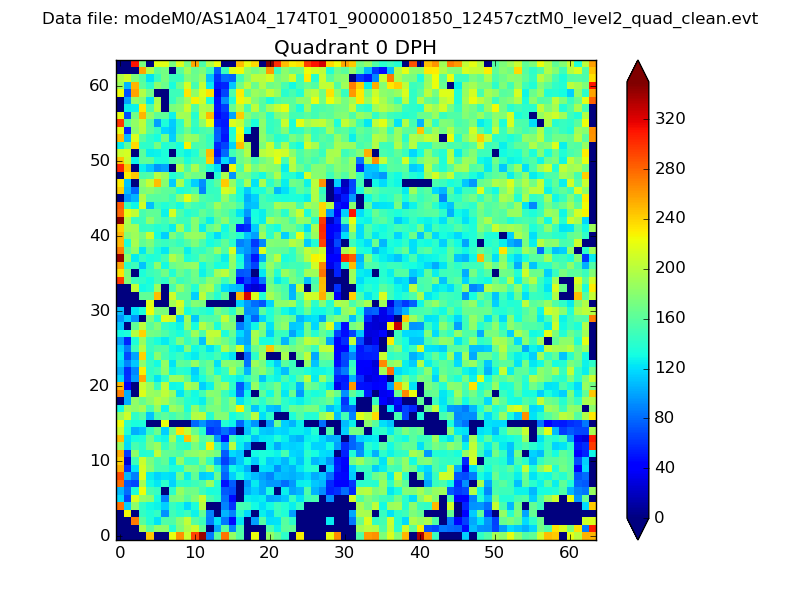 |
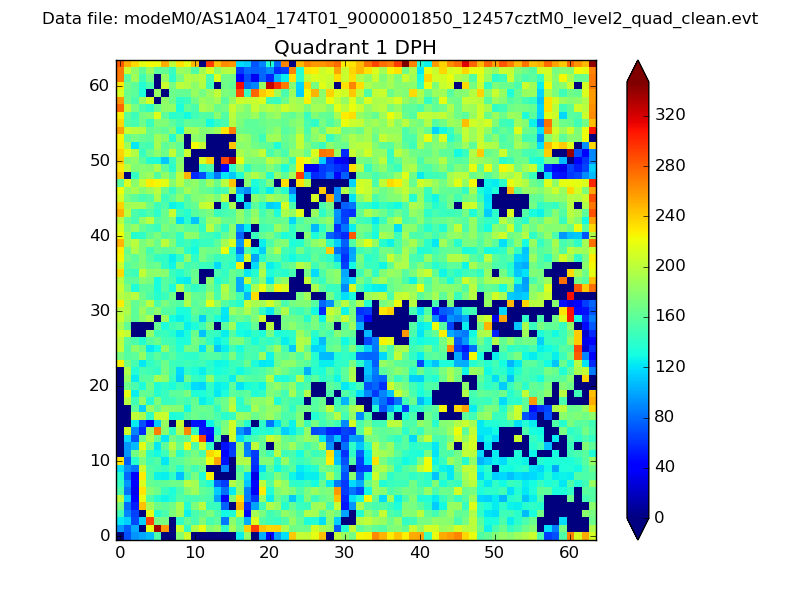 |
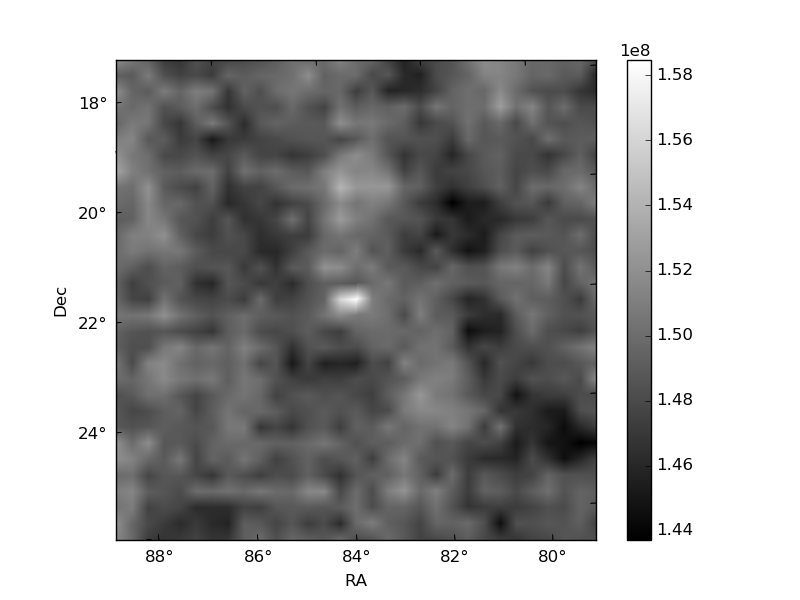
Quadrant B |
|---|---|---|---|
| Quadrant D | 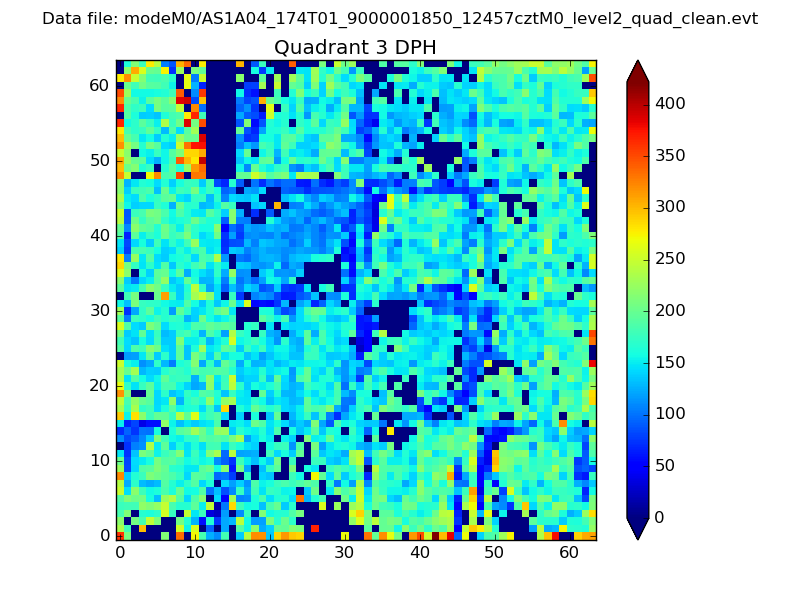 |
 |
Quadrant C |
| Plot type | Count rate plots | Images |
|---|---|---|
| Comparison with Poisson distribution Blue bars denote a histogram of data divided into 1 sec bins. Red curve is a Poisson curve with rate = median count rate of data. |
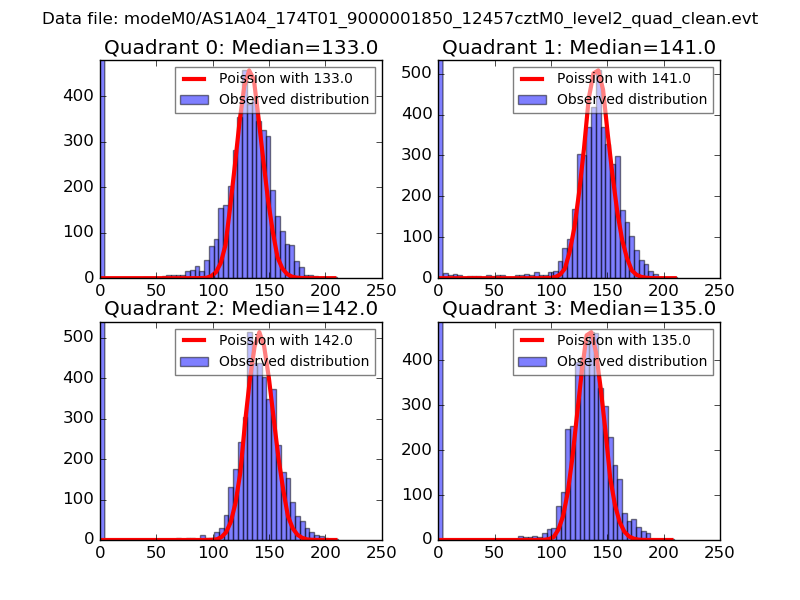 |
 |
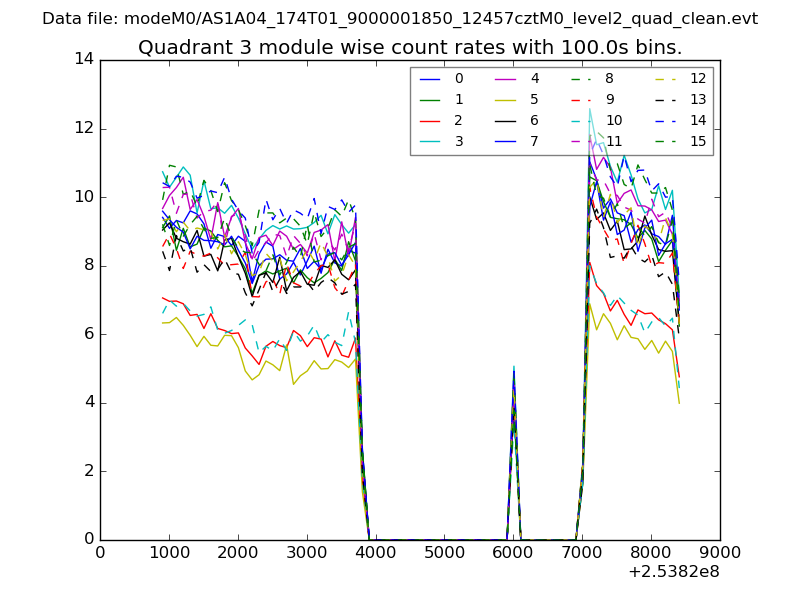
| Quadrant-wise count rates Data is divided into 100 sec bins |
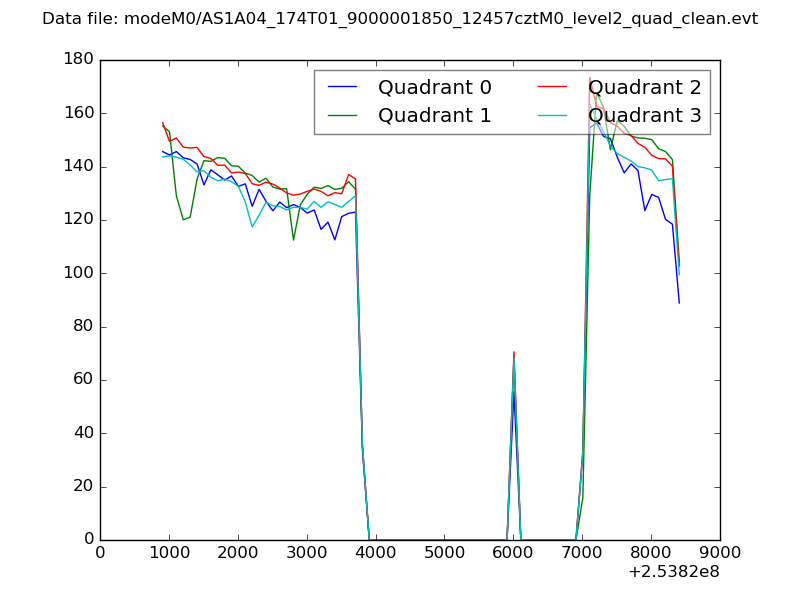 |
|
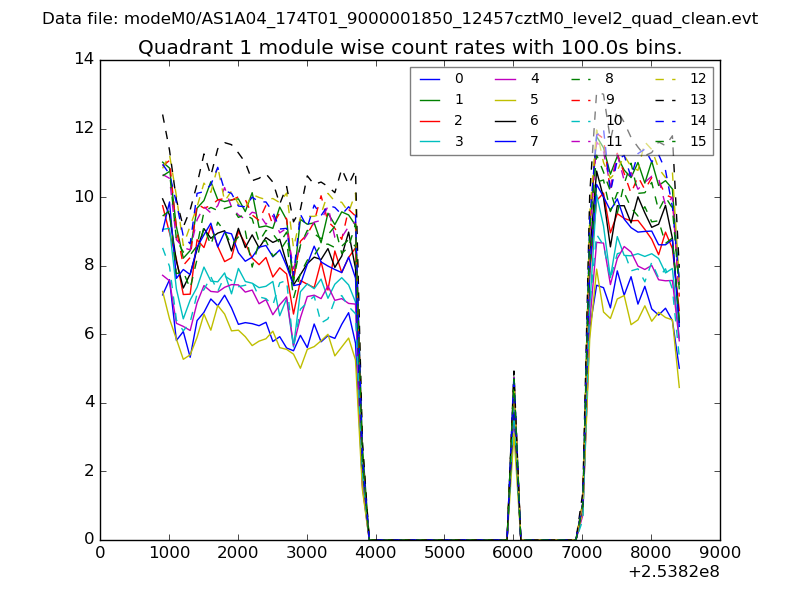
| Module-wise count rates for Quadrant A Data is divided into 100 sec bins |
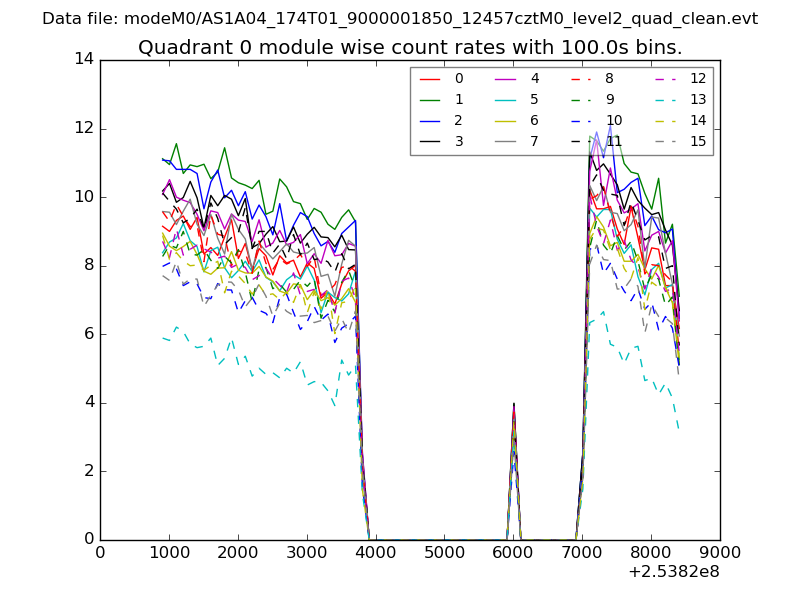 |
 |
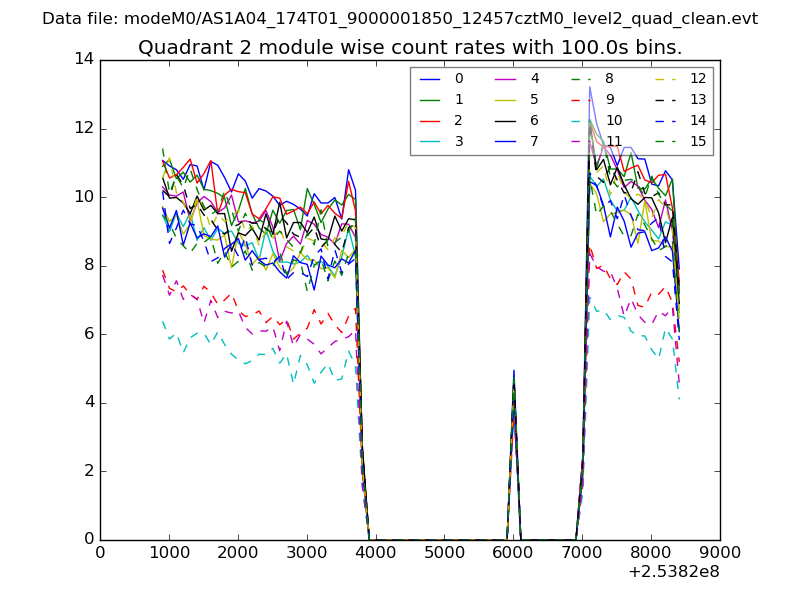
| Module-wise count rates for Quadrant B Data is divided into 100 sec bins |
 |
 |
| Module-wise count rates for Quadrant C Data is divided into 100 sec bins |
 |
 |
| Module-wise count rates for Quadrant D Data is divided into 100 sec bins |
 |
 |
| Parameter | Plot |
|---|---|
| CZT HV Monitor | 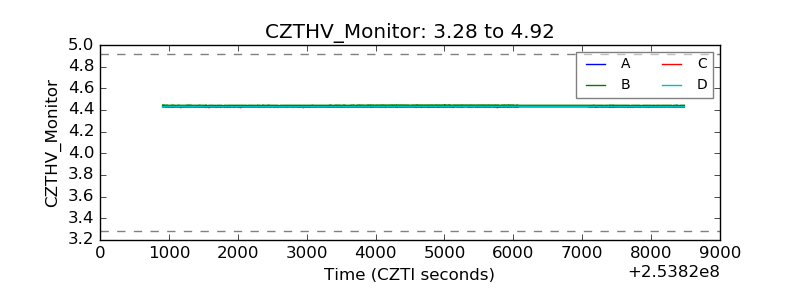 |
| D_VDD | 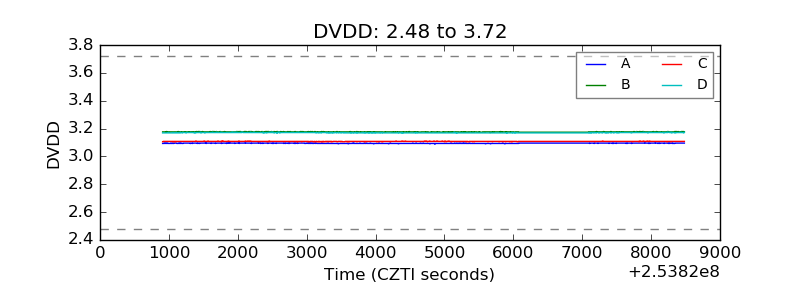 |
| Temperature 1 | 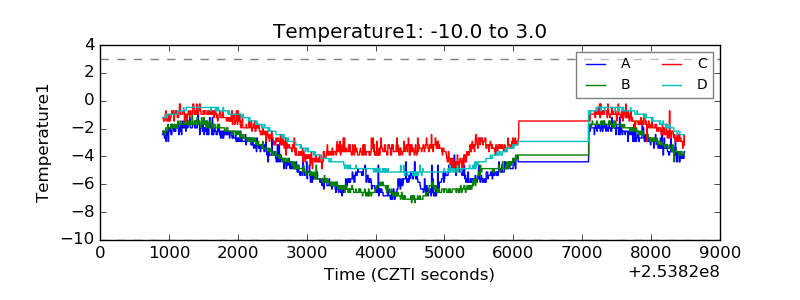 |
| Veto HV Monitor | 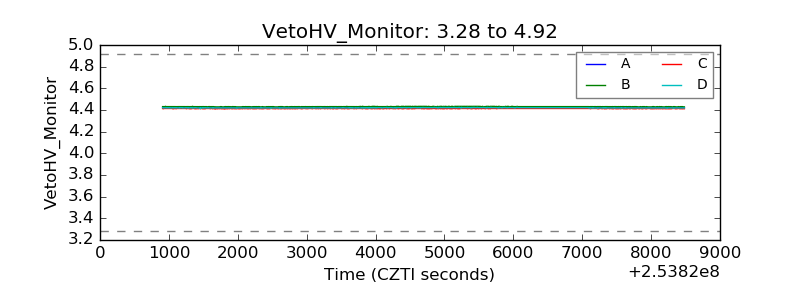 |
| Veto LLD | 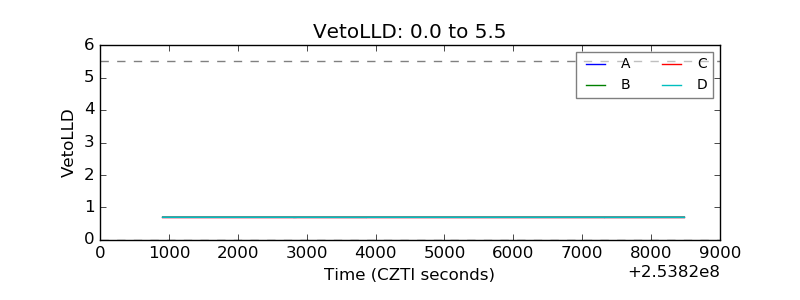 |
| Alpha Counter | 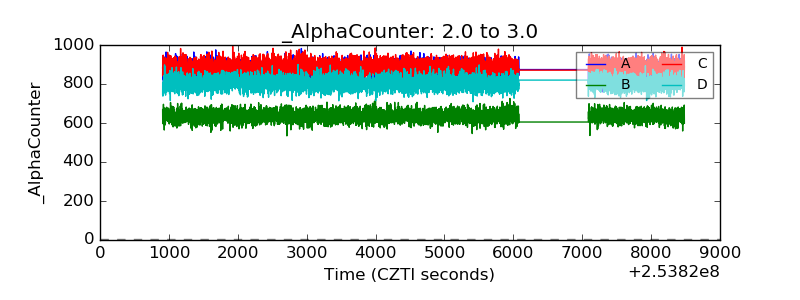 |
| _CPM_Rate | 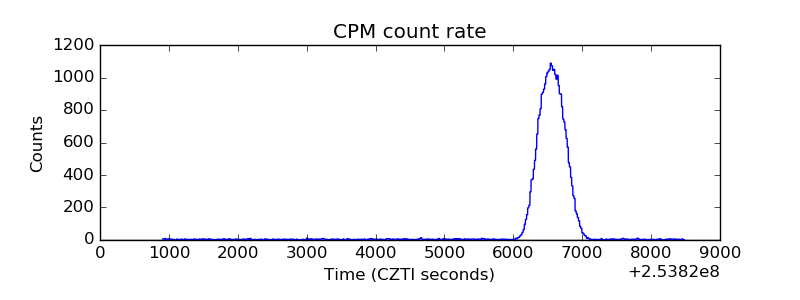 |
| CZT Counter | 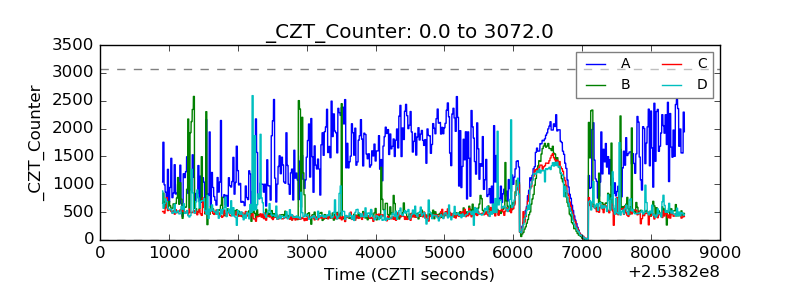 |
| +2.5 Volts monitor |  |
| +5 Volts monitor |  |
| _ROLL_ROT | 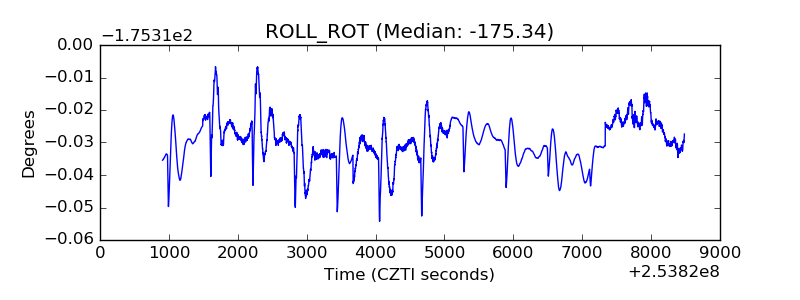 |
| _Roll_DEC | 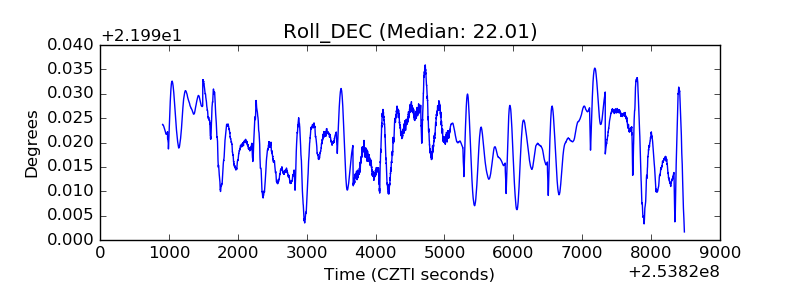 |
| _Roll_RA | 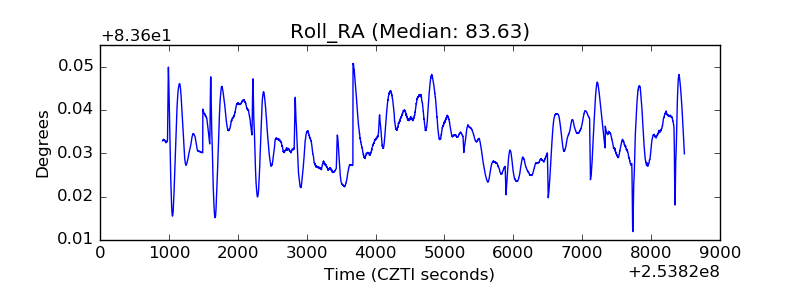 |
| Veto Counter | 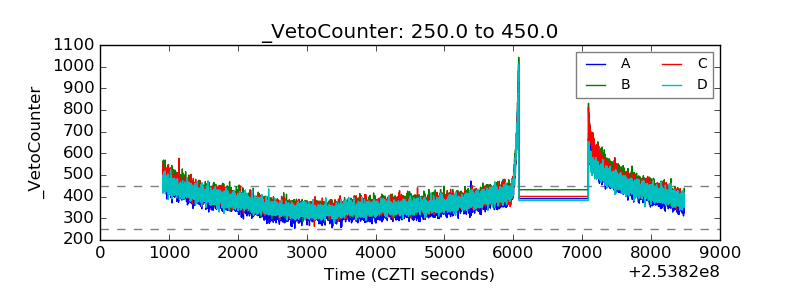 |