| Param | Original file | Final file |
|---|---|---|
| Filename | modeM0/AS1A04_174T01_9000001850_12459cztM0_level2.evt | modeM0/AS1A04_174T01_9000001850_12459cztM0_level2_quad_clean.evt |
| Size (bytes) | 647,712,000 | 85,155,840 |
| Size | 617.7 MB | 81.2 MB |
| Events in quadrant A | 9,225,379 | 489,244 |
| Events in quadrant B | 3,200,311 | 578,238 |
| Events in quadrant C | 2,808,582 | 568,257 |
| Events in quadrant D | 3,974,628 | 521,632 |
| Mode M0 | |||
|---|---|---|---|
| Quadrant | BADHDUFLAG | Total packets | Discarded packets |
| A | 0 | 31591 | 2 |
| B | 0 | 13378 | 1 |
| C | 0 | 12350 | 1 |
| D | 0 | 15942 | 1 |
| Mode M9 | |||
|---|---|---|---|
| Quadrant | BADHDUFLAG | Total packets | Discarded packets |
| A | 0 | 11 | 0 |
| B | 0 | 11 | 0 |
| C | 0 | 11 | 0 |
| D | 0 | 11 | 0 |
| Mode SS | |||
|---|---|---|---|
| Quadrant | BADHDUFLAG | Total packets | Discarded packets |
| A | 0 | 124 | 0 |
| B | 0 | 124 | 0 |
| C | 0 | 124 | 0 |
| D | 0 | 124 | 0 |
| Quadrant | Total seconds | Saturated seconds | Saturation percentage |
|---|---|---|---|
| A | 6016 | 1831 | 30.435505% |
| B | 6016 | 70 | 1.163564% |
| C | 6016 | 33 | 0.548537% |
| D | 6016 | 207 | 3.440824% |
Noise dominated data is calculated using 1-second bins in cleaned event files. If a bin has >2000 counts, and if more than 50% of those come from <1% of pixels, then it is considered to be noise-dominated and hence unusable.
| Quadrant | # 1 sec bins | Bins with >0 counts | Bins with >2000 counts | High rate bins dominated by noise | Noise dominated (total time) | Noise dominated (detector-on time) | Marked lightcurve |
|---|---|---|---|---|---|---|---|
| A | 7141 | 6017 | 1446 | 1446 | 20.25% | 24.03% | 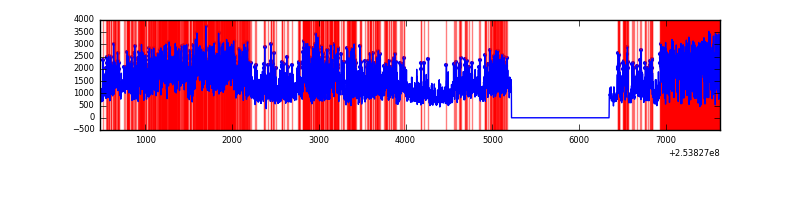 |
| B | 7142 | 6017 | 18 | 18 | 0.25% | 0.30% | 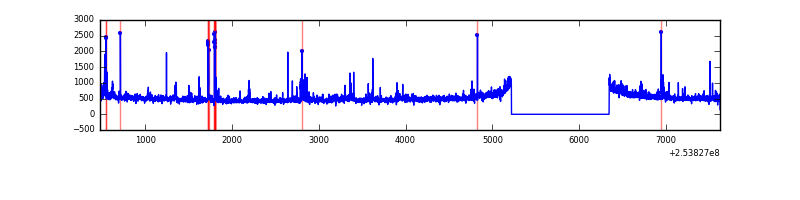 |
| C | 7142 | 6018 | 0 | 0 | 0.00% | 0.00% | 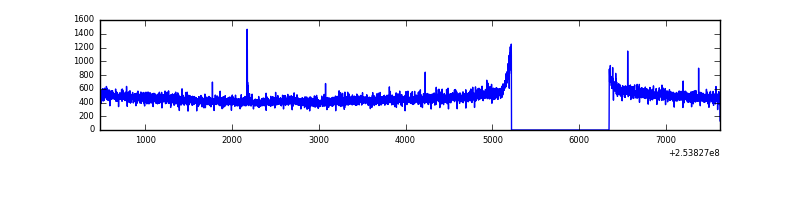 |
| D | 7142 | 6018 | 173 | 173 | 2.42% | 2.87% | 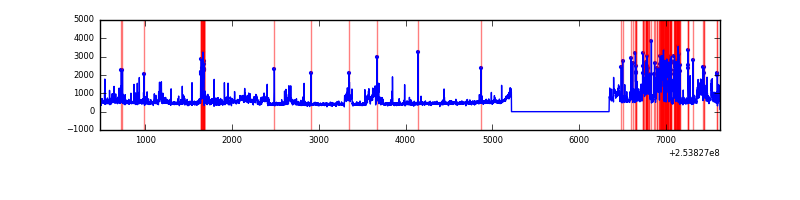 |
Top three noisy pixels from each quadrant. If the there are fewer than three noisy pixels in the level2.evt file, extra rows are filled as -1
| Pixel properties | Quadrant properties | ||||||
|---|---|---|---|---|---|---|---|
| Quadrant | DetID | PixID | Counts | Sigma | Mean | Median | Sigma |
| A | 13 | 251 | 5187358 | 37823.97 | 677 | 665 | 137.1 |
| A | 0 | 23 | 956551 | 6970.8 | 677 | 665 | 137.1 |
| A | 12 | 189 | 189254 | 1375.29 | 677 | 665 | 137.1 |
| B | 4 | 239 | 110304 | 788.65 | 741 | 727 | 138.9 |
| B | 11 | 51 | 52913 | 375.59 | 741 | 727 | 138.9 |
| B | 0 | 85 | 49146 | 348.48 | 741 | 727 | 138.9 |
| C | 14 | 234 | 5428 | 28.16 | 719 | 725 | 167.0 |
| C | 13 | 61 | 5190 | 26.73 | 719 | 725 | 167.0 |
| C | 12 | 4 | 1996 | 7.61 | 719 | 725 | 167.0 |
| D | 1 | 52 | 1157087 | 6799.66 | 707 | 691 | 170.1 |
| D | 8 | 195 | 56083 | 325.71 | 707 | 691 | 170.1 |
| D | 13 | 104 | 35505 | 204.71 | 707 | 691 | 170.1 |
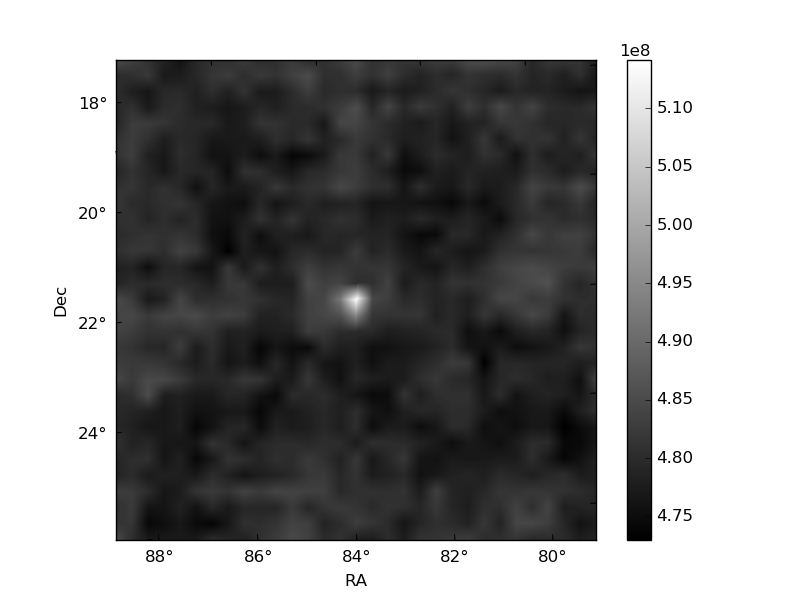
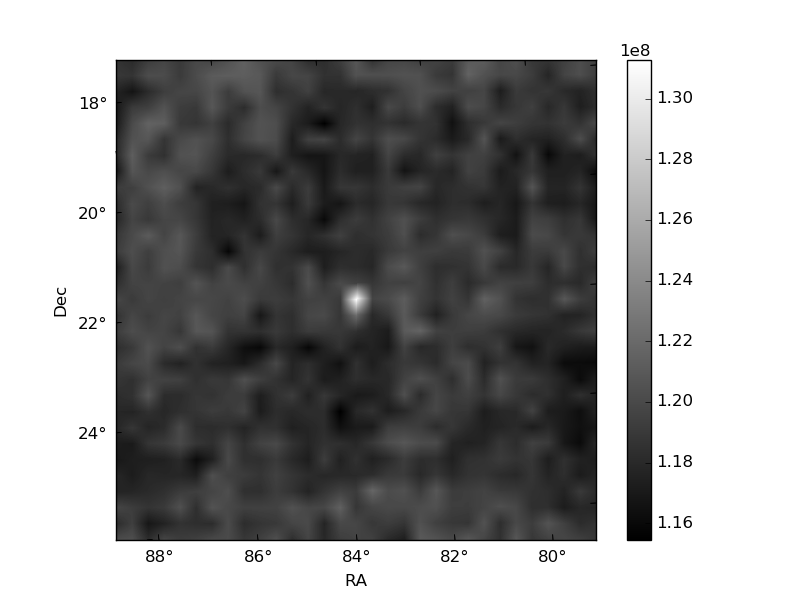
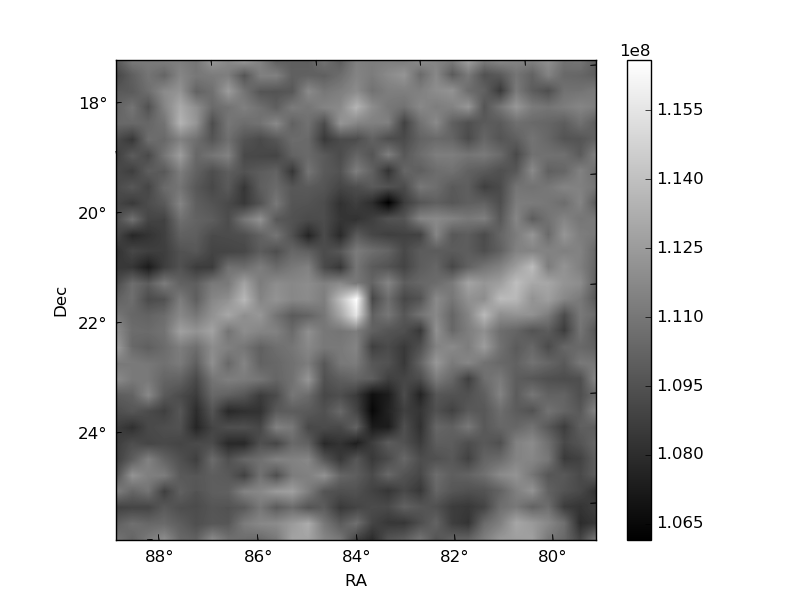
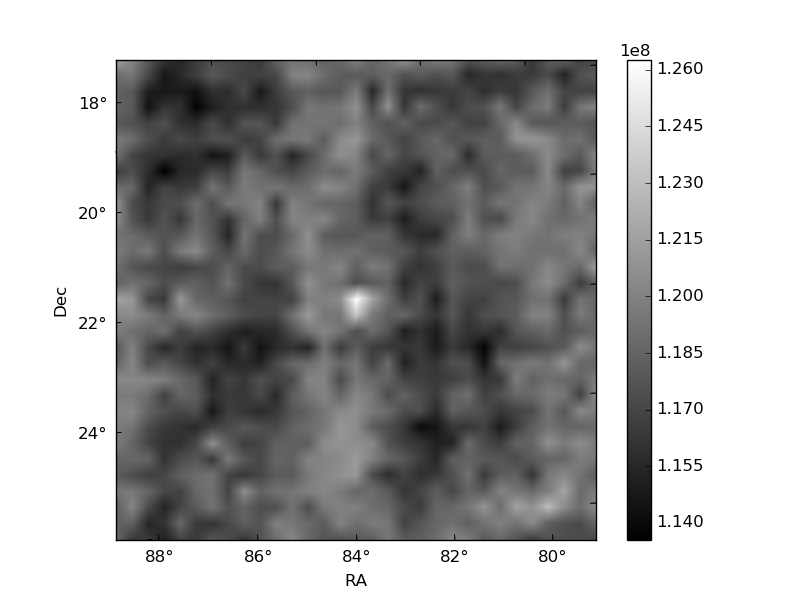
Histogram calculated using DETX and DETY for each event in the final _common_clean file
| Quadrant A | 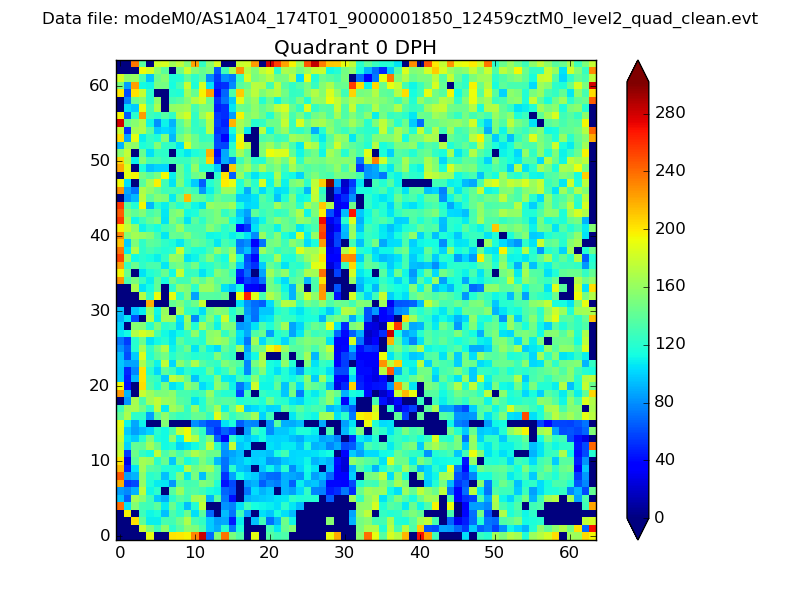 |
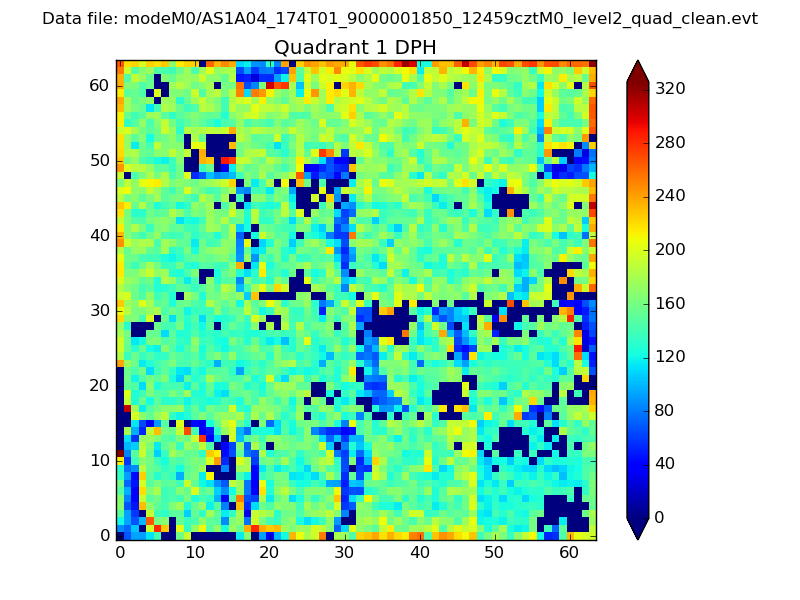 |
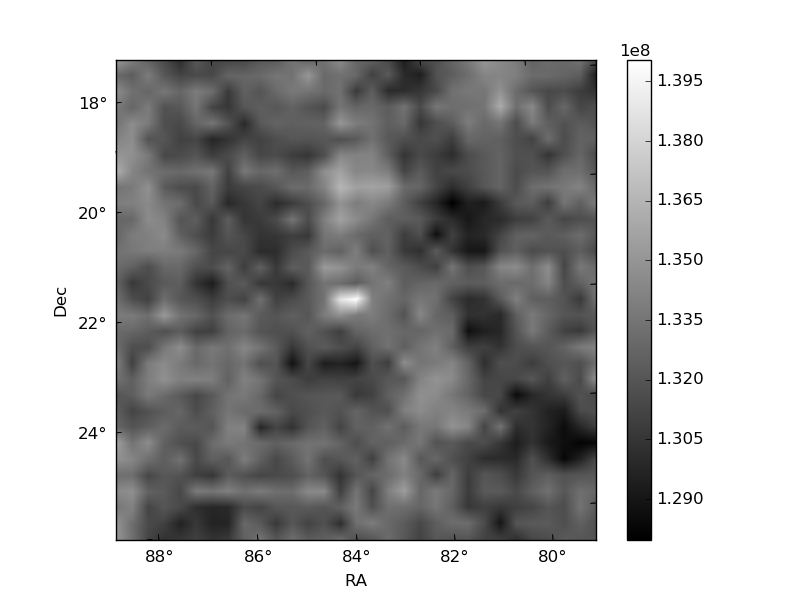
Quadrant B |
|---|---|---|---|
| Quadrant D | 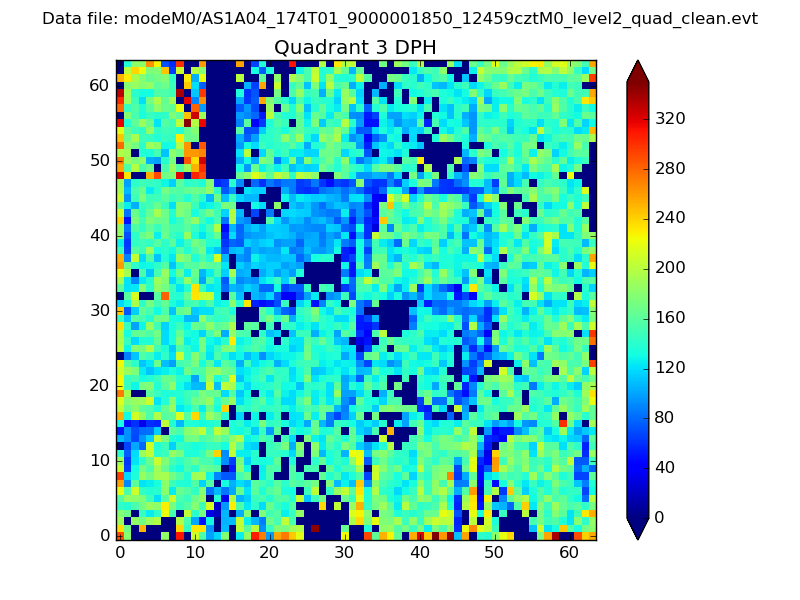 |
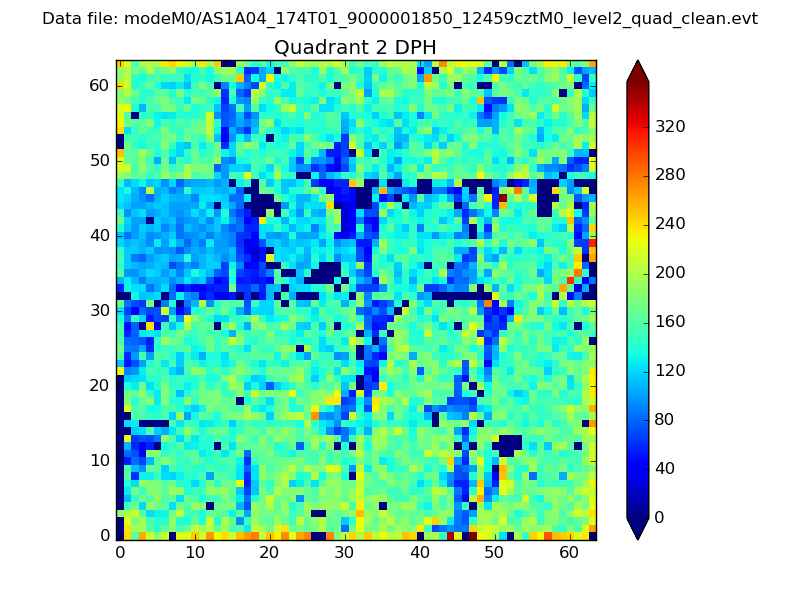 |
Quadrant C |
| Plot type | Count rate plots | Images |
|---|---|---|
| Comparison with Poisson distribution Blue bars denote a histogram of data divided into 1 sec bins. Red curve is a Poisson curve with rate = median count rate of data. |
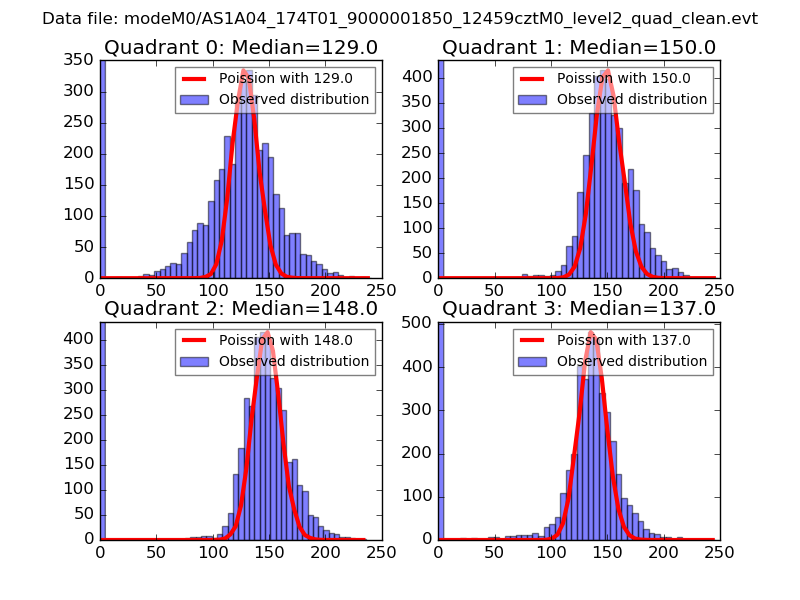 |
 |
| Quadrant-wise count rates Data is divided into 100 sec bins |
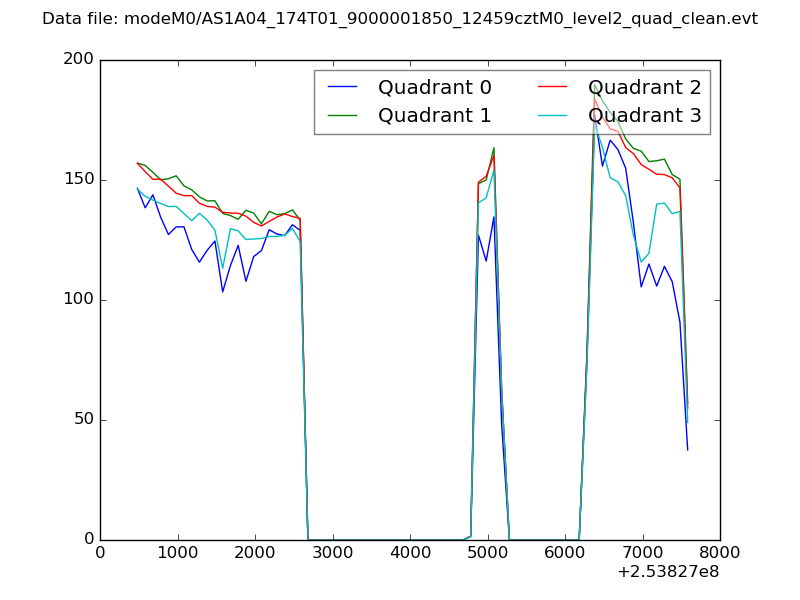 |
|
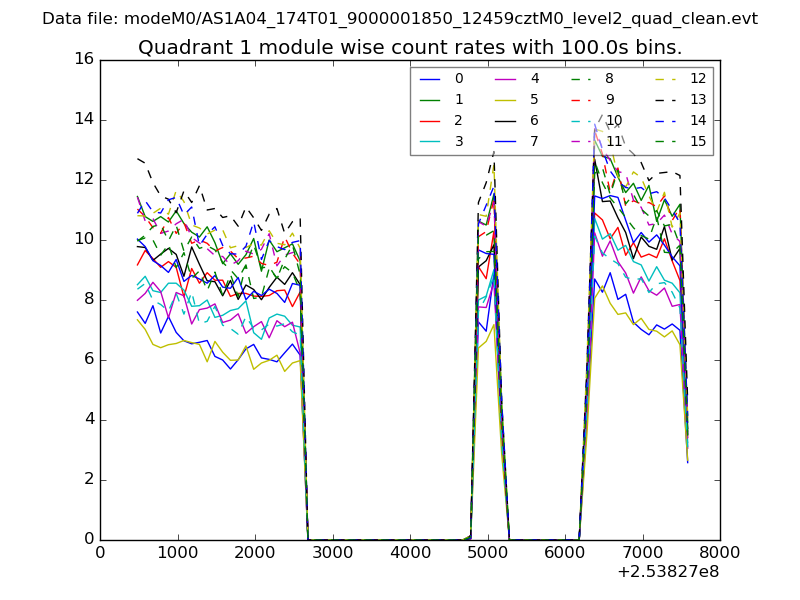
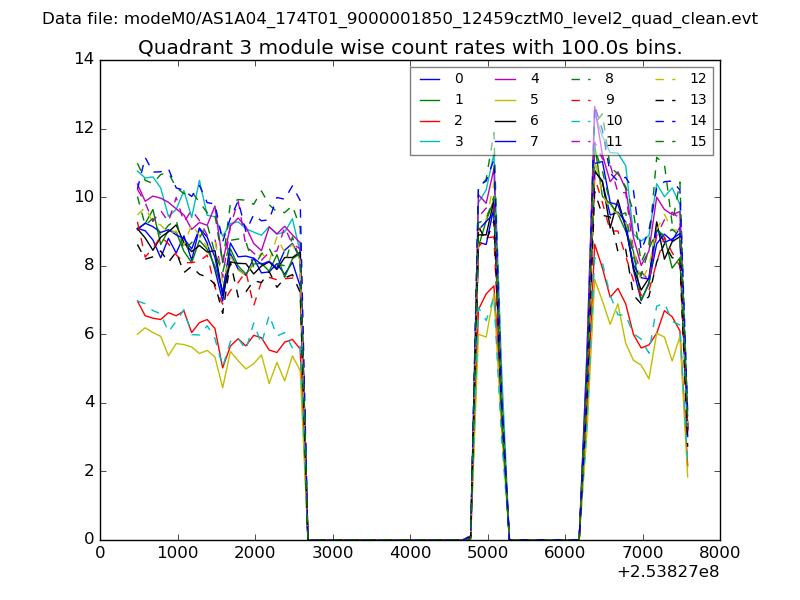
| Module-wise count rates for Quadrant A Data is divided into 100 sec bins |
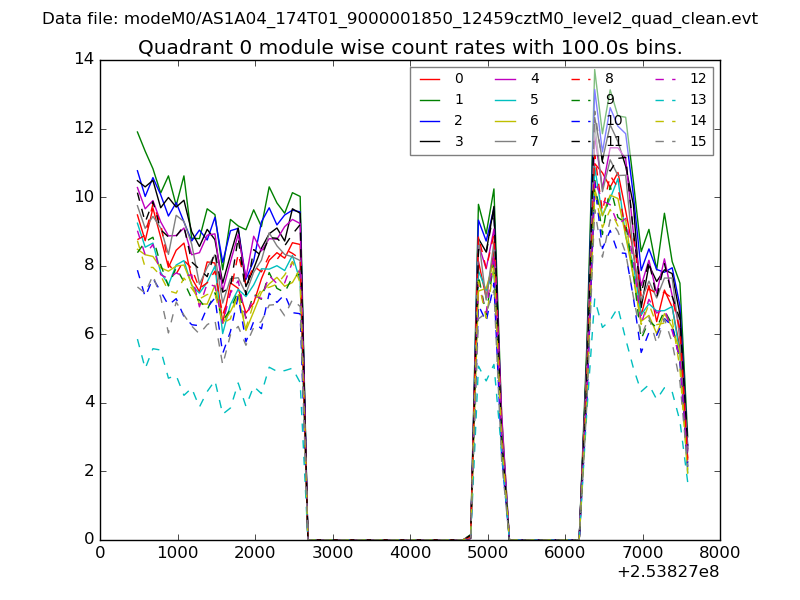 |
 |
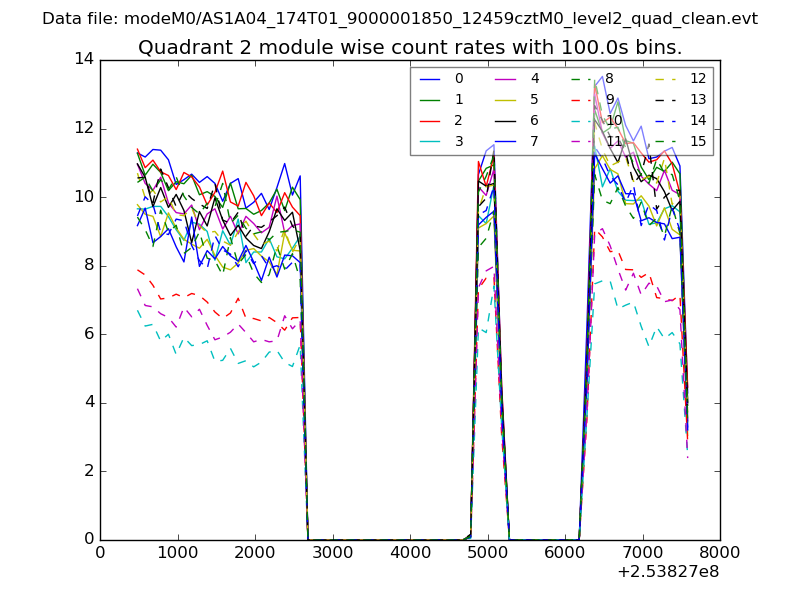
| Module-wise count rates for Quadrant B Data is divided into 100 sec bins |
 |
 |
| Module-wise count rates for Quadrant C Data is divided into 100 sec bins |
 |
 |
| Module-wise count rates for Quadrant D Data is divided into 100 sec bins |
 |
 |
| Parameter | Plot |
|---|---|
| CZT HV Monitor | 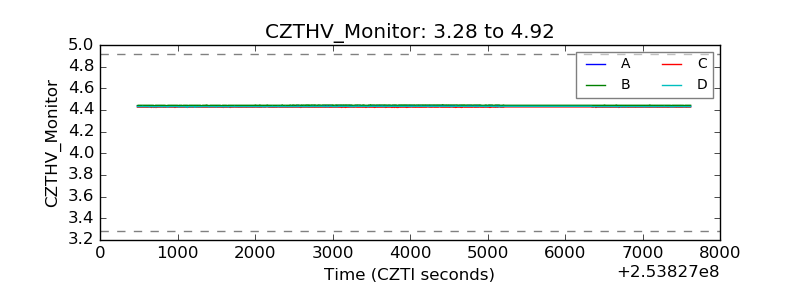 |
| D_VDD | 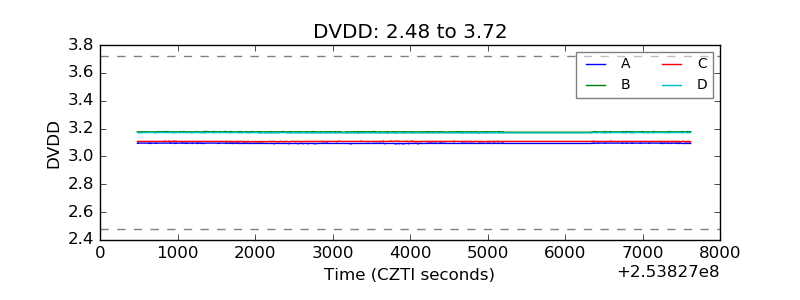 |
| Temperature 1 | 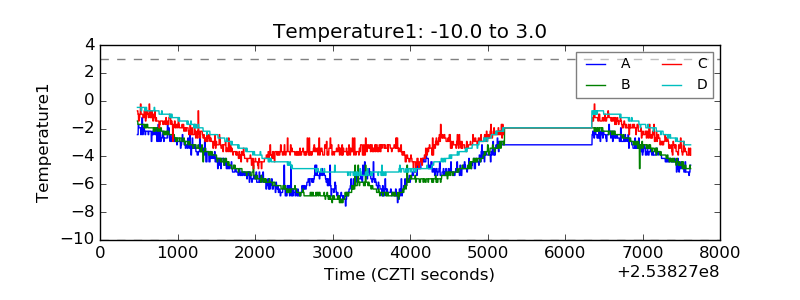 |
| Veto HV Monitor | 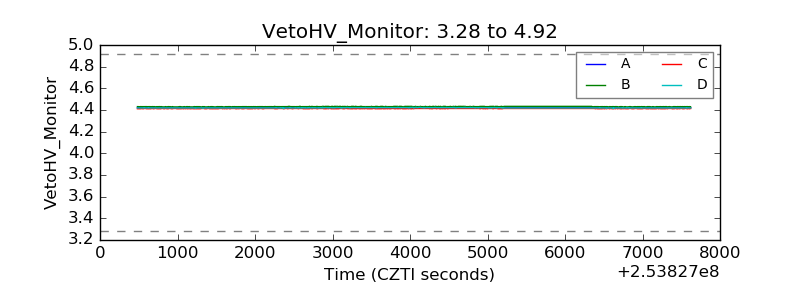 |
| Veto LLD | 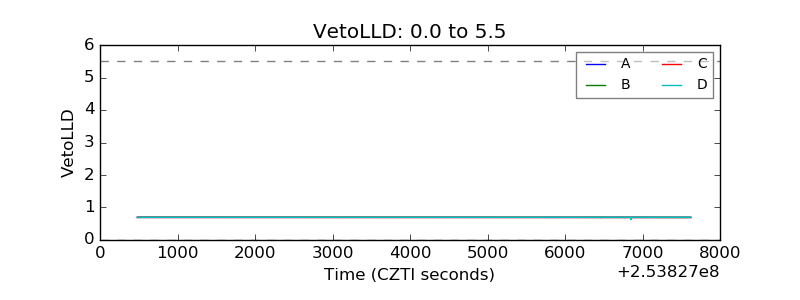 |
| Alpha Counter | 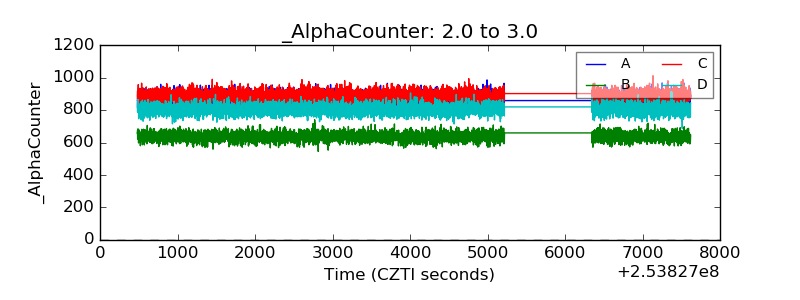 |
| _CPM_Rate |  |
| CZT Counter | 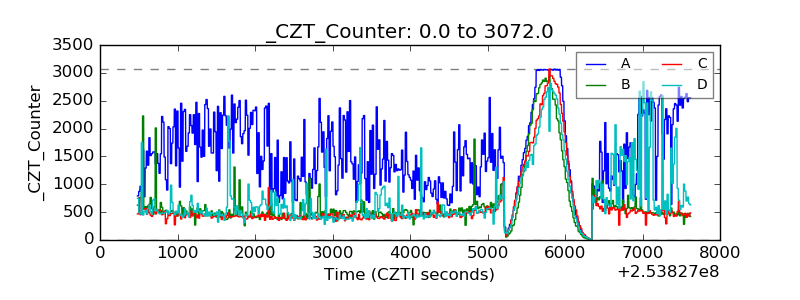 |
| +2.5 Volts monitor |  |
| +5 Volts monitor |  |
| _ROLL_ROT | 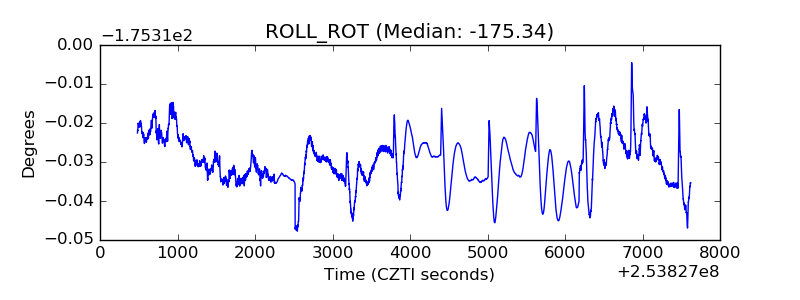 |
| _Roll_DEC | 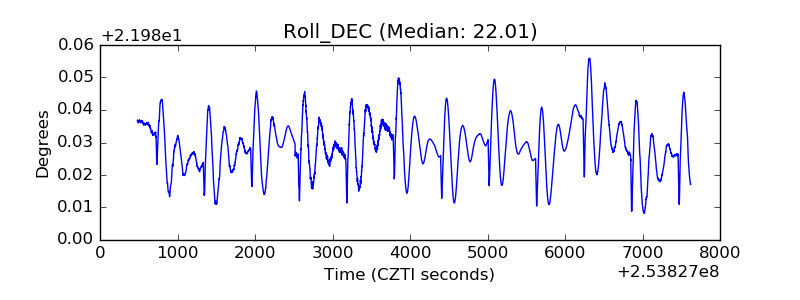 |
| _Roll_RA | 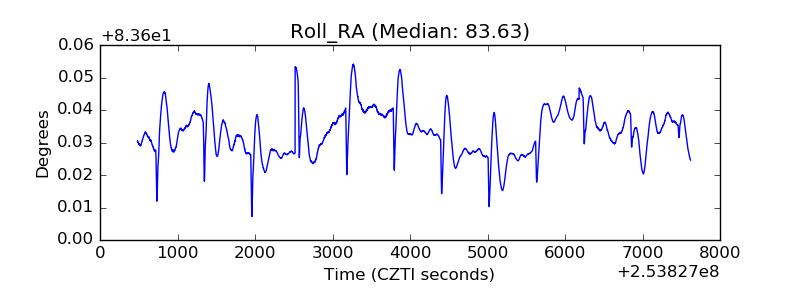 |
| Veto Counter | 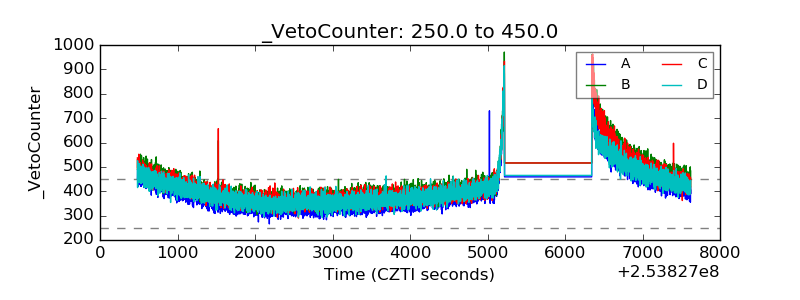 |