| Param | Original file | Final file |
|---|---|---|
| Filename | modeM0/AS1A04_174T01_9000001850_12461cztM0_level2.evt | modeM0/AS1A04_174T01_9000001850_12461cztM0_level2_quad_clean.evt |
| Size (bytes) | 646,591,680 | 94,734,720 |
| Size | 616.6 MB | 90.3 MB |
| Events in quadrant A | 8,379,462 | 543,082 |
| Events in quadrant B | 3,999,196 | 651,670 |
| Events in quadrant C | 3,033,882 | 646,379 |
| Events in quadrant D | 3,752,181 | 596,271 |
| Mode M0 | |||
|---|---|---|---|
| Quadrant | BADHDUFLAG | Total packets | Discarded packets |
| A | 0 | 29282 | 3 |
| B | 0 | 15884 | 2 |
| C | 0 | 12831 | 2 |
| D | 0 | 15280 | 2 |
| Mode M9 | |||
|---|---|---|---|
| Quadrant | BADHDUFLAG | Total packets | Discarded packets |
| A | 0 | 13 | 0 |
| B | 0 | 13 | 0 |
| C | 0 | 13 | 0 |
| D | 0 | 13 | 0 |
| Mode SS | |||
|---|---|---|---|
| Quadrant | BADHDUFLAG | Total packets | Discarded packets |
| A | 0 | 126 | 0 |
| B | 0 | 126 | 0 |
| C | 0 | 126 | 0 |
| D | 0 | 126 | 0 |
| Quadrant | Total seconds | Saturated seconds | Saturation percentage |
|---|---|---|---|
| A | 6167 | 1805 | 29.268688% |
| B | 6167 | 225 | 3.648451% |
| C | 6167 | 12 | 0.194584% |
| D | 6167 | 98 | 1.589103% |
Noise dominated data is calculated using 1-second bins in cleaned event files. If a bin has >2000 counts, and if more than 50% of those come from <1% of pixels, then it is considered to be noise-dominated and hence unusable.
| Quadrant | # 1 sec bins | Bins with >0 counts | Bins with >2000 counts | High rate bins dominated by noise | Noise dominated (total time) | Noise dominated (detector-on time) | Marked lightcurve |
|---|---|---|---|---|---|---|---|
| A | 7497 | 6167 | 1589 | 1589 | 21.20% | 25.77% | 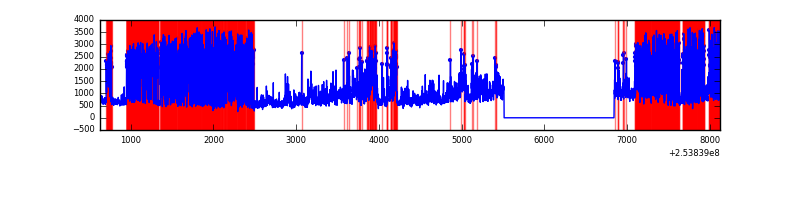 |
| B | 7498 | 6169 | 122 | 122 | 1.63% | 1.98% | 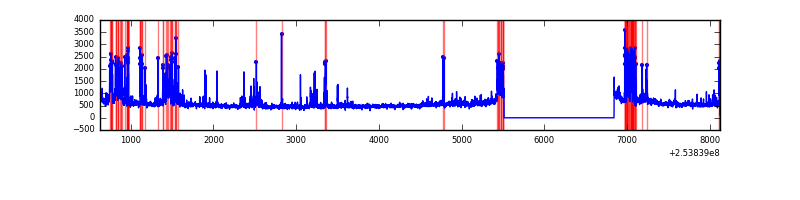 |
| C | 7498 | 6169 | 0 | 0 | 0.00% | 0.00% | 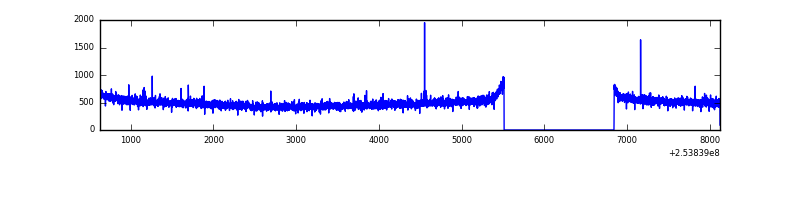 |
| D | 7498 | 6168 | 87 | 87 | 1.16% | 1.41% | 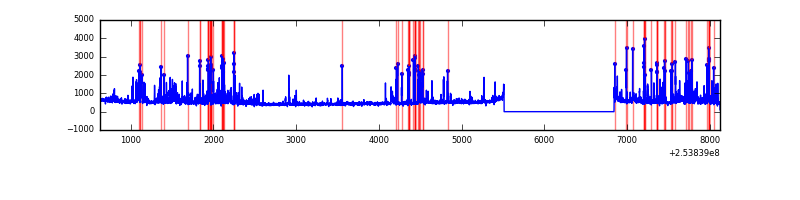 |
Top three noisy pixels from each quadrant. If the there are fewer than three noisy pixels in the level2.evt file, extra rows are filled as -1
| Pixel properties | Quadrant properties | ||||||
|---|---|---|---|---|---|---|---|
| Quadrant | DetID | PixID | Counts | Sigma | Mean | Median | Sigma |
| A | 0 | 23 | 3268212 | 22093.41 | 725 | 713 | 147.9 |
| A | 13 | 251 | 1740767 | 11765.49 | 725 | 713 | 147.9 |
| A | 0 | 226 | 247073 | 1665.78 | 725 | 713 | 147.9 |
| B | 4 | 239 | 700222 | 4716.6 | 792 | 776 | 148.3 |
| B | 0 | 219 | 72500 | 483.66 | 792 | 776 | 148.3 |
| B | 11 | 51 | 39393 | 260.41 | 792 | 776 | 148.3 |
| C | 13 | 61 | 5741 | 27.68 | 777 | 785 | 179.0 |
| C | 14 | 234 | 4544 | 20.99 | 777 | 785 | 179.0 |
| C | 12 | 4 | 3561 | 15.5 | 777 | 785 | 179.0 |
| D | 1 | 52 | 648874 | 3543.09 | 759 | 741 | 182.9 |
| D | 13 | 104 | 111678 | 606.45 | 759 | 741 | 182.9 |
| D | 13 | 249 | 57822 | 312.04 | 759 | 741 | 182.9 |
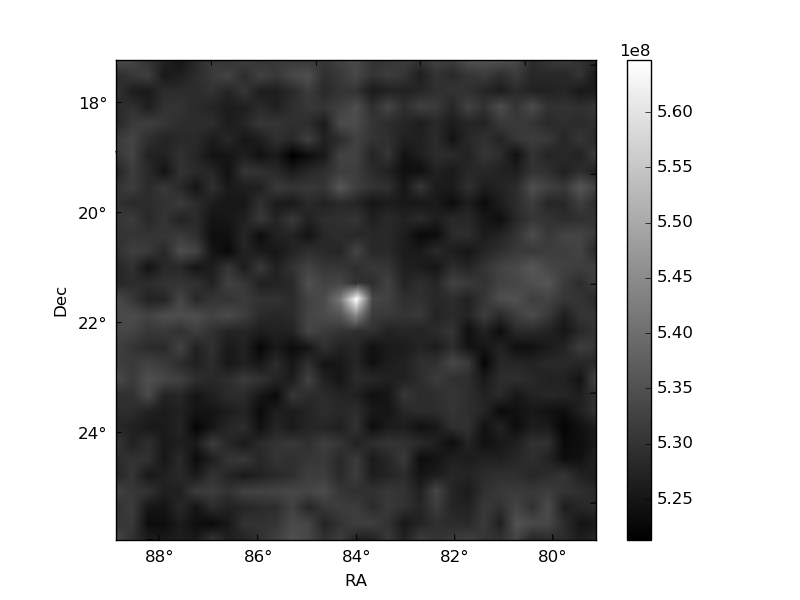
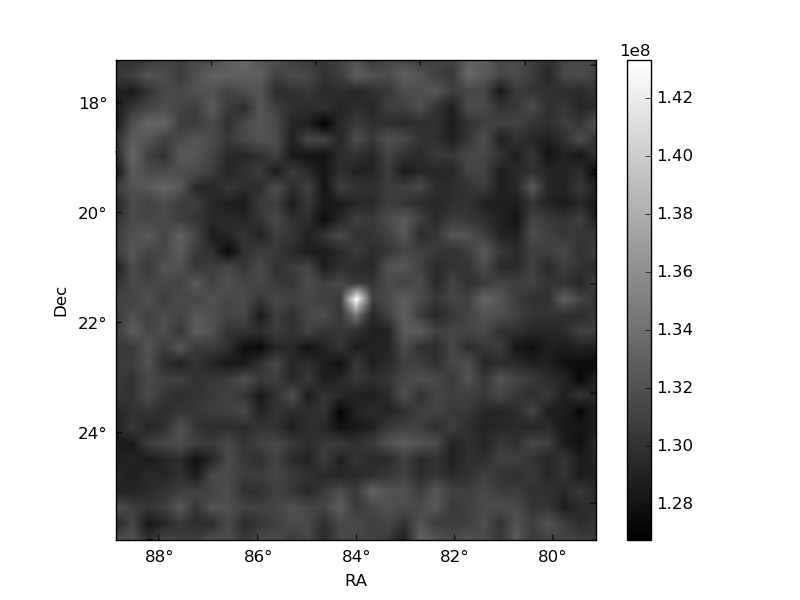
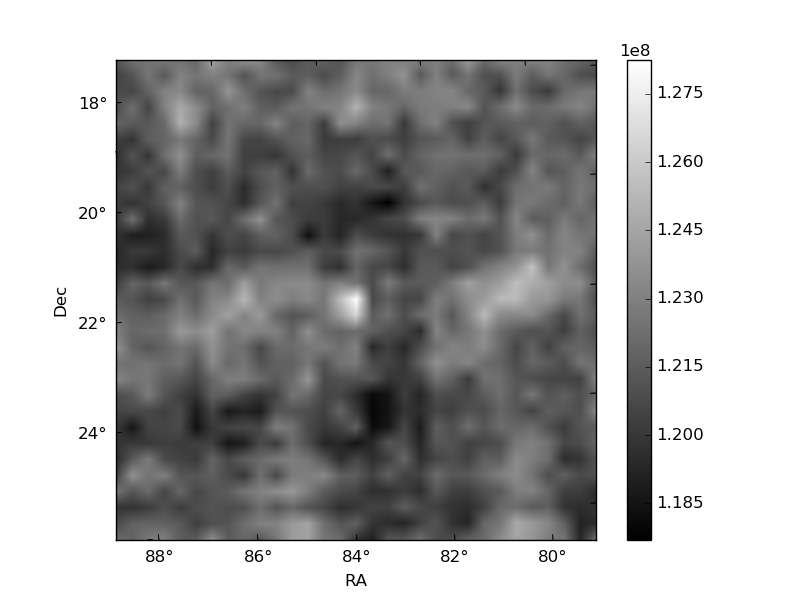
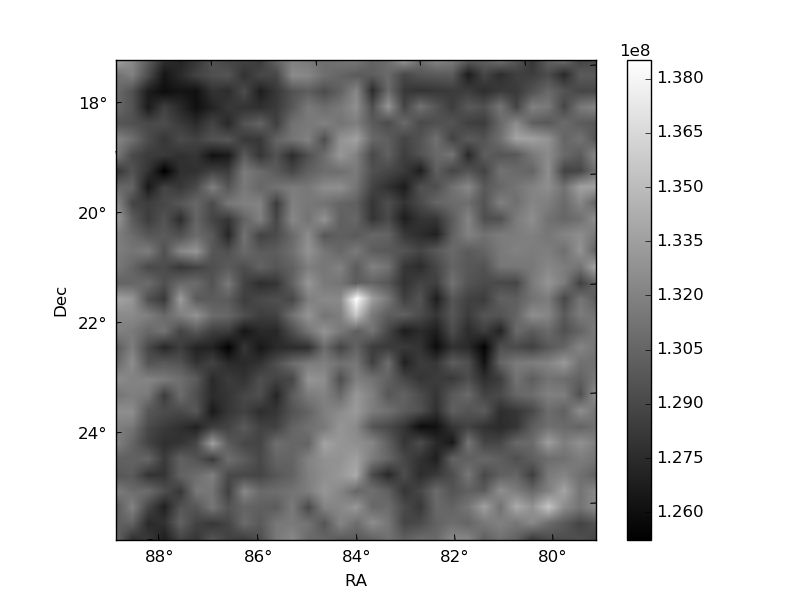
Histogram calculated using DETX and DETY for each event in the final _common_clean file
| Quadrant A | 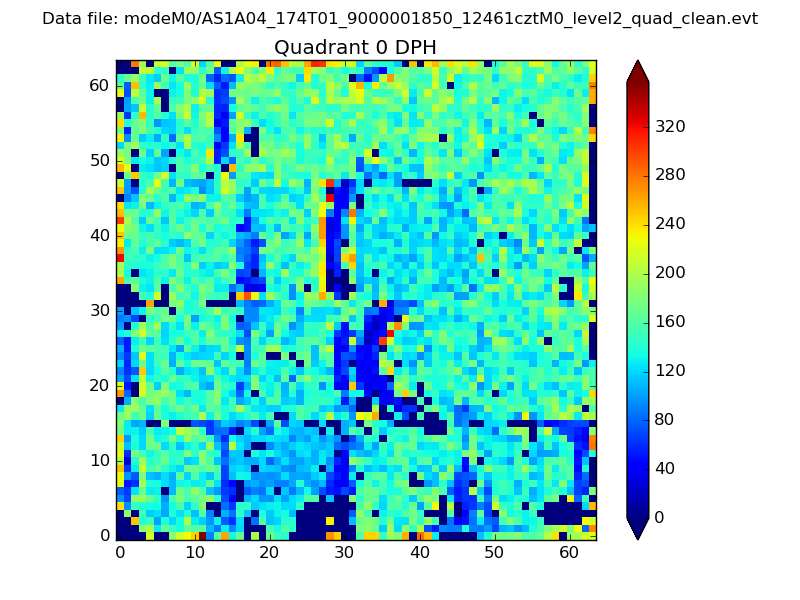 |
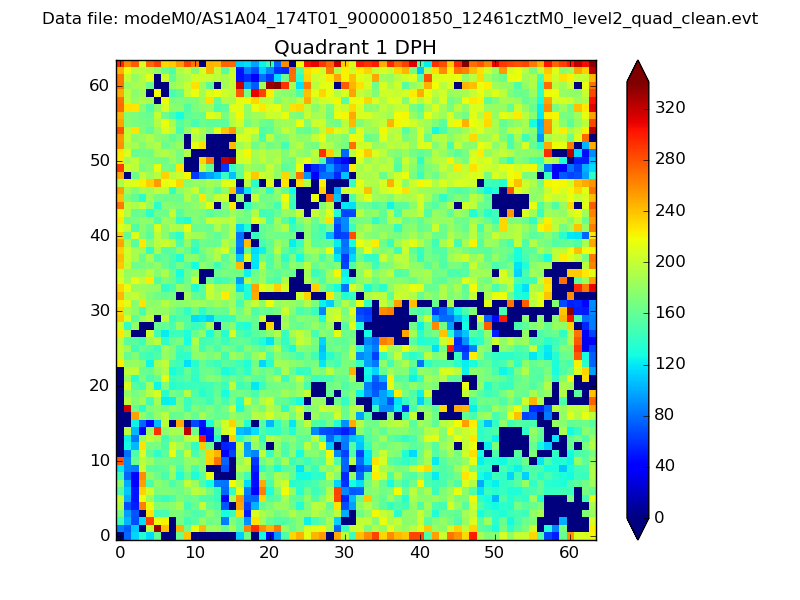 |
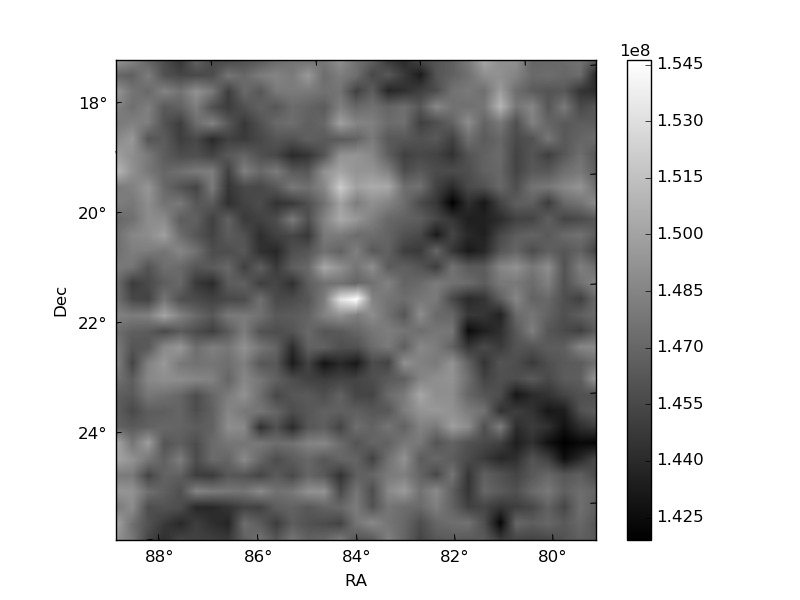
Quadrant B |
|---|---|---|---|
| Quadrant D | 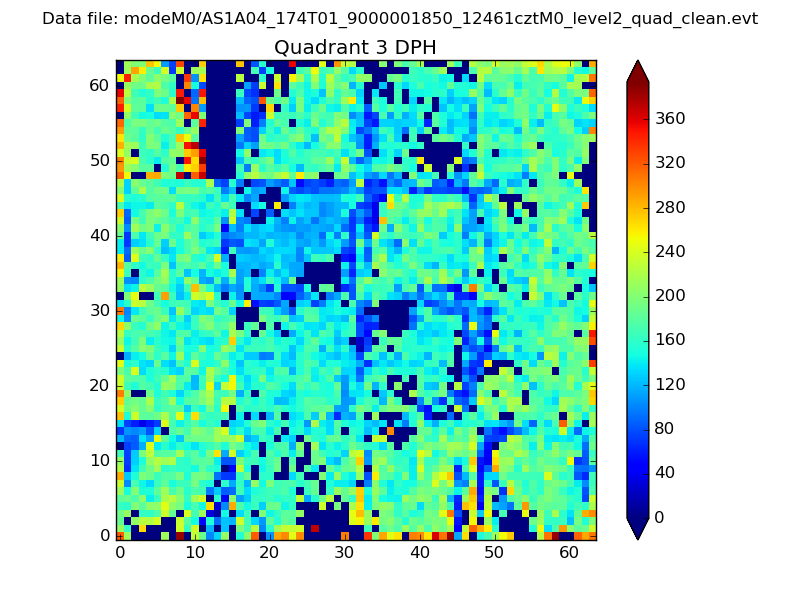 |
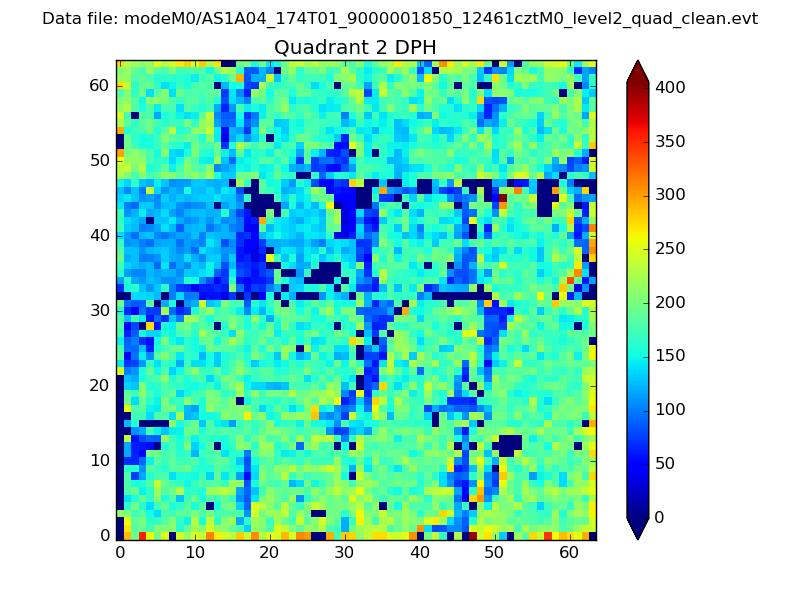 |
Quadrant C |
| Plot type | Count rate plots | Images |
|---|---|---|
| Comparison with Poisson distribution Blue bars denote a histogram of data divided into 1 sec bins. Red curve is a Poisson curve with rate = median count rate of data. |
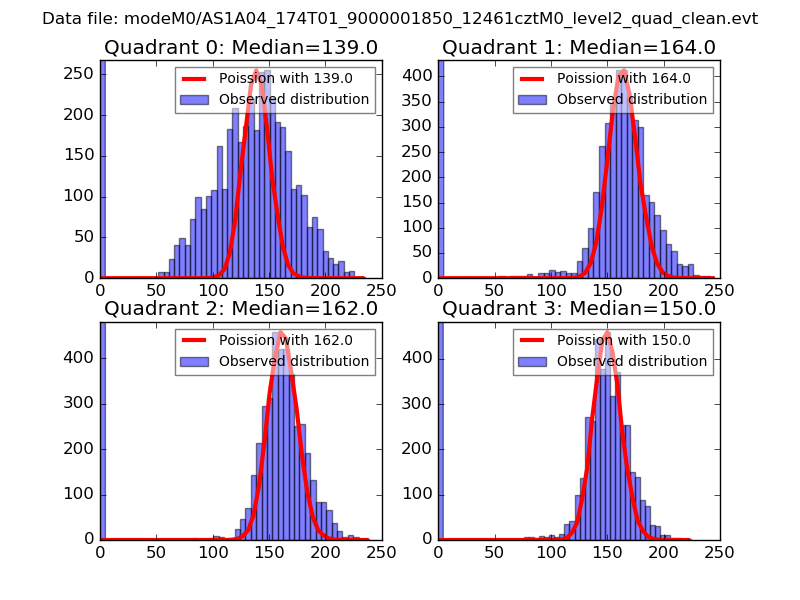 |
 |
| Quadrant-wise count rates Data is divided into 100 sec bins |
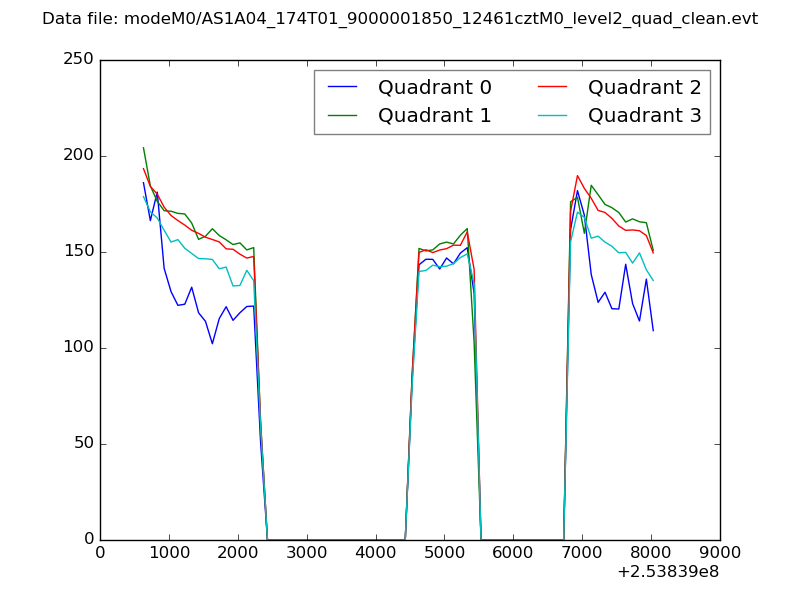 |
|
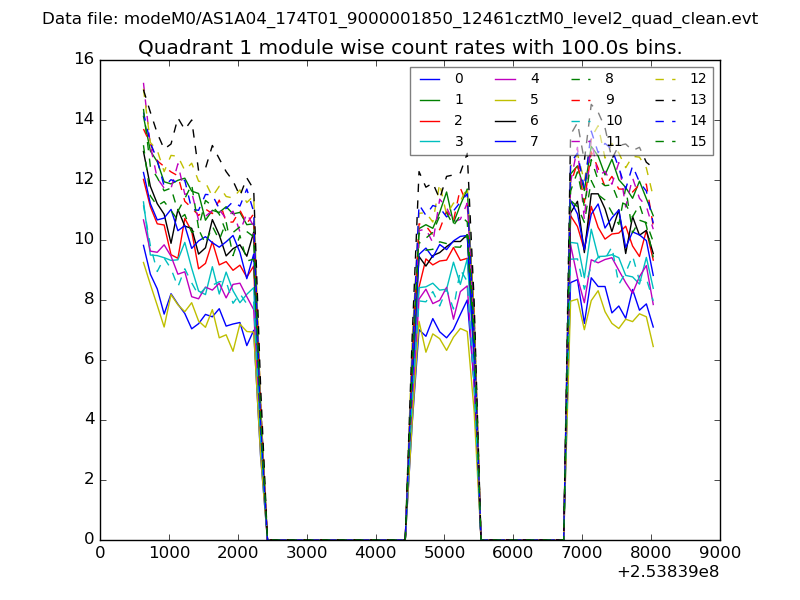
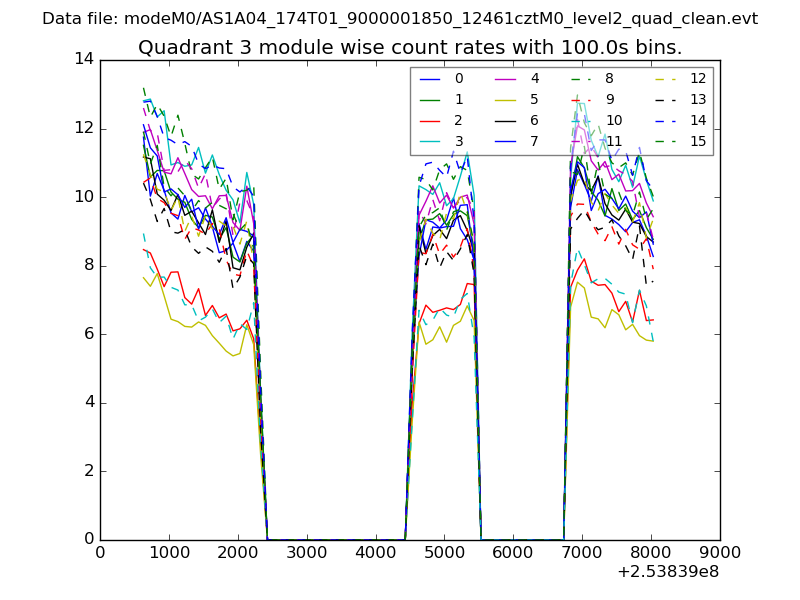
| Module-wise count rates for Quadrant A Data is divided into 100 sec bins |
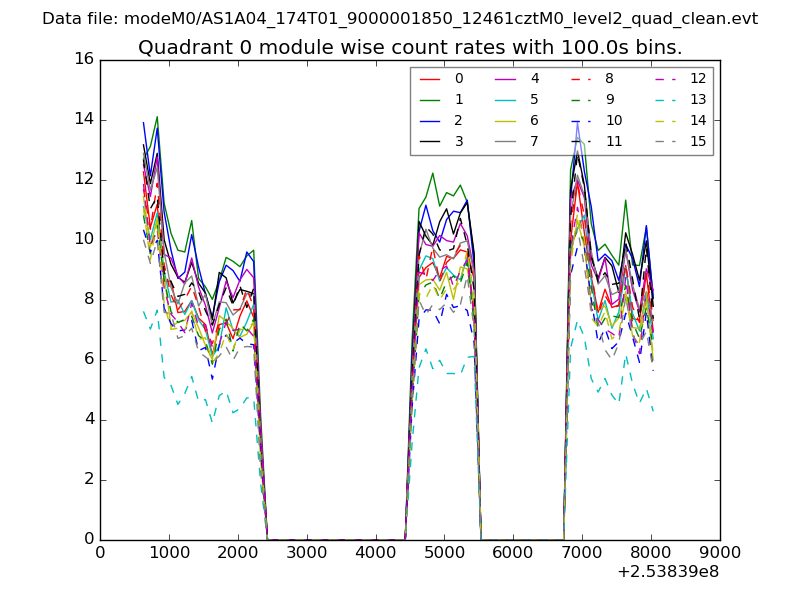 |
 |
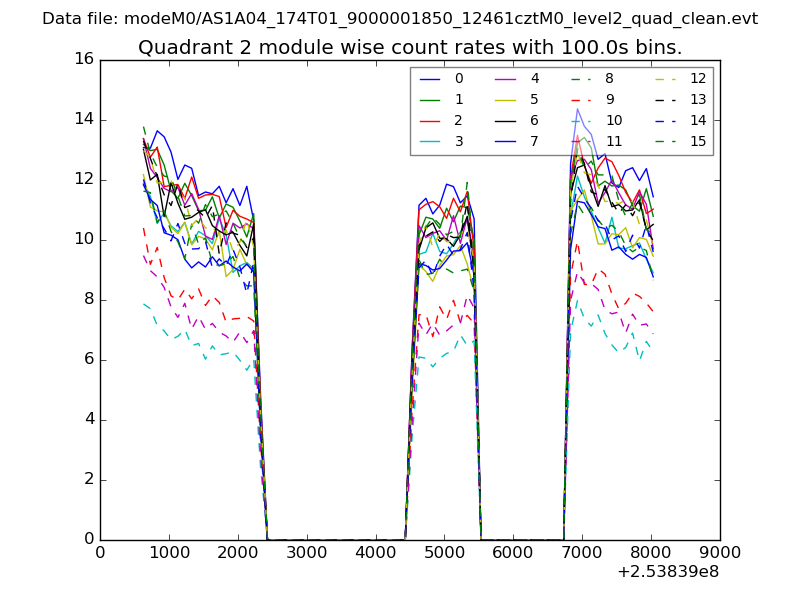
| Module-wise count rates for Quadrant B Data is divided into 100 sec bins |
 |
 |
| Module-wise count rates for Quadrant C Data is divided into 100 sec bins |
 |
 |
| Module-wise count rates for Quadrant D Data is divided into 100 sec bins |
 |
 |
| Parameter | Plot |
|---|---|
| CZT HV Monitor | 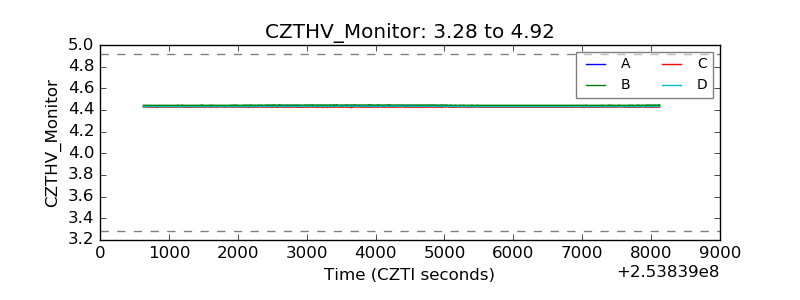 |
| D_VDD | 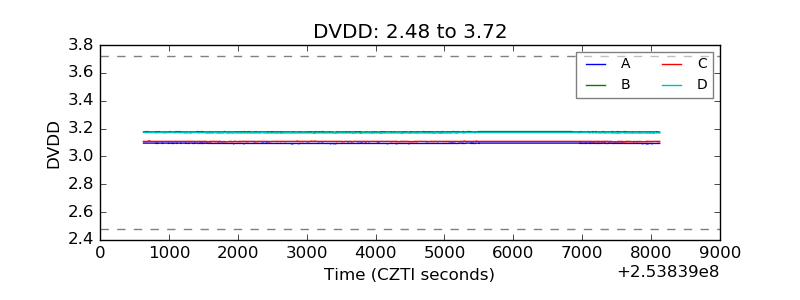 |
| Temperature 1 | 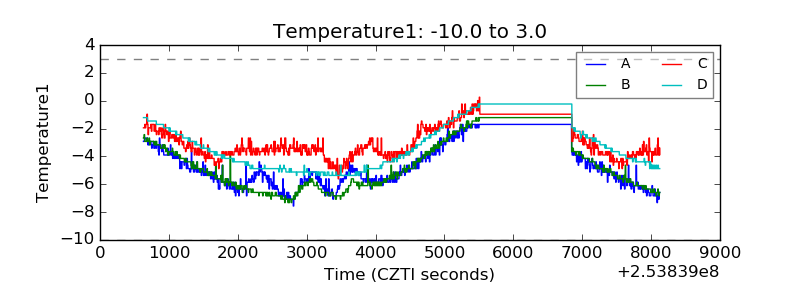 |
| Veto HV Monitor | 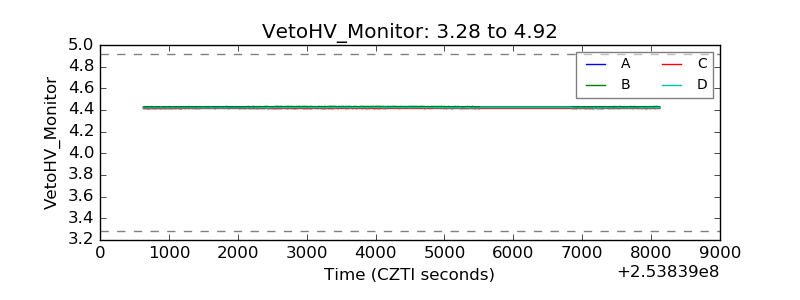 |
| Veto LLD | 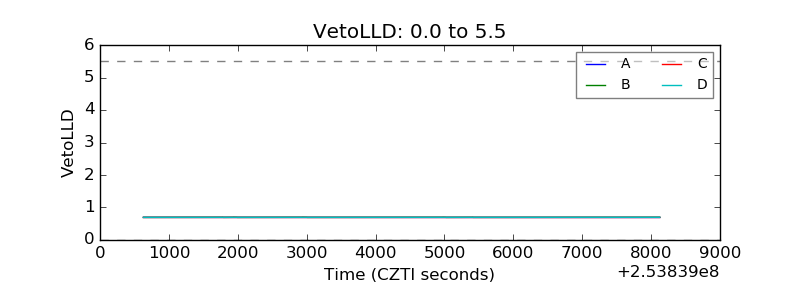 |
| Alpha Counter | 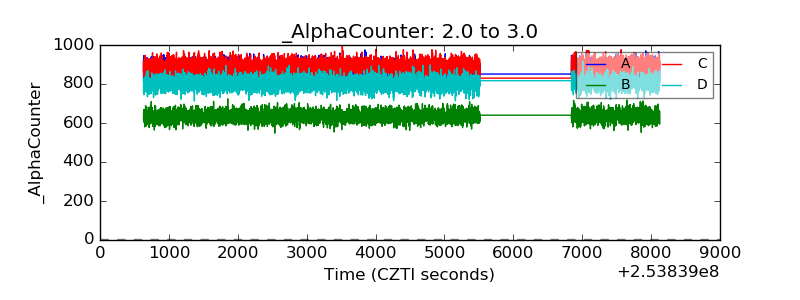 |
| _CPM_Rate | 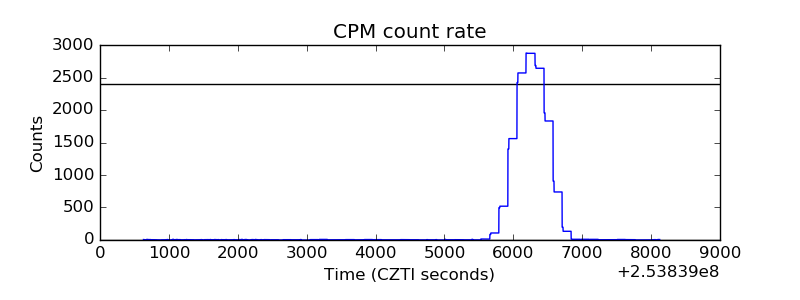 |
| CZT Counter | 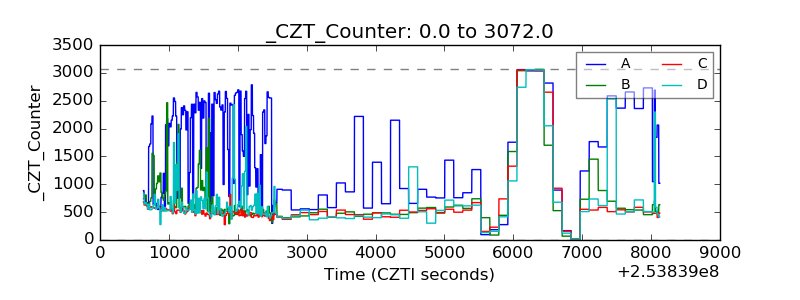 |
| +2.5 Volts monitor |  |
| +5 Volts monitor |  |
| _ROLL_ROT | 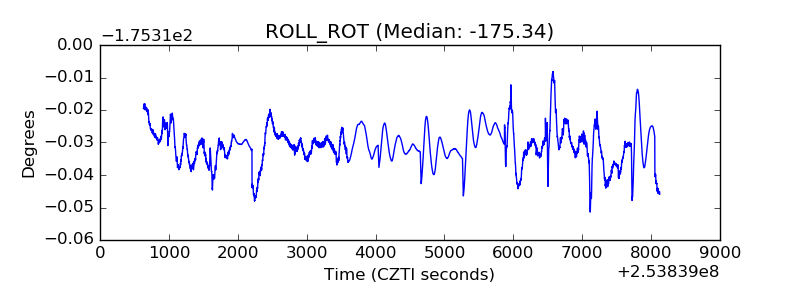 |
| _Roll_DEC | 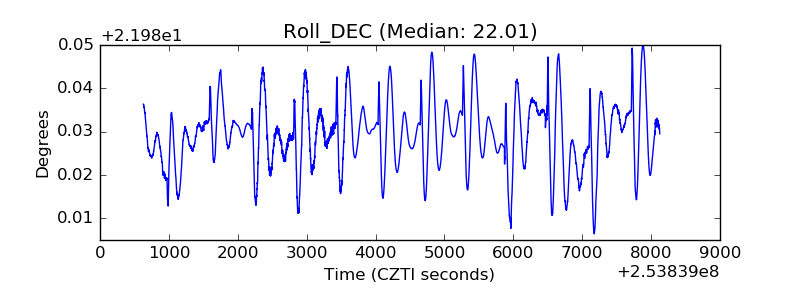 |
| _Roll_RA | 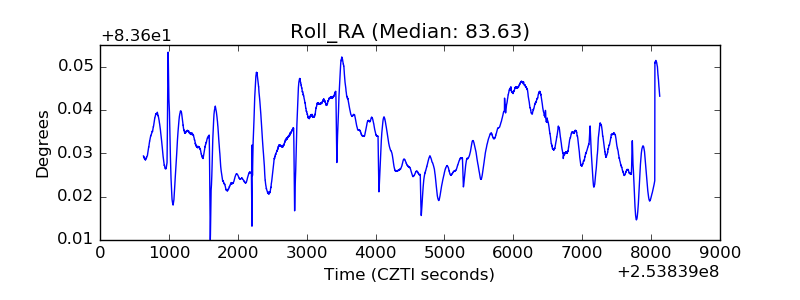 |
| Veto Counter | 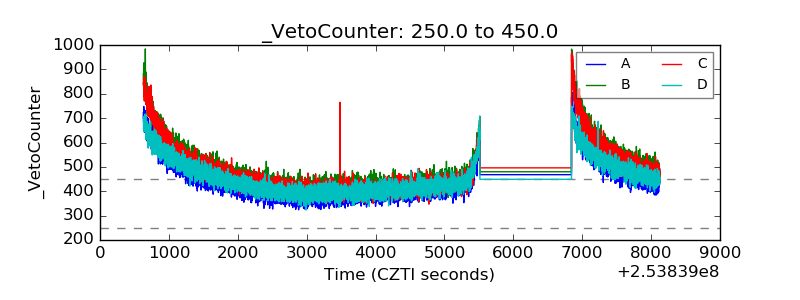 |