| Param | Original file | Final file |
|---|---|---|
| Filename | modeM0/AS1A04_174T01_9000001850_12462cztM0_level2.evt | modeM0/AS1A04_174T01_9000001850_12462cztM0_level2_quad_clean.evt |
| Size (bytes) | 692,421,120 | 76,936,320 |
| Size | 660.3 MB | 73.4 MB |
| Events in quadrant A | 10,341,943 | 383,438 |
| Events in quadrant B | 3,500,700 | 523,485 |
| Events in quadrant C | 2,851,268 | 527,237 |
| Events in quadrant D | 3,881,023 | 486,497 |
| Mode M0 | |||
|---|---|---|---|
| Quadrant | BADHDUFLAG | Total packets | Discarded packets |
| A | 0 | 34782 | 2 |
| B | 0 | 14049 | 1 |
| C | 0 | 12019 | 1 |
| D | 0 | 15470 | 1 |
| Mode M9 | |||
|---|---|---|---|
| Quadrant | BADHDUFLAG | Total packets | Discarded packets |
| A | 0 | 13 | 0 |
| B | 0 | 13 | 0 |
| C | 0 | 13 | 0 |
| D | 0 | 13 | 0 |
| Mode SS | |||
|---|---|---|---|
| Quadrant | BADHDUFLAG | Total packets | Discarded packets |
| A | 0 | 120 | 0 |
| B | 0 | 120 | 0 |
| C | 0 | 120 | 0 |
| D | 0 | 120 | 0 |
| Quadrant | Total seconds | Saturated seconds | Saturation percentage |
|---|---|---|---|
| A | 5833 | 3069 | 52.614435% |
| B | 5833 | 247 | 4.234528% |
| C | 5833 | 10 | 0.171438% |
| D | 5833 | 286 | 4.903137% |
Noise dominated data is calculated using 1-second bins in cleaned event files. If a bin has >2000 counts, and if more than 50% of those come from <1% of pixels, then it is considered to be noise-dominated and hence unusable.
| Quadrant | # 1 sec bins | Bins with >0 counts | Bins with >2000 counts | High rate bins dominated by noise | Noise dominated (total time) | Noise dominated (detector-on time) | Marked lightcurve |
|---|---|---|---|---|---|---|---|
| A | 7169 | 5834 | 2712 | 2712 | 37.83% | 46.49% | 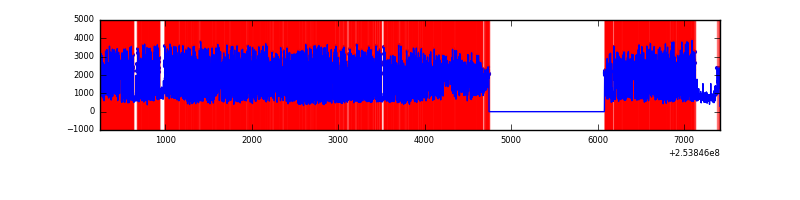 |
| B | 7169 | 5835 | 95 | 95 | 1.33% | 1.63% | 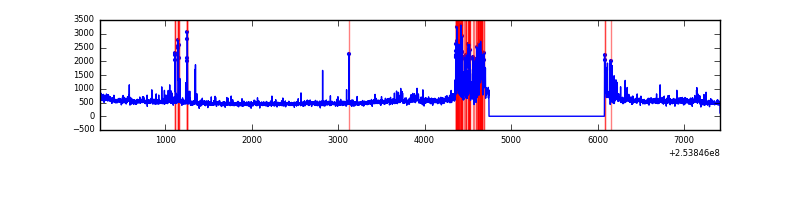 |
| C | 7169 | 5835 | 0 | 0 | 0.00% | 0.00% | 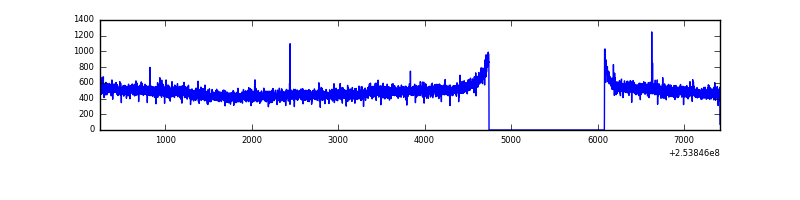 |
| D | 7169 | 5835 | 262 | 262 | 3.65% | 4.49% | 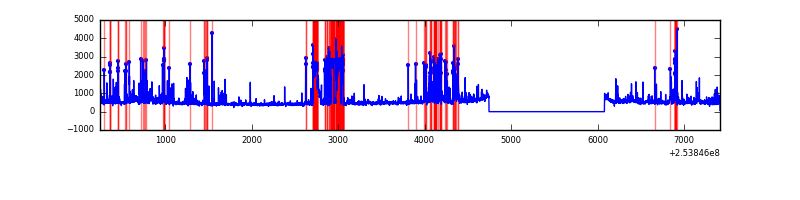 |
Top three noisy pixels from each quadrant. If the there are fewer than three noisy pixels in the level2.evt file, extra rows are filled as -1
| Pixel properties | Quadrant properties | ||||||
|---|---|---|---|---|---|---|---|
| Quadrant | DetID | PixID | Counts | Sigma | Mean | Median | Sigma |
| A | 0 | 23 | 5548303 | 44961.18 | 602 | 593 | 123.4 |
| A | 13 | 251 | 1762418 | 14278.64 | 602 | 593 | 123.4 |
| A | 0 | 226 | 396969 | 3212.41 | 602 | 593 | 123.4 |
| B | 4 | 239 | 436415 | 3113.14 | 742 | 727 | 140.0 |
| B | 0 | 219 | 49026 | 345.11 | 742 | 727 | 140.0 |
| B | 11 | 51 | 40335 | 283.01 | 742 | 727 | 140.0 |
| C | 13 | 61 | 5519 | 28.14 | 730 | 738 | 169.9 |
| C | 14 | 234 | 3820 | 18.14 | 730 | 738 | 169.9 |
| C | 3 | 202 | 1715 | 5.75 | 730 | 738 | 169.9 |
| D | 1 | 52 | 595730 | 3533.68 | 700 | 682 | 168.4 |
| D | 9 | 85 | 459383 | 2723.98 | 700 | 682 | 168.4 |
| D | 13 | 249 | 86055 | 506.99 | 700 | 682 | 168.4 |
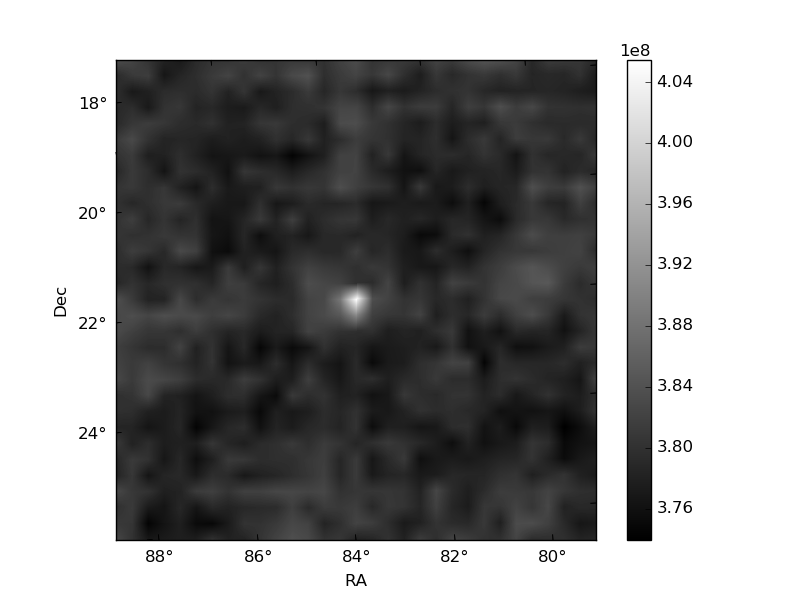
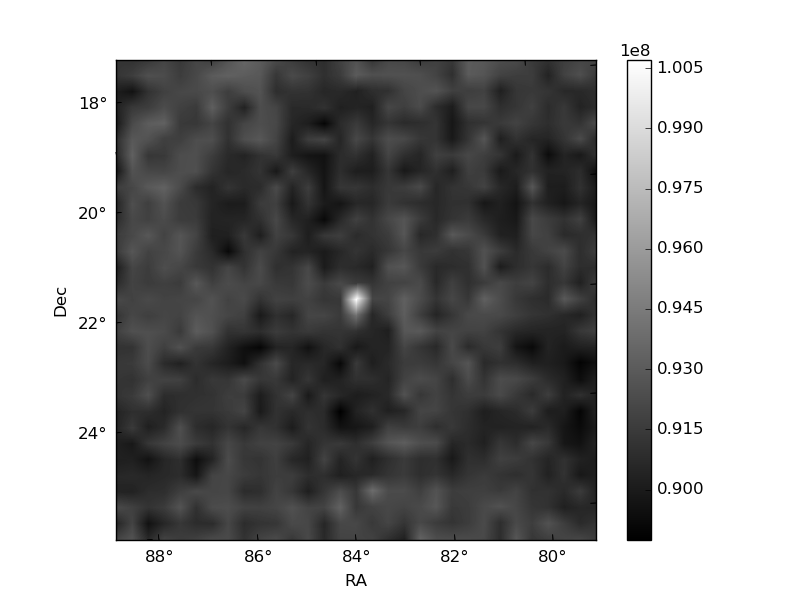
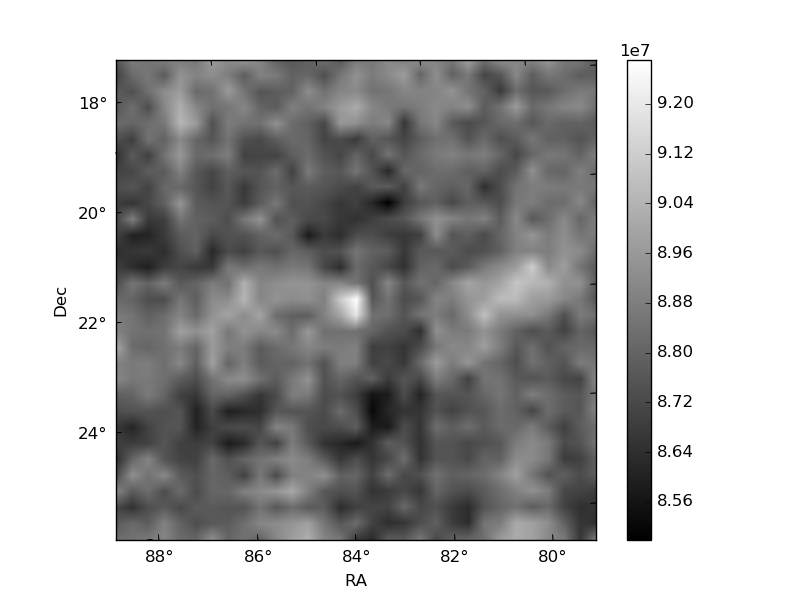
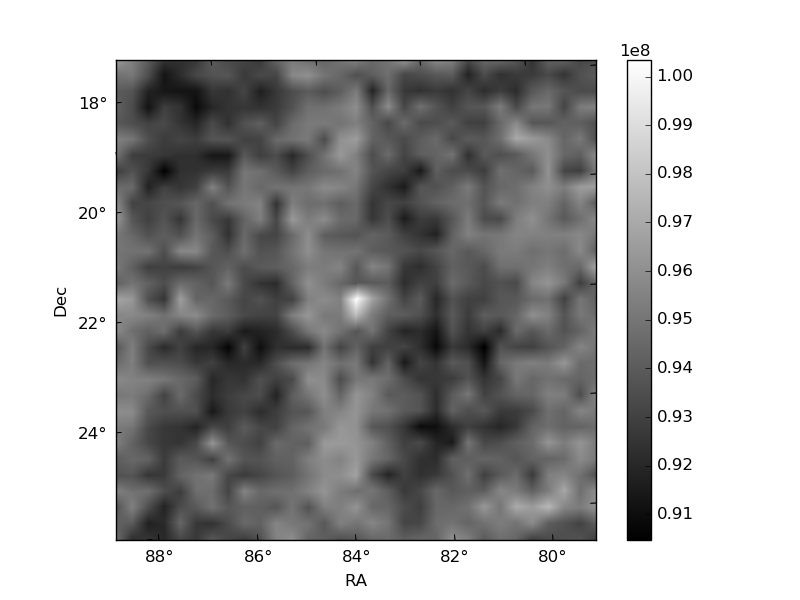
Histogram calculated using DETX and DETY for each event in the final _common_clean file
| Quadrant A | 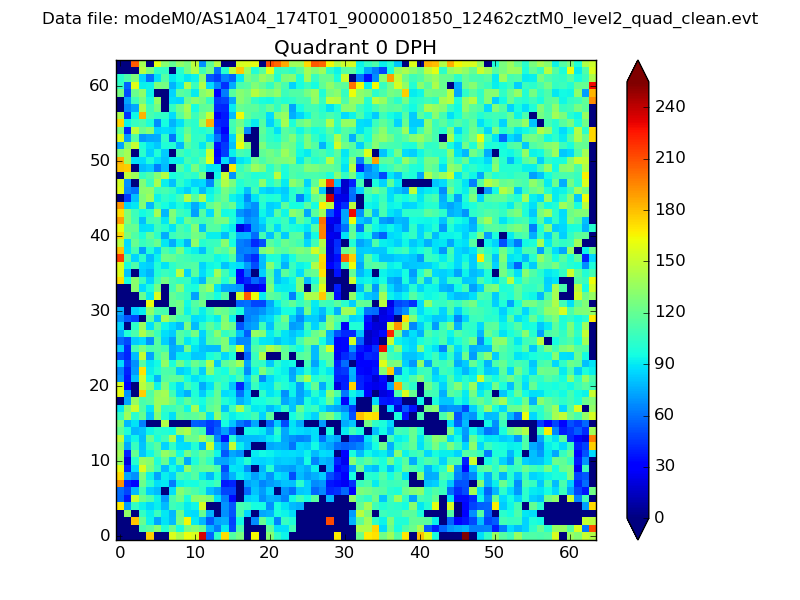 |
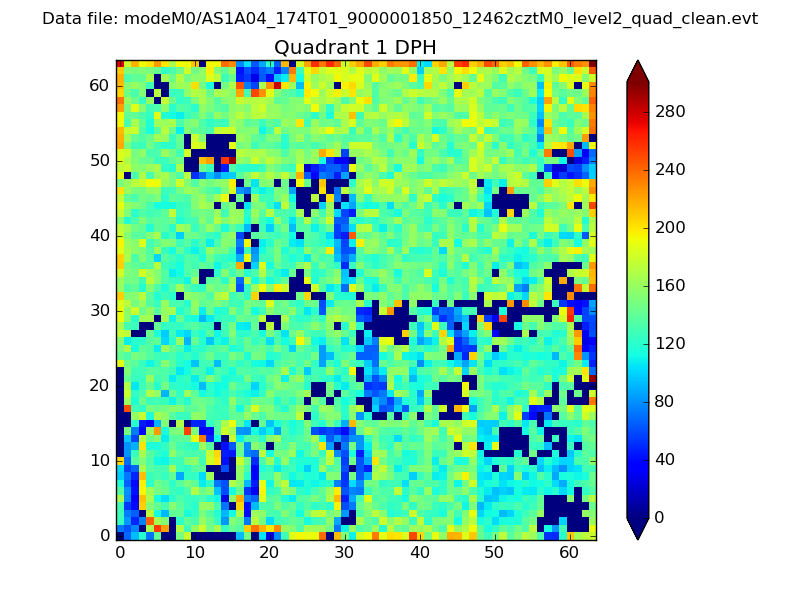 |
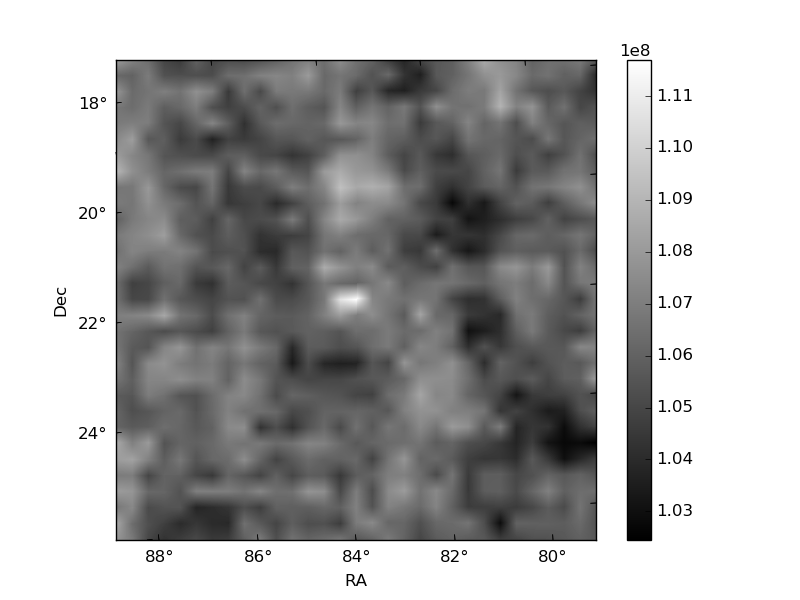
Quadrant B |
|---|---|---|---|
| Quadrant D | 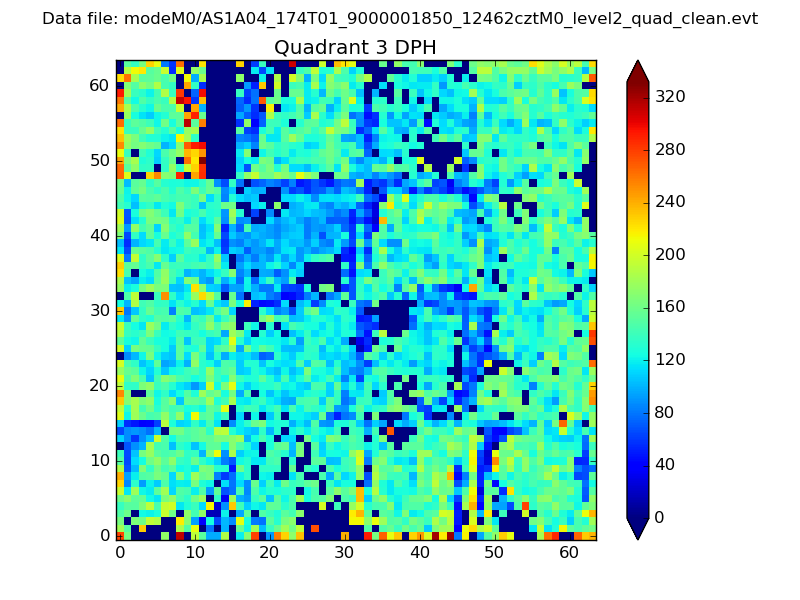 |
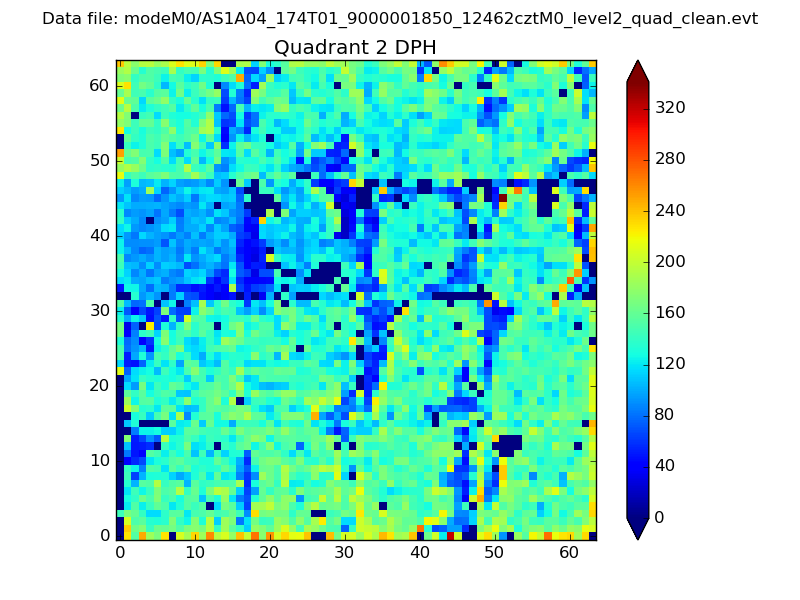 |
Quadrant C |
| Plot type | Count rate plots | Images |
|---|---|---|
| Comparison with Poisson distribution Blue bars denote a histogram of data divided into 1 sec bins. Red curve is a Poisson curve with rate = median count rate of data. |
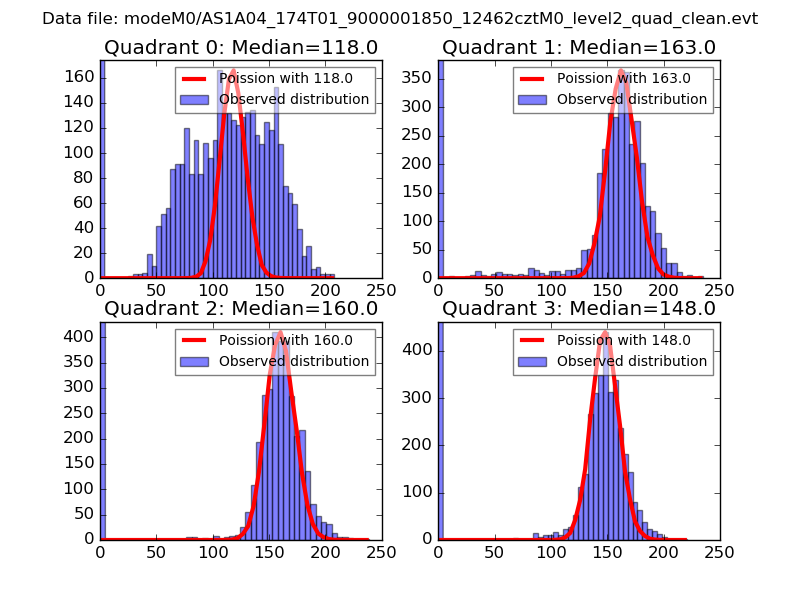 |
 |
| Quadrant-wise count rates Data is divided into 100 sec bins |
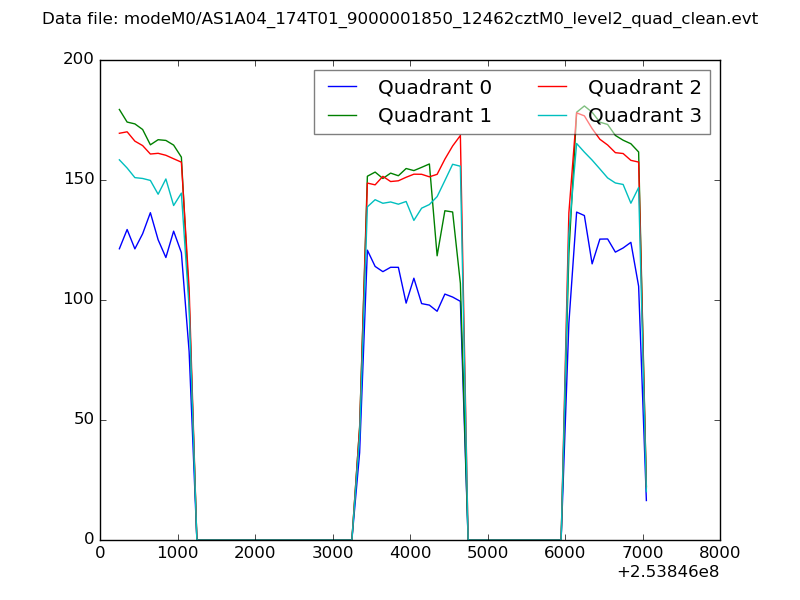 |
|
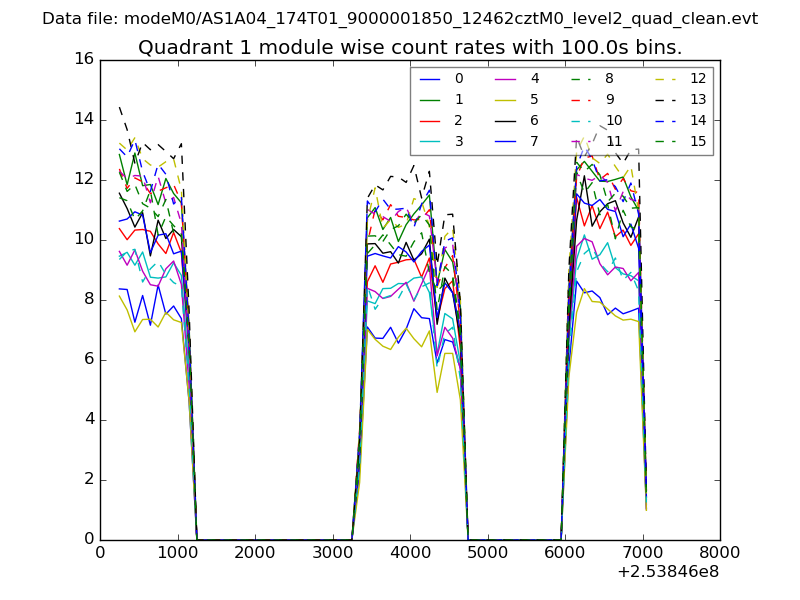
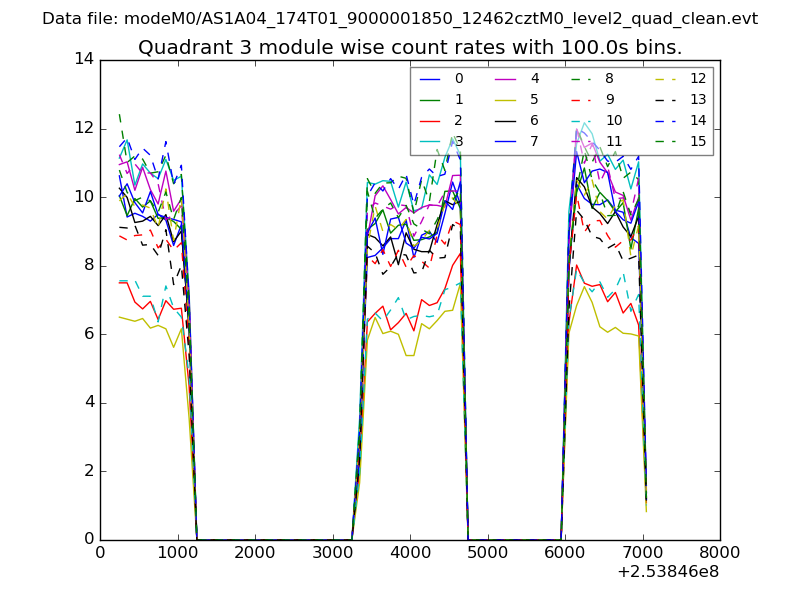
| Module-wise count rates for Quadrant A Data is divided into 100 sec bins |
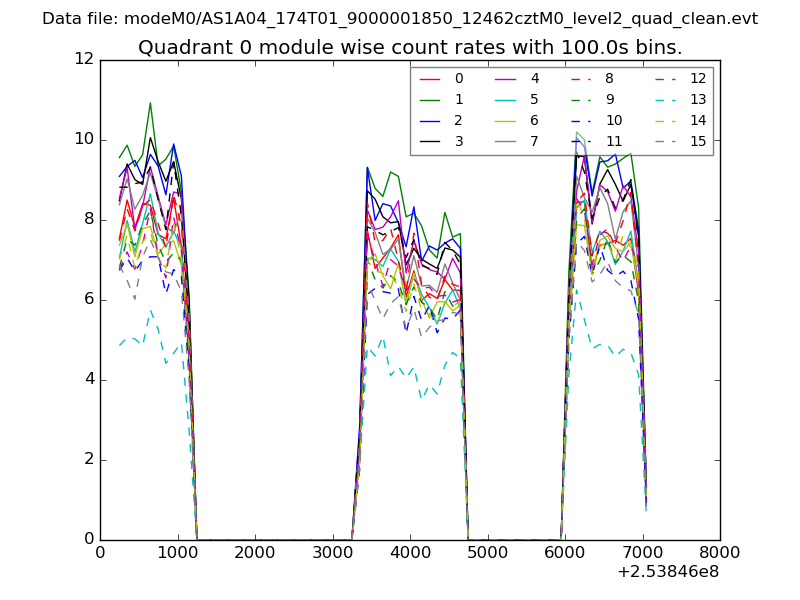 |
 |
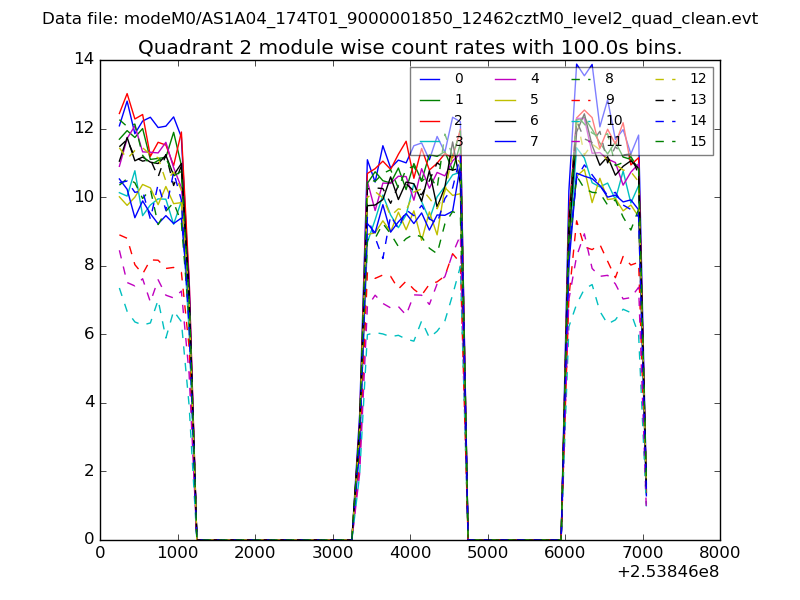
| Module-wise count rates for Quadrant B Data is divided into 100 sec bins |
 |
 |
| Module-wise count rates for Quadrant C Data is divided into 100 sec bins |
 |
 |
| Module-wise count rates for Quadrant D Data is divided into 100 sec bins |
 |
 |
| Parameter | Plot |
|---|---|
| CZT HV Monitor | 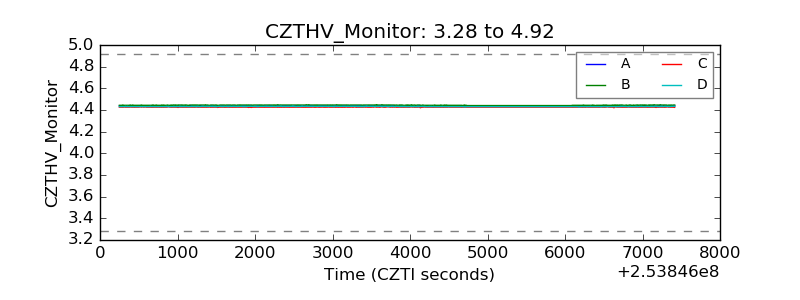 |
| D_VDD | 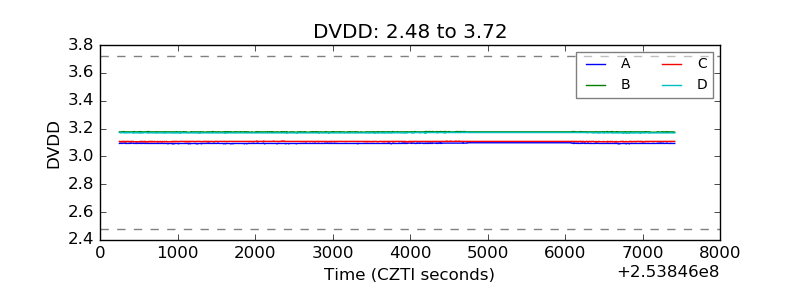 |
| Temperature 1 |  |
| Veto HV Monitor | 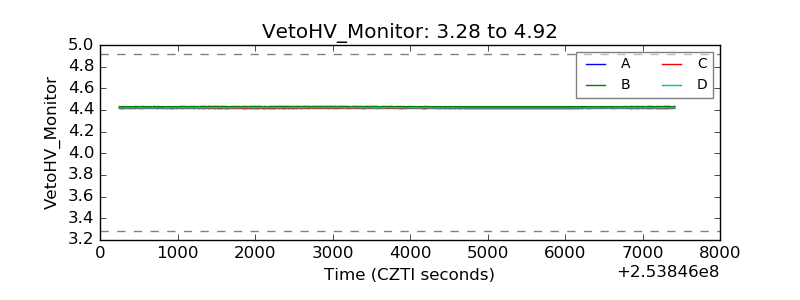 |
| Veto LLD | 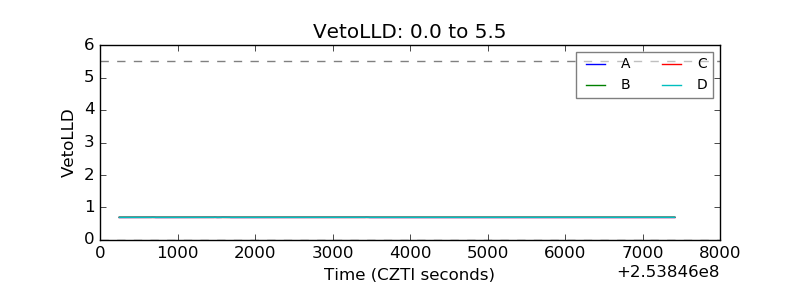 |
| Alpha Counter | 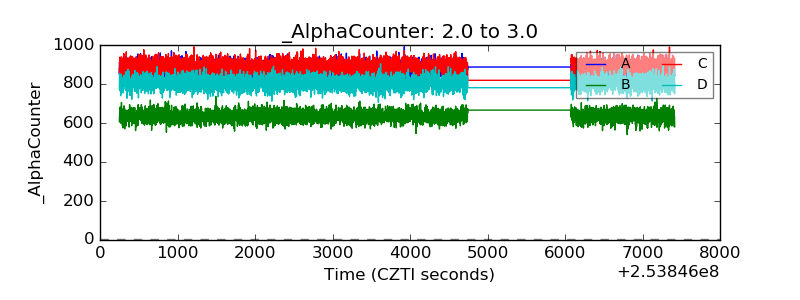 |
| _CPM_Rate | 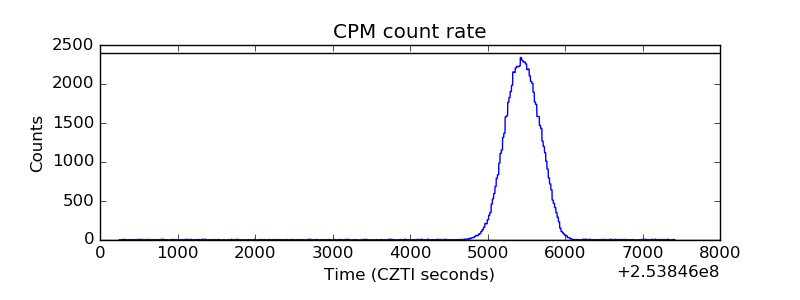 |
| CZT Counter | 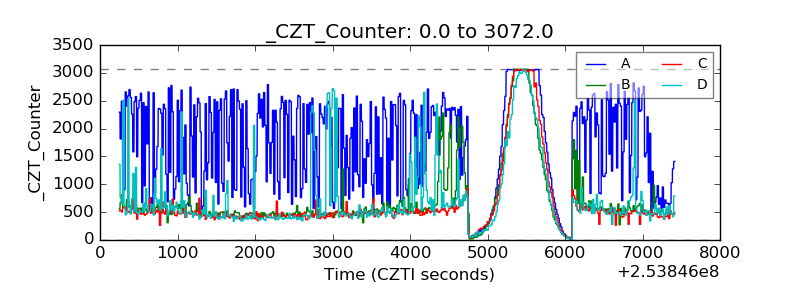 |
| +2.5 Volts monitor |  |
| +5 Volts monitor |  |
| _ROLL_ROT | 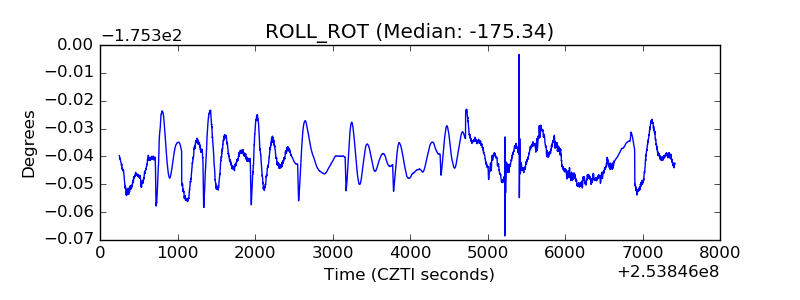 |
| _Roll_DEC | 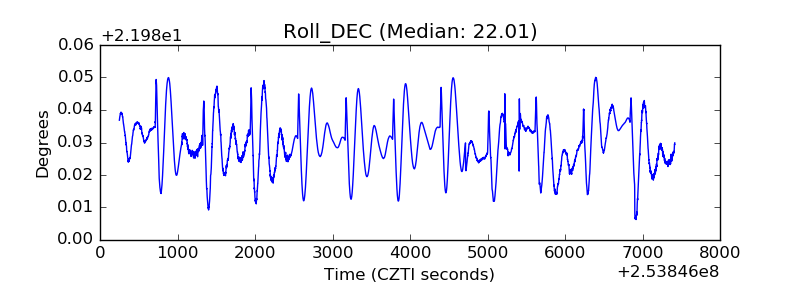 |
| _Roll_RA | 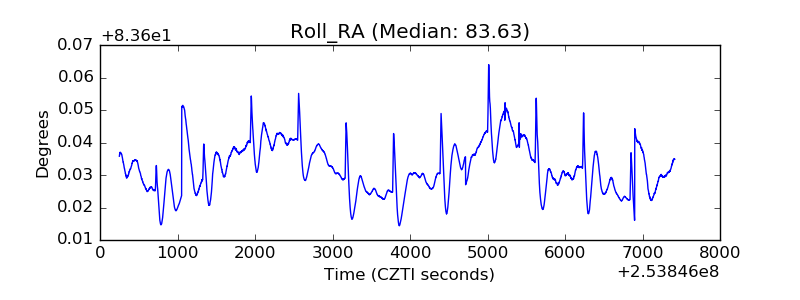 |
| Veto Counter | 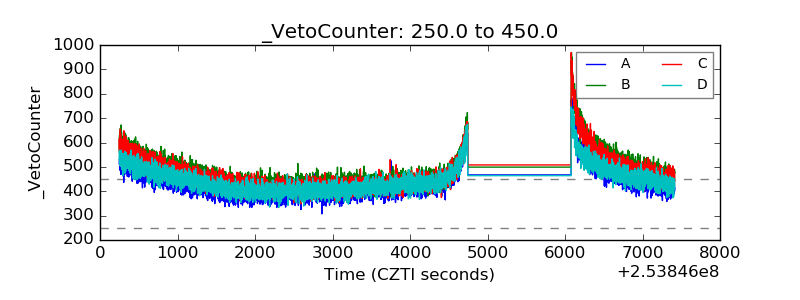 |