| Param | Original file | Final file |
|---|---|---|
| Filename | modeM0/AS1A04_174T01_9000001850_12464cztM0_level2.evt | modeM0/AS1A04_174T01_9000001850_12464cztM0_level2_quad_clean.evt |
| Size (bytes) | 618,966,720 | 72,469,440 |
| Size | 590.3 MB | 69.1 MB |
| Events in quadrant A | 8,151,058 | 415,639 |
| Events in quadrant B | 3,528,380 | 449,872 |
| Events in quadrant C | 3,101,251 | 449,914 |
| Events in quadrant D | 3,520,267 | 420,338 |
| Mode M0 | |||
|---|---|---|---|
| Quadrant | BADHDUFLAG | Total packets | Discarded packets |
| A | 0 | 28887 | 2 |
| B | 0 | 14497 | 1 |
| C | 0 | 13462 | 1 |
| D | 0 | 14837 | 1 |
| Mode M9 | |||
|---|---|---|---|
| Quadrant | BADHDUFLAG | Total packets | Discarded packets |
| A | 0 | 10 | 0 |
| B | 0 | 10 | 0 |
| C | 0 | 10 | 0 |
| D | 0 | 10 | 0 |
| Mode SS | |||
|---|---|---|---|
| Quadrant | BADHDUFLAG | Total packets | Discarded packets |
| A | 0 | 134 | 0 |
| B | 0 | 134 | 0 |
| C | 0 | 134 | 0 |
| D | 0 | 134 | 0 |
| Quadrant | Total seconds | Saturated seconds | Saturation percentage |
|---|---|---|---|
| A | 6554 | 907 | 13.838877% |
| B | 6577 | 117 | 1.778927% |
| C | 6577 | 22 | 0.334499% |
| D | 6577 | 99 | 1.505246% |
Noise dominated data is calculated using 1-second bins in cleaned event files. If a bin has >2000 counts, and if more than 50% of those come from <1% of pixels, then it is considered to be noise-dominated and hence unusable.
| Quadrant | # 1 sec bins | Bins with >0 counts | Bins with >2000 counts | High rate bins dominated by noise | Noise dominated (total time) | Noise dominated (detector-on time) | Marked lightcurve |
|---|---|---|---|---|---|---|---|
| A | 7633 | 6556 | 496 | 496 | 6.50% | 7.57% | 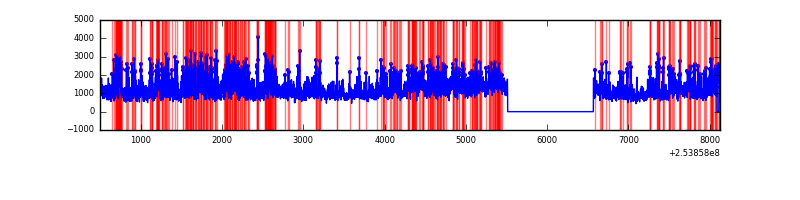 |
| B | 7633 | 6579 | 52 | 52 | 0.68% | 0.79% | 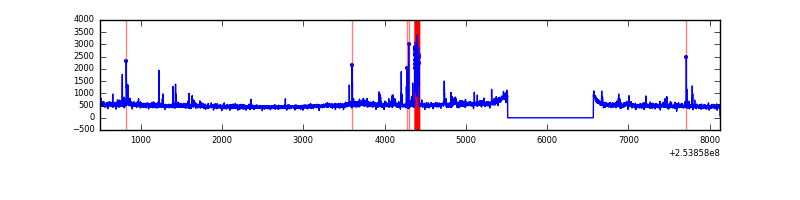 |
| C | 7633 | 6579 | 0 | 0 | 0.00% | 0.00% |  |
| D | 7633 | 6579 | 45 | 45 | 0.59% | 0.68% | 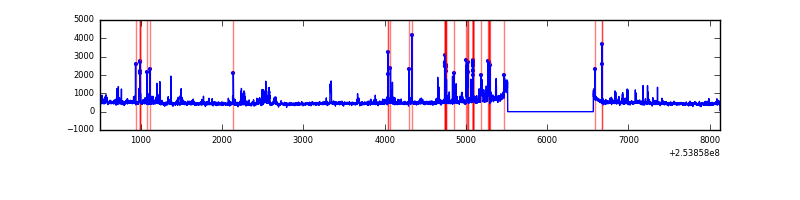 |
Top three noisy pixels from each quadrant. If the there are fewer than three noisy pixels in the level2.evt file, extra rows are filled as -1
| Pixel properties | Quadrant properties | ||||||
|---|---|---|---|---|---|---|---|
| Quadrant | DetID | PixID | Counts | Sigma | Mean | Median | Sigma |
| A | 13 | 251 | 4369273 | 27332.92 | 778 | 764 | 159.8 |
| A | 0 | 23 | 212766 | 1326.46 | 778 | 764 | 159.8 |
| A | 1 | 162 | 182006 | 1134.0 | 778 | 764 | 159.8 |
| B | 4 | 239 | 183479 | 1176.83 | 816 | 800 | 155.2 |
| B | 0 | 187 | 61016 | 387.91 | 816 | 800 | 155.2 |
| B | 3 | 209 | 43183 | 273.03 | 816 | 800 | 155.2 |
| C | 13 | 61 | 5817 | 27.25 | 795 | 801 | 184.0 |
| C | 14 | 234 | 2691 | 10.27 | 795 | 801 | 184.0 |
| C | 8 | 222 | 2016 | 6.6 | 795 | 801 | 184.0 |
| D | 1 | 52 | 366685 | 1947.23 | 779 | 763 | 187.9 |
| D | 7 | 71 | 64330 | 338.27 | 779 | 763 | 187.9 |
| D | 7 | 80 | 46919 | 245.62 | 779 | 763 | 187.9 |
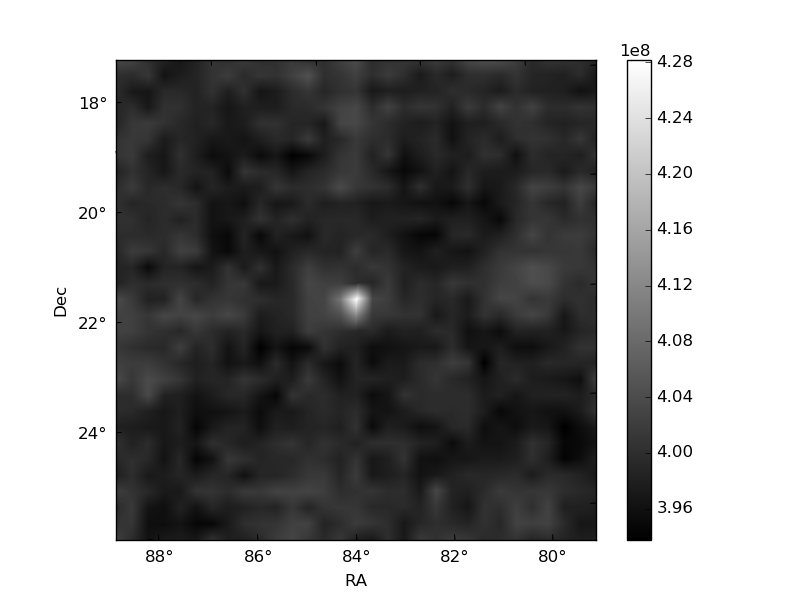
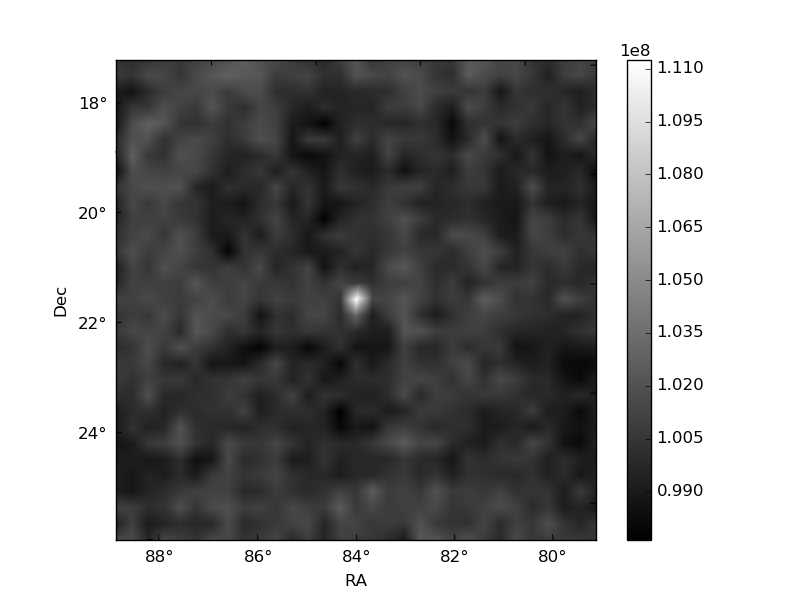
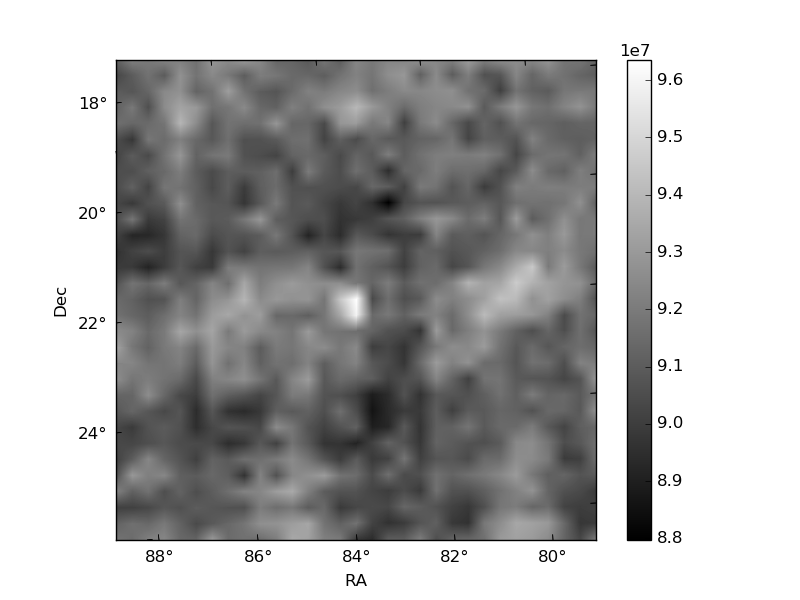
Histogram calculated using DETX and DETY for each event in the final _common_clean file
| Quadrant A |  |
 |
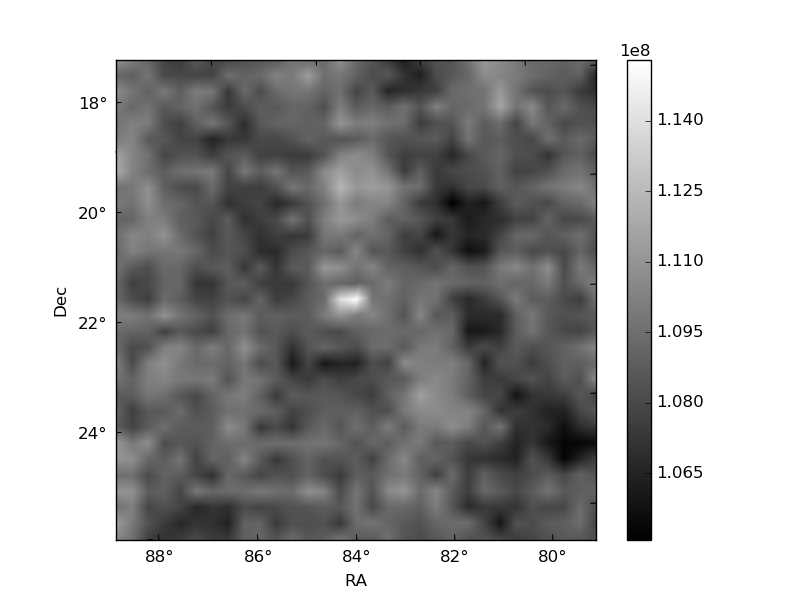
Quadrant B |
|---|---|---|---|
| Quadrant D |  |
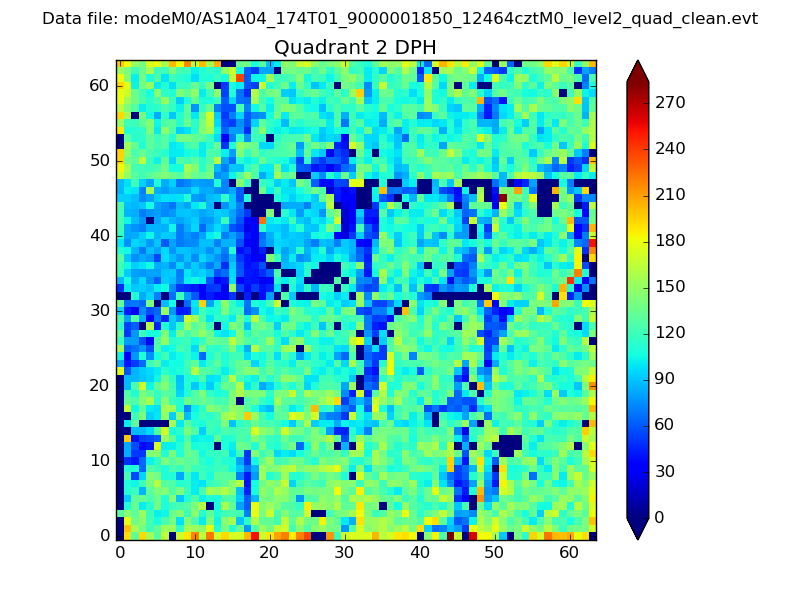 |
Quadrant C |
| Plot type | Count rate plots | Images |
|---|---|---|
| Comparison with Poisson distribution Blue bars denote a histogram of data divided into 1 sec bins. Red curve is a Poisson curve with rate = median count rate of data. |
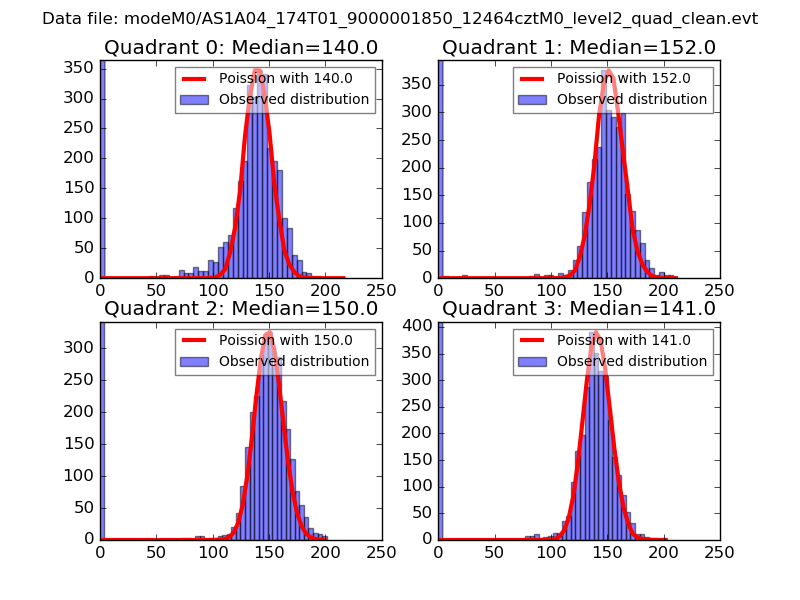 |
 |
| Quadrant-wise count rates Data is divided into 100 sec bins |
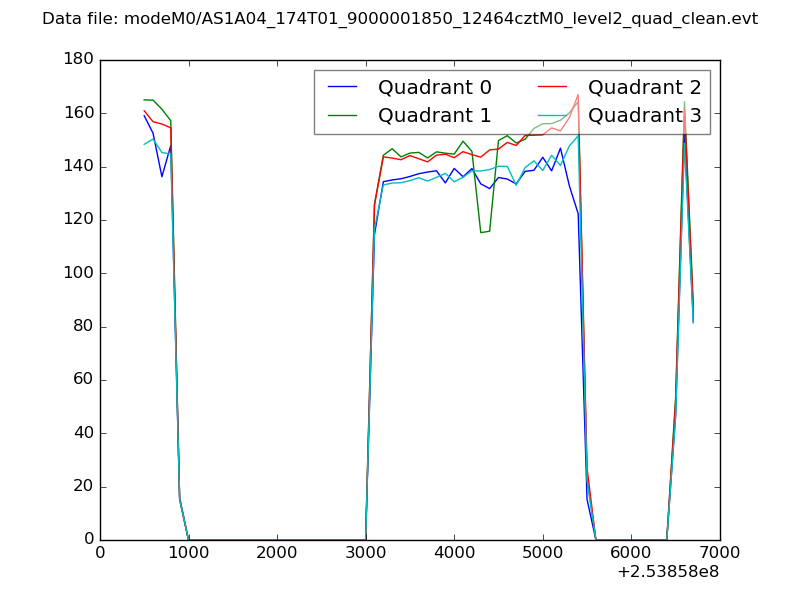 |
|
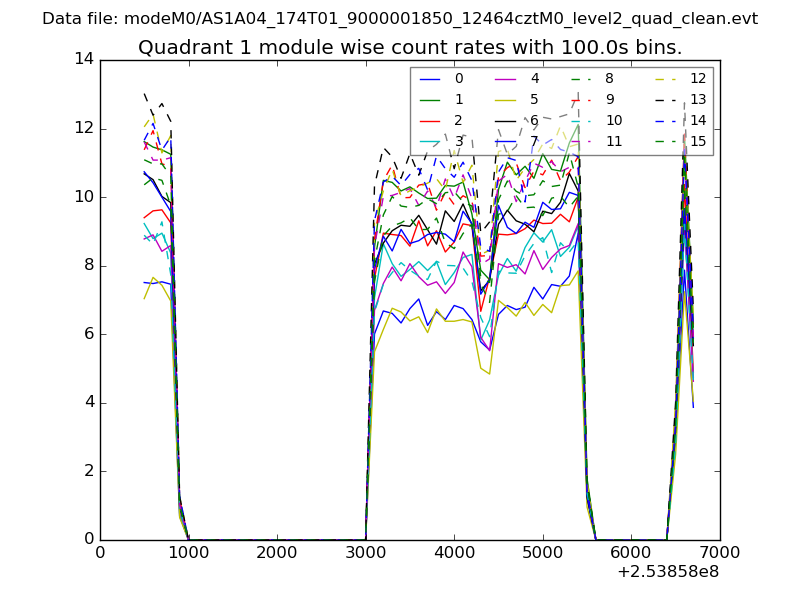
| Module-wise count rates for Quadrant A Data is divided into 100 sec bins |
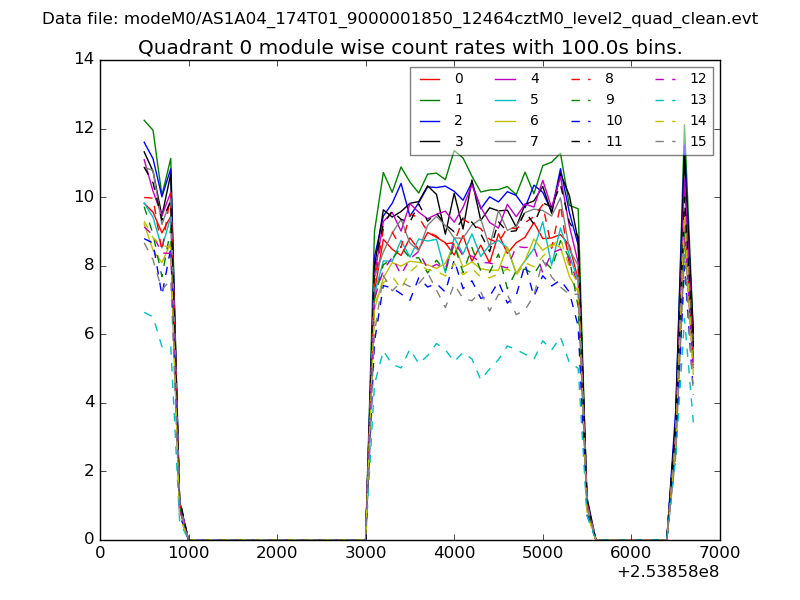 |
 |
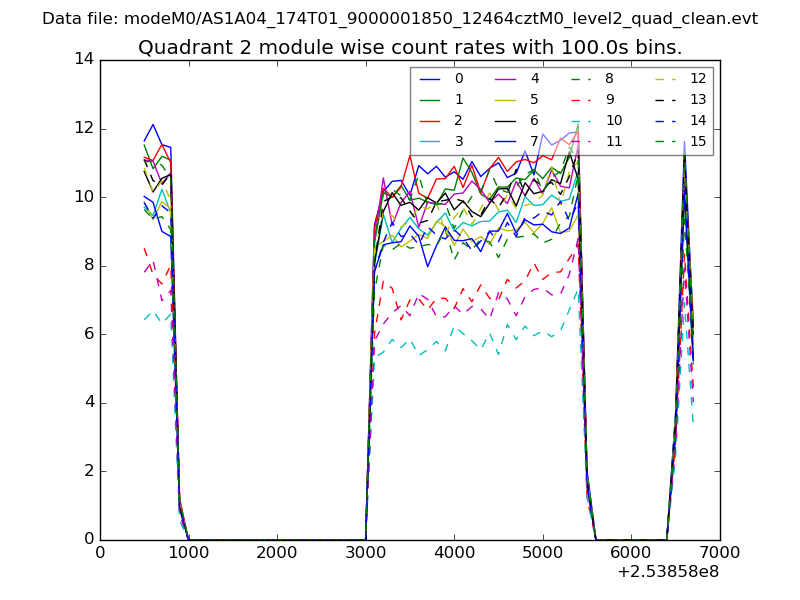
| Module-wise count rates for Quadrant B Data is divided into 100 sec bins |
 |
 |
| Module-wise count rates for Quadrant C Data is divided into 100 sec bins |
 |
 |
| Module-wise count rates for Quadrant D Data is divided into 100 sec bins |
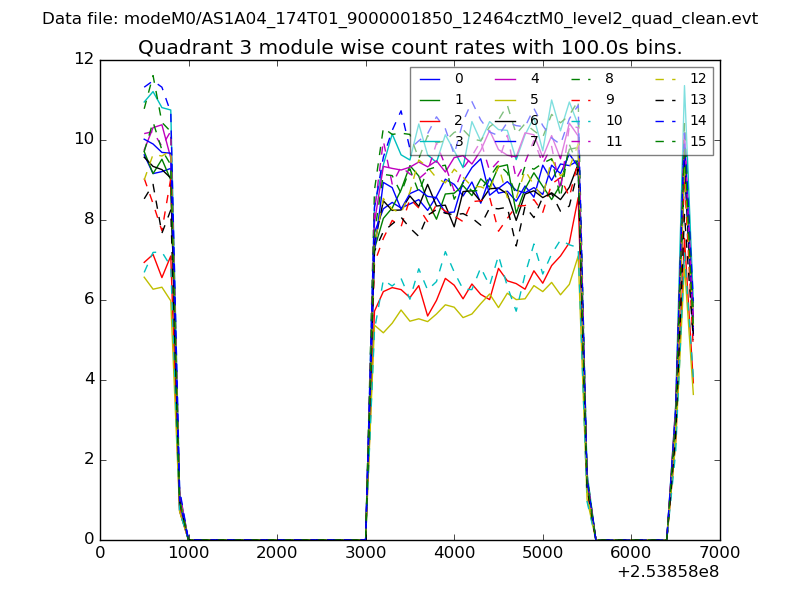 |
 |
| Parameter | Plot |
|---|---|
| CZT HV Monitor | 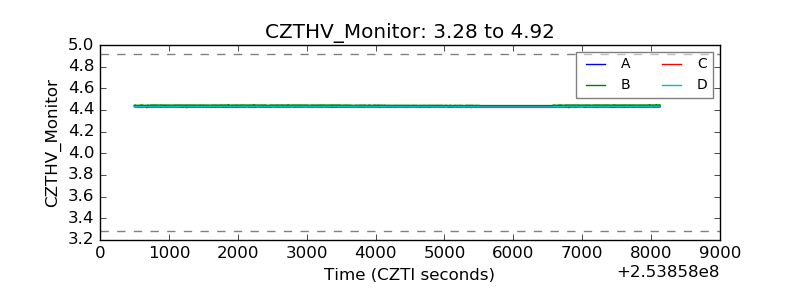 |
| D_VDD | 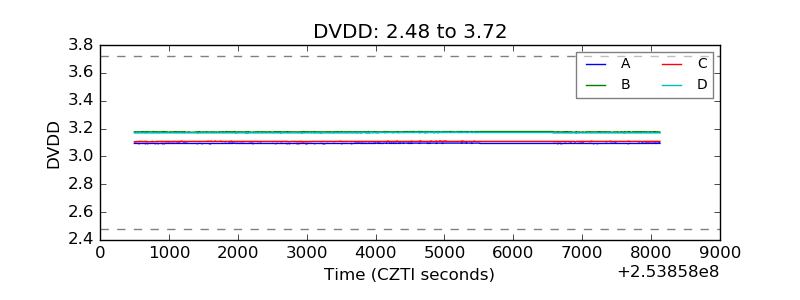 |
| Temperature 1 | 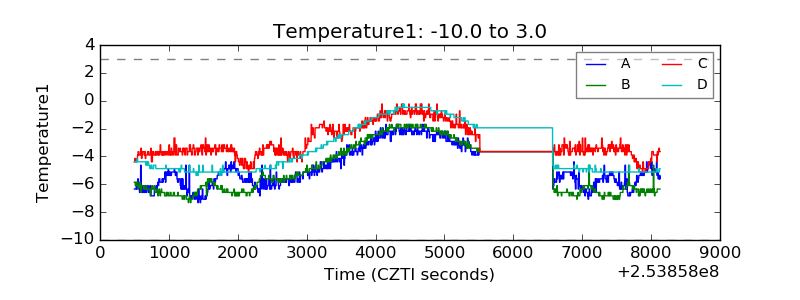 |
| Veto HV Monitor | 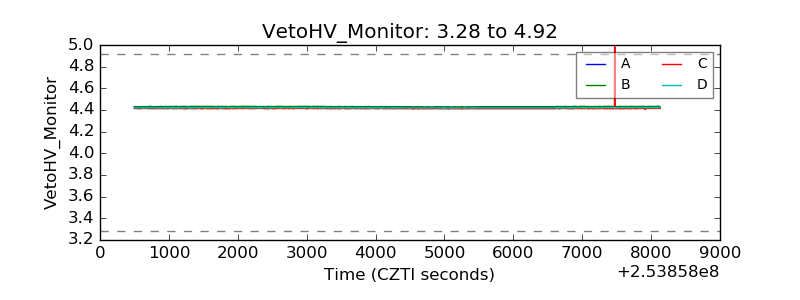 |
| Veto LLD | 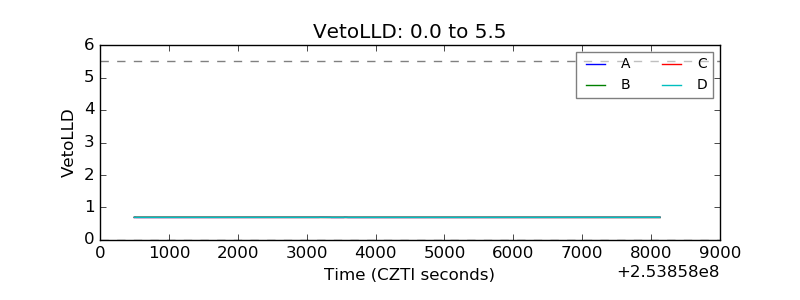 |
| Alpha Counter | 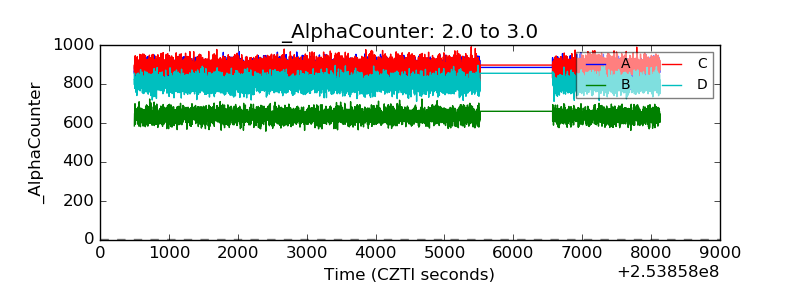 |
| _CPM_Rate | 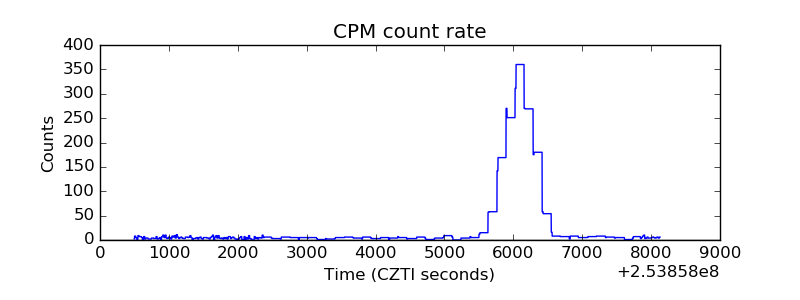 |
| CZT Counter | 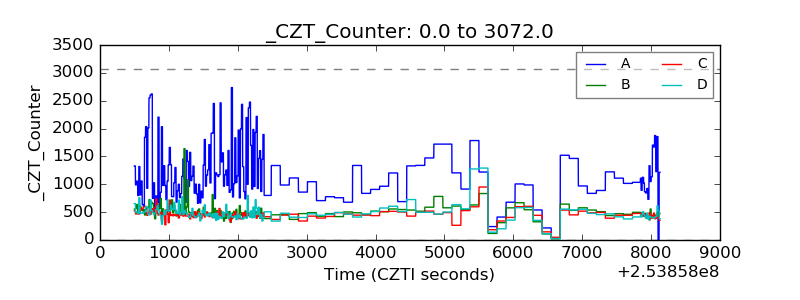 |
| +2.5 Volts monitor |  |
| +5 Volts monitor |  |
| _ROLL_ROT |  |
| _Roll_DEC | 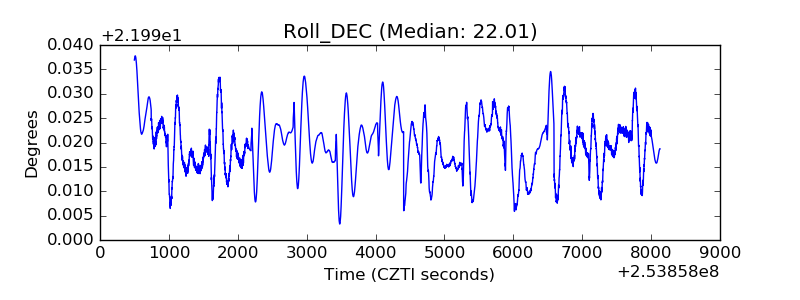 |
| _Roll_RA | 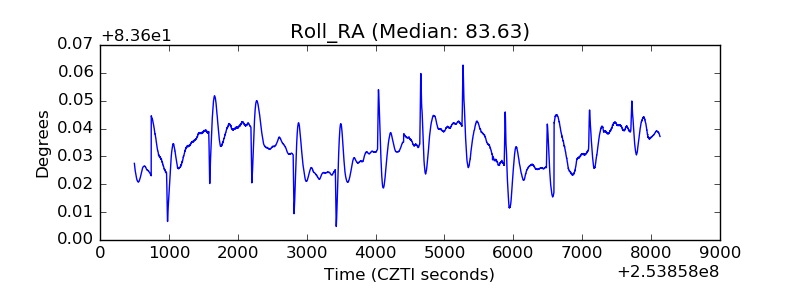 |
| Veto Counter | 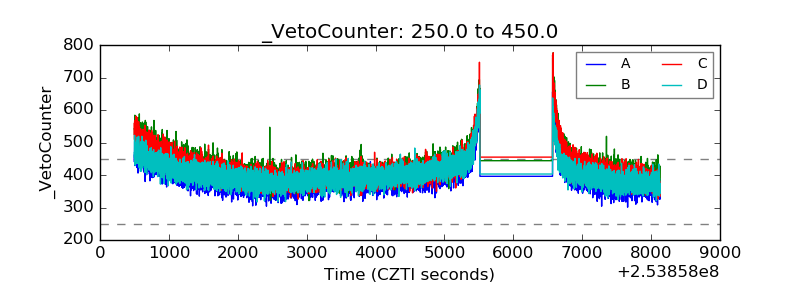 |