| Param | Original file | Final file |
|---|---|---|
| Filename | modeM0/AS1A04_174T01_9000001850_12465cztM0_level2.evt | modeM0/AS1A04_174T01_9000001850_12465cztM0_level2_quad_clean.evt |
| Size (bytes) | 688,060,800 | 77,961,600 |
| Size | 656.2 MB | 74.3 MB |
| Events in quadrant A | 9,395,831 | 436,740 |
| Events in quadrant B | 3,788,065 | 489,011 |
| Events in quadrant C | 3,351,057 | 487,419 |
| Events in quadrant D | 3,822,130 | 451,695 |
| Mode M0 | |||
|---|---|---|---|
| Quadrant | BADHDUFLAG | Total packets | Discarded packets |
| A | 0 | 32976 | 3 |
| B | 0 | 15618 | 2 |
| C | 0 | 14677 | 2 |
| D | 0 | 16123 | 2 |
| Mode M9 | |||
|---|---|---|---|
| Quadrant | BADHDUFLAG | Total packets | Discarded packets |
| A | 0 | 7 | 0 |
| B | 0 | 7 | 0 |
| C | 0 | 7 | 0 |
| D | 0 | 8 | 0 |
| Mode SS | |||
|---|---|---|---|
| Quadrant | BADHDUFLAG | Total packets | Discarded packets |
| A | 0 | 146 | 0 |
| B | 0 | 146 | 0 |
| C | 0 | 146 | 0 |
| D | 0 | 146 | 0 |
| Quadrant | Total seconds | Saturated seconds | Saturation percentage |
|---|---|---|---|
| A | 7092 | 1317 | 18.570220% |
| B | 7115 | 175 | 2.459592% |
| C | 7115 | 63 | 0.885453% |
| D | 7115 | 159 | 2.234715% |
Noise dominated data is calculated using 1-second bins in cleaned event files. If a bin has >2000 counts, and if more than 50% of those come from <1% of pixels, then it is considered to be noise-dominated and hence unusable.
| Quadrant | # 1 sec bins | Bins with >0 counts | Bins with >2000 counts | High rate bins dominated by noise | Noise dominated (total time) | Noise dominated (detector-on time) | Marked lightcurve |
|---|---|---|---|---|---|---|---|
| A | 7746 | 7094 | 806 | 806 | 10.41% | 11.36% |  |
| B | 7746 | 7116 | 32 | 32 | 0.41% | 0.45% | 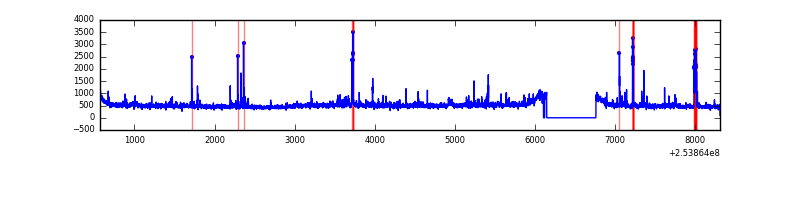 |
| C | 7746 | 7117 | 0 | 0 | 0.00% | 0.00% | 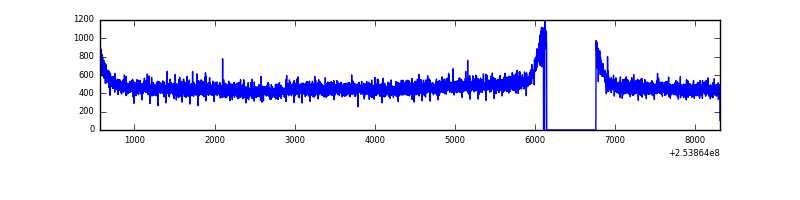 |
| D | 7746 | 7118 | 81 | 81 | 1.05% | 1.14% |  |
Top three noisy pixels from each quadrant. If the there are fewer than three noisy pixels in the level2.evt file, extra rows are filled as -1
| Pixel properties | Quadrant properties | ||||||
|---|---|---|---|---|---|---|---|
| Quadrant | DetID | PixID | Counts | Sigma | Mean | Median | Sigma |
| A | 13 | 251 | 5513159 | 32235.31 | 834 | 816 | 171.0 |
| A | 0 | 23 | 383763 | 2239.41 | 834 | 816 | 171.0 |
| A | 1 | 162 | 83862 | 485.64 | 834 | 816 | 171.0 |
| B | 4 | 239 | 198562 | 1163.01 | 883 | 862 | 170.0 |
| B | 11 | 51 | 40479 | 233.05 | 883 | 862 | 170.0 |
| B | 0 | 187 | 37201 | 213.77 | 883 | 862 | 170.0 |
| C | 13 | 61 | 6128 | 26.1 | 859 | 867 | 201.5 |
| C | 12 | 4 | 2623 | 8.71 | 859 | 867 | 201.5 |
| C | 3 | 202 | 1988 | 5.56 | 859 | 867 | 201.5 |
| D | 1 | 52 | 351492 | 1719.47 | 839 | 817 | 203.9 |
| D | 13 | 249 | 134350 | 654.76 | 839 | 817 | 203.9 |
| D | 7 | 71 | 102666 | 499.4 | 839 | 817 | 203.9 |
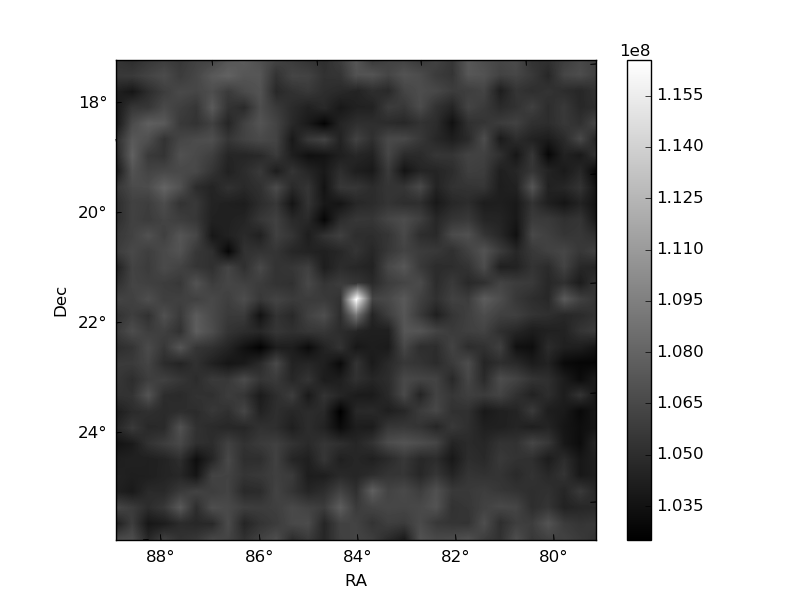
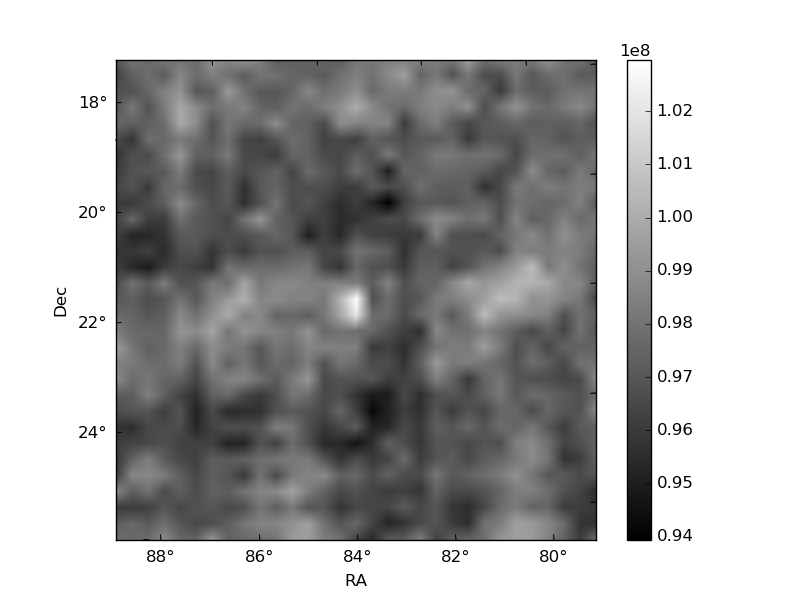
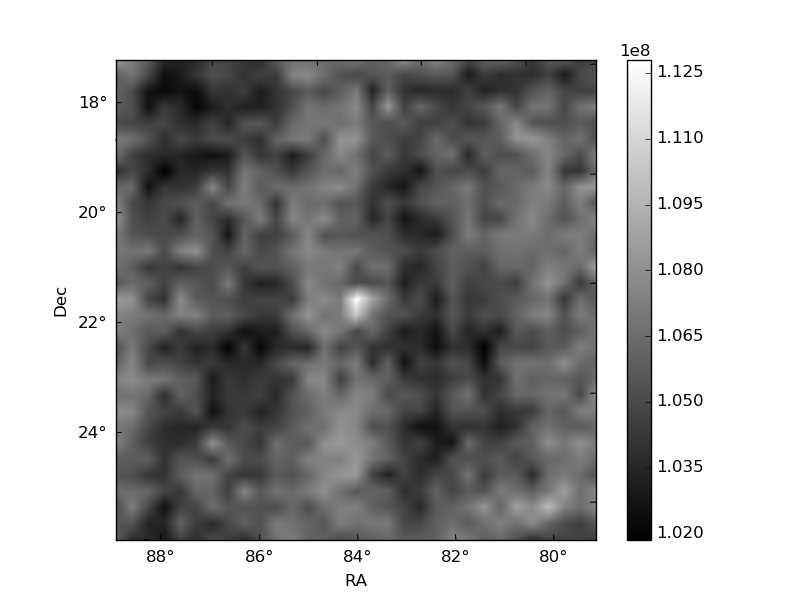
Histogram calculated using DETX and DETY for each event in the final _common_clean file
| Quadrant A | 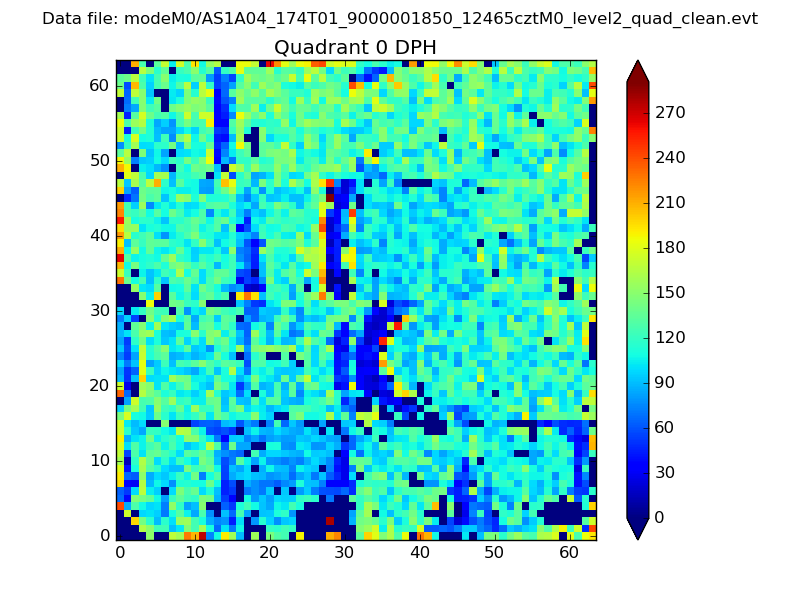 |
 |
Quadrant B |
|---|---|---|---|
| Quadrant D | 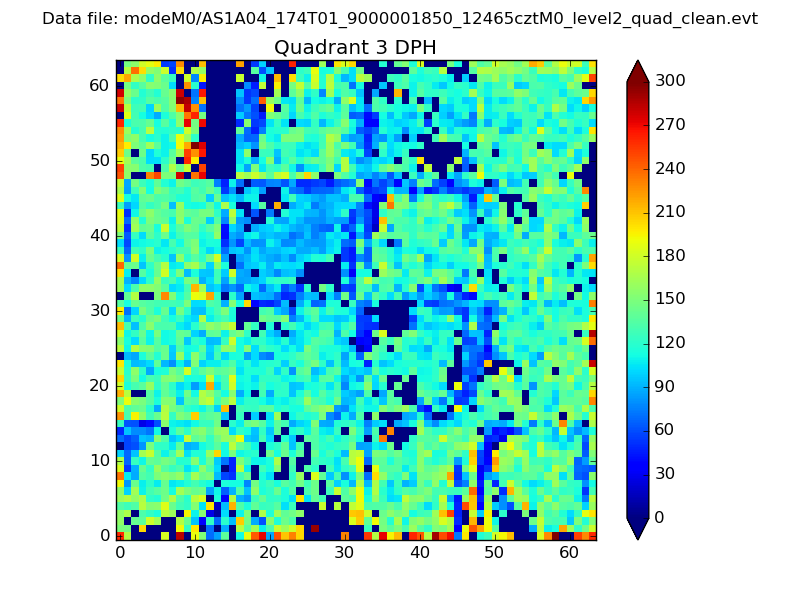 |
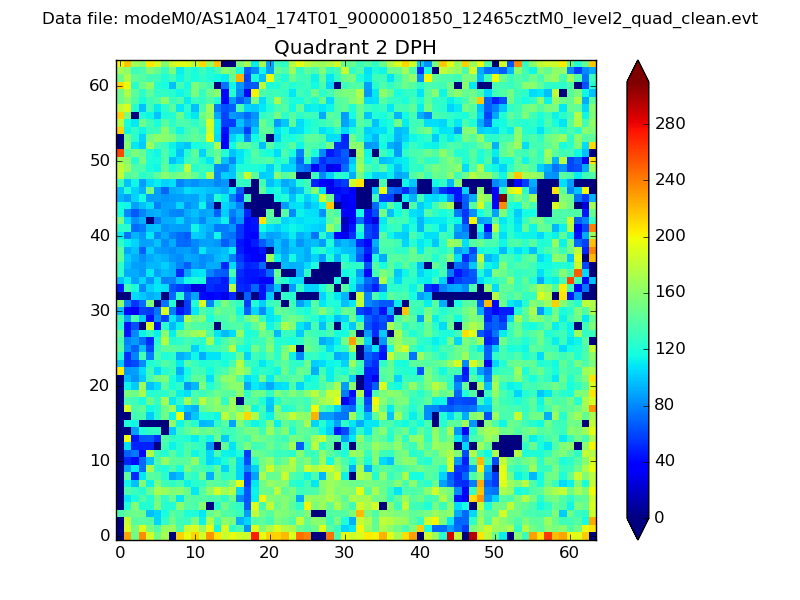 |
Quadrant C |
| Plot type | Count rate plots | Images |
|---|---|---|
| Comparison with Poisson distribution Blue bars denote a histogram of data divided into 1 sec bins. Red curve is a Poisson curve with rate = median count rate of data. |
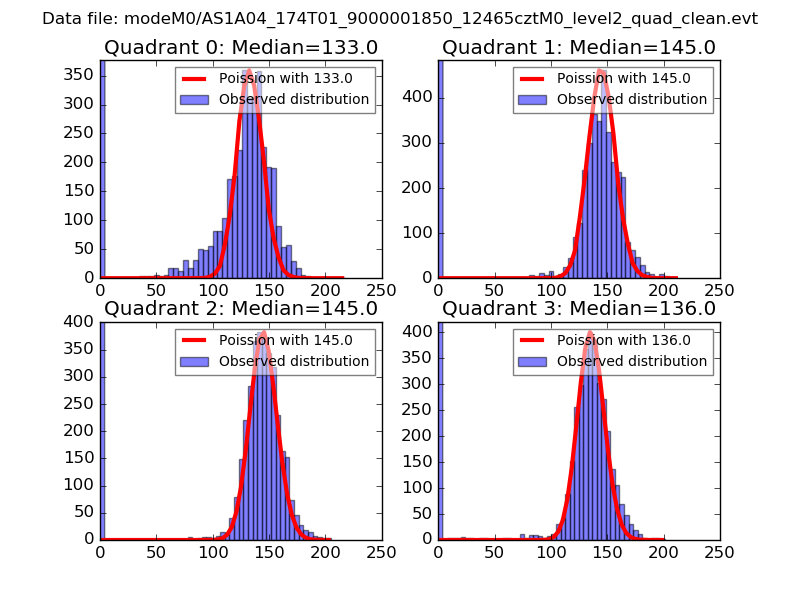 |
 |
| Quadrant-wise count rates Data is divided into 100 sec bins |
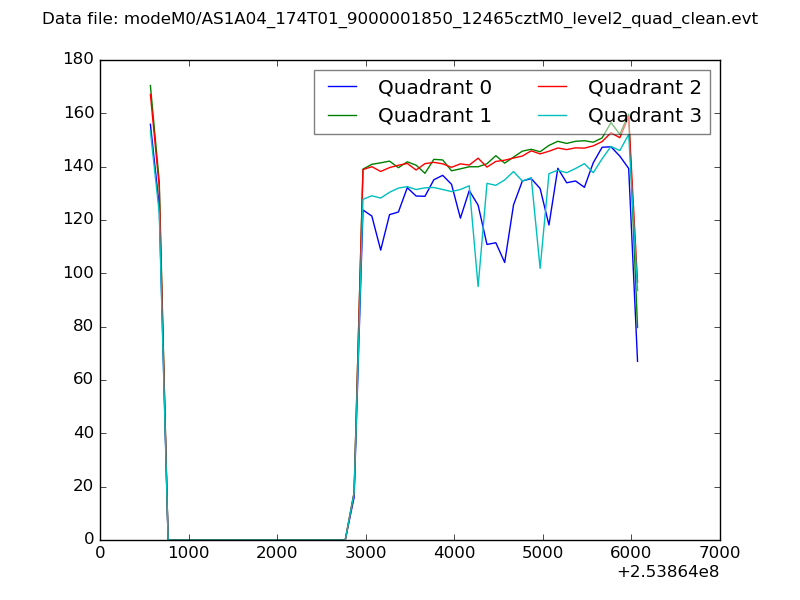 |
|
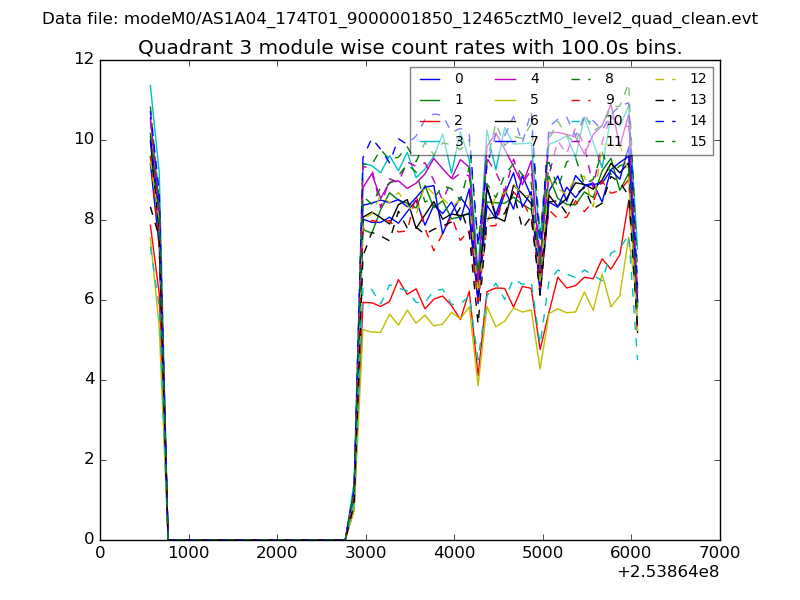
| Module-wise count rates for Quadrant A Data is divided into 100 sec bins |
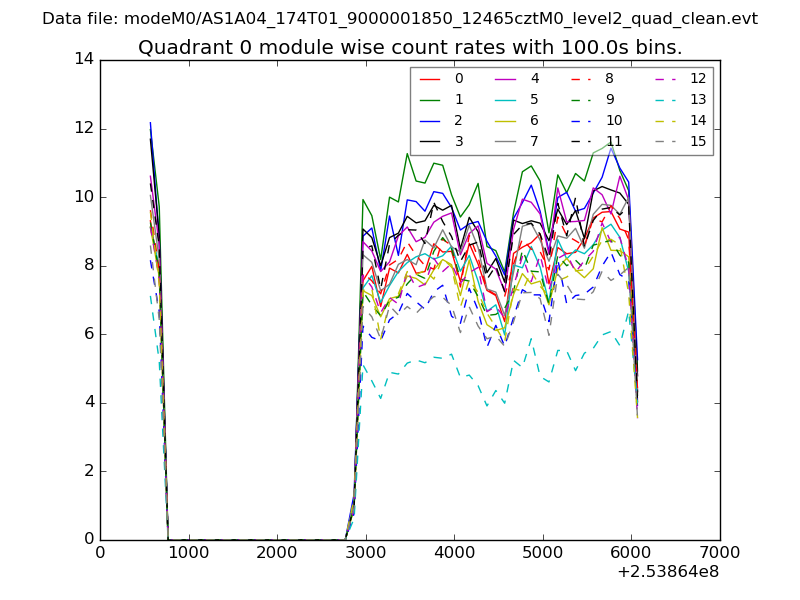 |
 |
| Module-wise count rates for Quadrant B Data is divided into 100 sec bins |
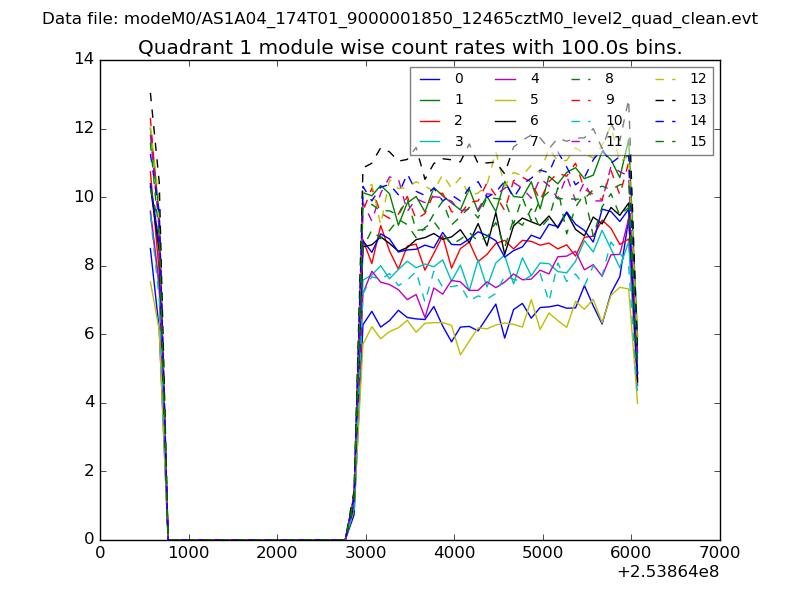 |
 |
| Module-wise count rates for Quadrant C Data is divided into 100 sec bins |
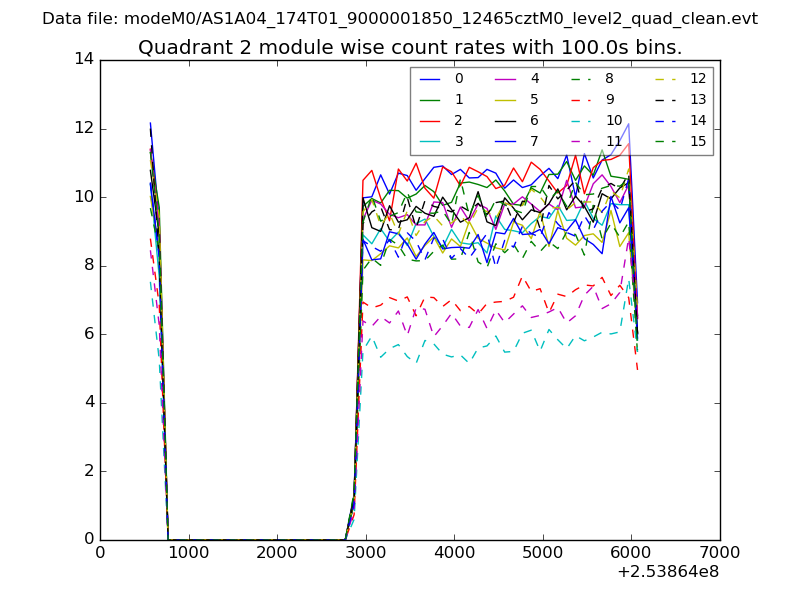 |
 |
| Module-wise count rates for Quadrant D Data is divided into 100 sec bins |
 |
 |
| Parameter | Plot |
|---|---|
| CZT HV Monitor | 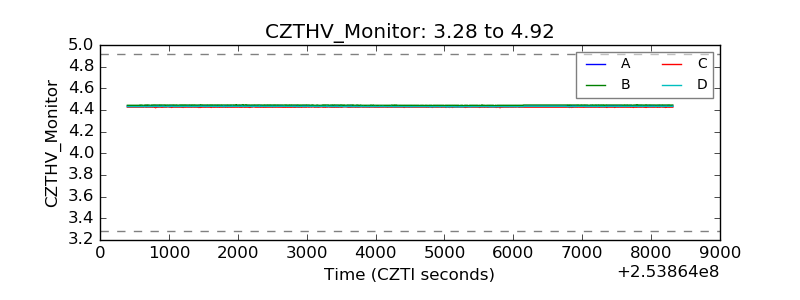 |
| D_VDD | 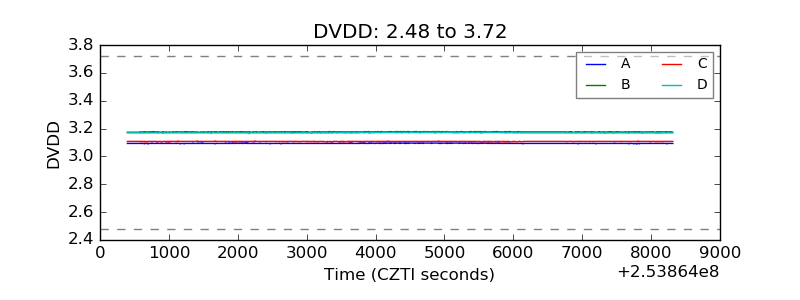 |
| Temperature 1 | 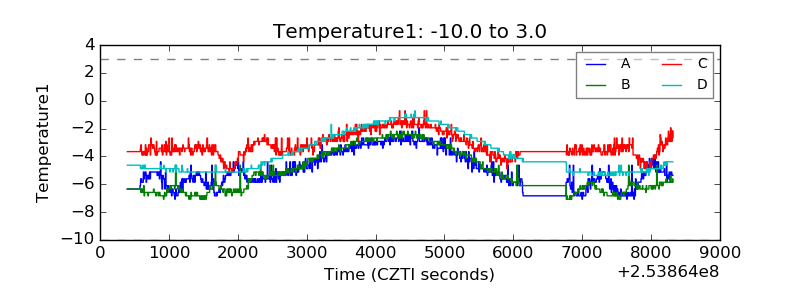 |
| Veto HV Monitor | 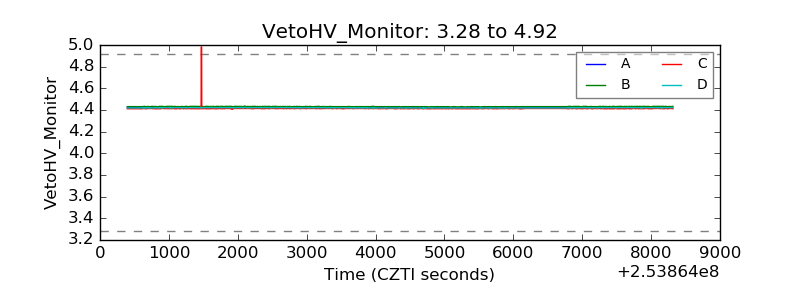 |
| Veto LLD |  |
| Alpha Counter | 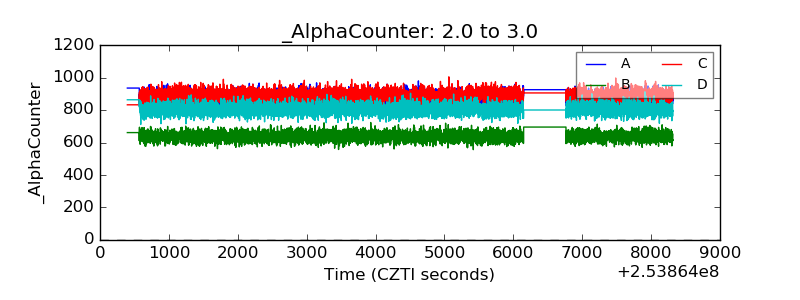 |
| _CPM_Rate | 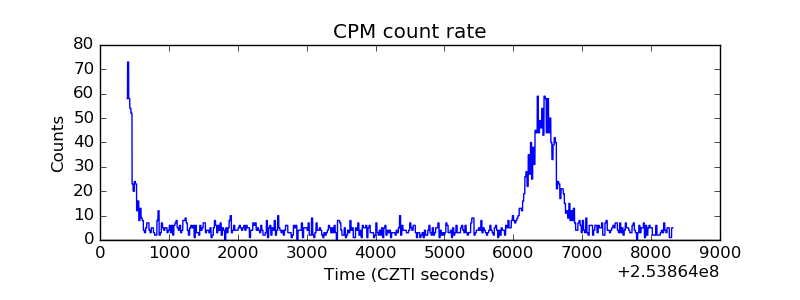 |
| CZT Counter | 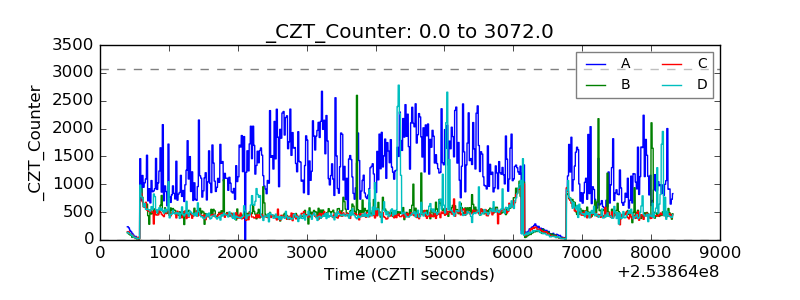 |
| +2.5 Volts monitor |  |
| +5 Volts monitor |  |
| _ROLL_ROT | 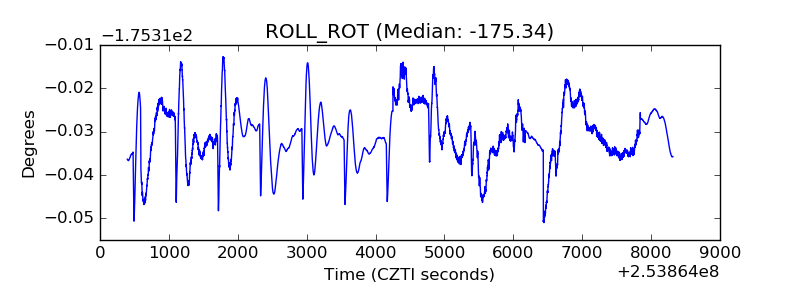 |
| _Roll_DEC | 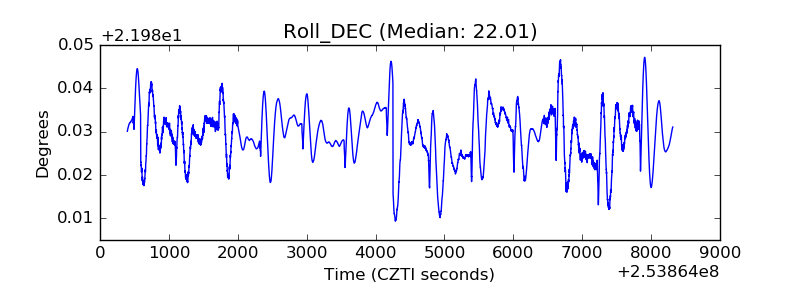 |
| _Roll_RA | 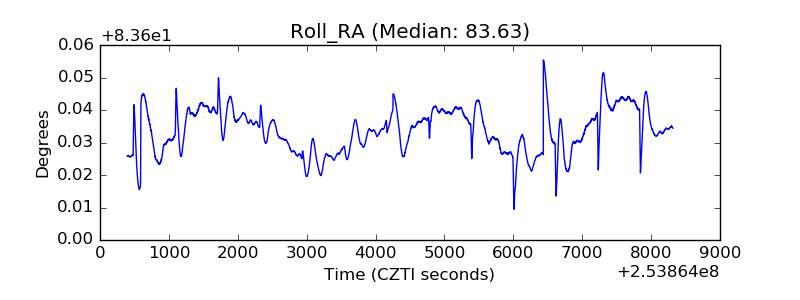 |
| Veto Counter | 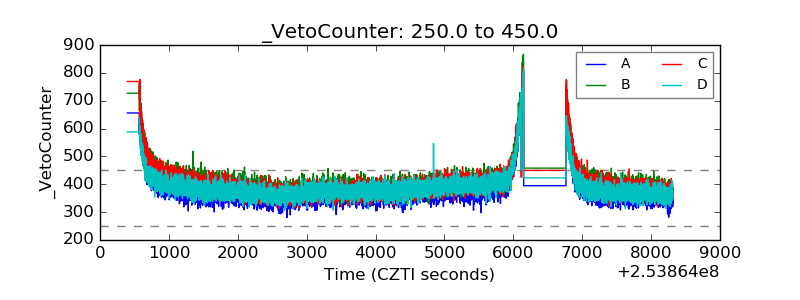 |