| Param | Original file | Final file |
|---|---|---|
| Filename | modeM0/AS1A04_174T01_9000001850_12466cztM0_level2.evt | modeM0/AS1A04_174T01_9000001850_12466cztM0_level2_quad_clean.evt |
| Size (bytes) | 830,027,520 | 93,142,080 |
| Size | 791.6 MB | 88.8 MB |
| Events in quadrant A | 11,306,334 | 524,840 |
| Events in quadrant B | 4,493,328 | 590,103 |
| Events in quadrant C | 3,911,866 | 588,979 |
| Events in quadrant D | 4,879,241 | 553,717 |
| Mode M0 | |||
|---|---|---|---|
| Quadrant | BADHDUFLAG | Total packets | Discarded packets |
| A | 0 | 39330 | 3 |
| B | 0 | 18331 | 2 |
| C | 0 | 16950 | 2 |
| D | 0 | 19844 | 2 |
| Mode M9 | |||
|---|---|---|---|
| Quadrant | BADHDUFLAG | Total packets | Discarded packets |
| A | 0 | 8 | 0 |
| B | 0 | 8 | 0 |
| C | 0 | 8 | 0 |
| D | 0 | 8 | 0 |
| Mode SS | |||
|---|---|---|---|
| Quadrant | BADHDUFLAG | Total packets | Discarded packets |
| A | 0 | 166 | 0 |
| B | 0 | 166 | 0 |
| C | 0 | 166 | 0 |
| D | 0 | 166 | 0 |
| Quadrant | Total seconds | Saturated seconds | Saturation percentage |
|---|---|---|---|
| A | 8093 | 2102 | 25.973063% |
| B | 8093 | 365 | 4.510070% |
| C | 8093 | 144 | 1.779315% |
| D | 8093 | 367 | 4.534783% |
Noise dominated data is calculated using 1-second bins in cleaned event files. If a bin has >2000 counts, and if more than 50% of those come from <1% of pixels, then it is considered to be noise-dominated and hence unusable.
| Quadrant | # 1 sec bins | Bins with >0 counts | Bins with >2000 counts | High rate bins dominated by noise | Noise dominated (total time) | Noise dominated (detector-on time) | Marked lightcurve |
|---|---|---|---|---|---|---|---|
| A | 8964 | 8094 | 1191 | 1191 | 13.29% | 14.71% | 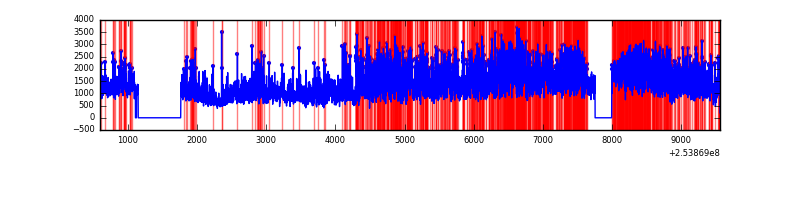 |
| B | 8964 | 8094 | 63 | 63 | 0.70% | 0.78% | 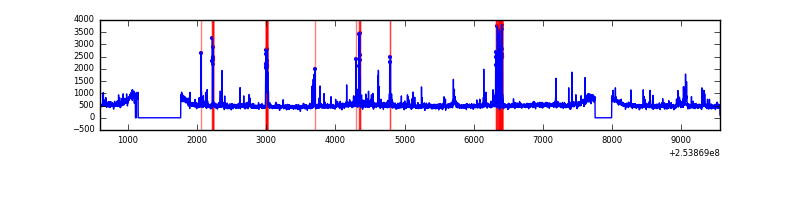 |
| C | 8964 | 8096 | 4 | 4 | 0.04% | 0.05% | 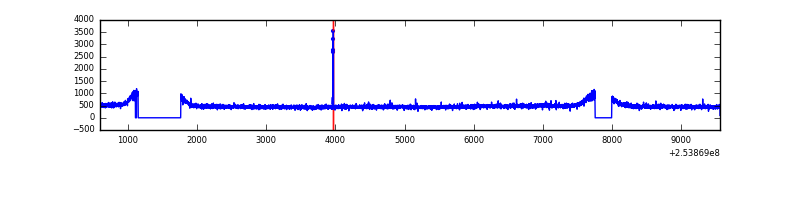 |
| D | 8964 | 8097 | 204 | 204 | 2.28% | 2.52% | 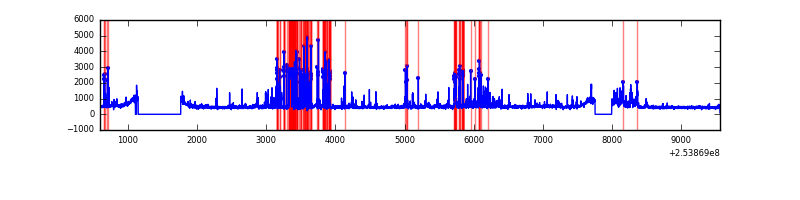 |
Top three noisy pixels from each quadrant. If the there are fewer than three noisy pixels in the level2.evt file, extra rows are filled as -1
| Pixel properties | Quadrant properties | ||||||
|---|---|---|---|---|---|---|---|
| Quadrant | DetID | PixID | Counts | Sigma | Mean | Median | Sigma |
| A | 13 | 251 | 6854664 | 35508.05 | 932 | 909 | 193.0 |
| A | 0 | 23 | 613512 | 3173.78 | 932 | 909 | 193.0 |
| A | 12 | 189 | 89649 | 459.74 | 932 | 909 | 193.0 |
| B | 4 | 239 | 392032 | 1979.77 | 1016 | 990 | 197.5 |
| B | 0 | 187 | 46181 | 228.79 | 1016 | 990 | 197.5 |
| B | 11 | 51 | 37087 | 182.75 | 1016 | 990 | 197.5 |
| C | 14 | 234 | 23365 | 95.95 | 996 | 1004 | 233.0 |
| C | 13 | 61 | 7231 | 26.72 | 996 | 1004 | 233.0 |
| C | 15 | 208 | 3247 | 9.63 | 996 | 1004 | 233.0 |
| D | 1 | 52 | 894991 | 3780.86 | 970 | 943 | 236.5 |
| D | 7 | 80 | 98798 | 413.82 | 970 | 943 | 236.5 |
| D | 7 | 71 | 95645 | 400.49 | 970 | 943 | 236.5 |
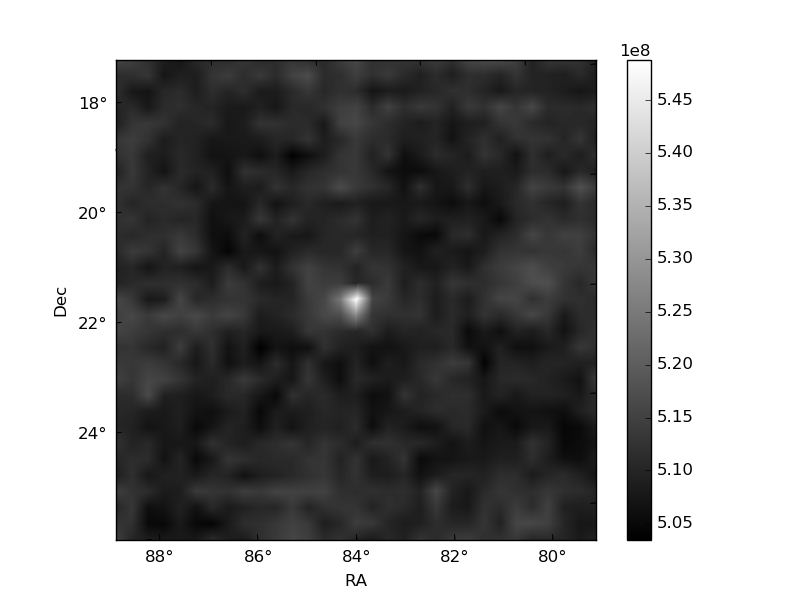
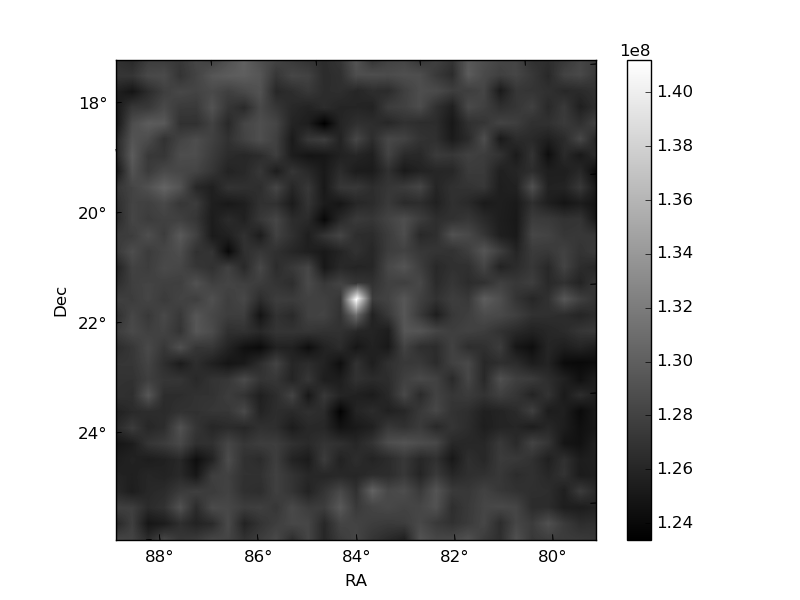
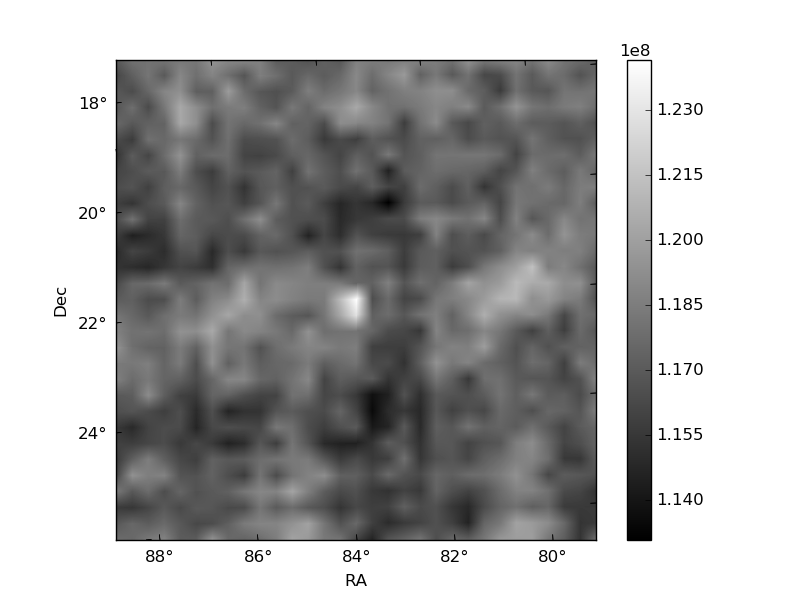
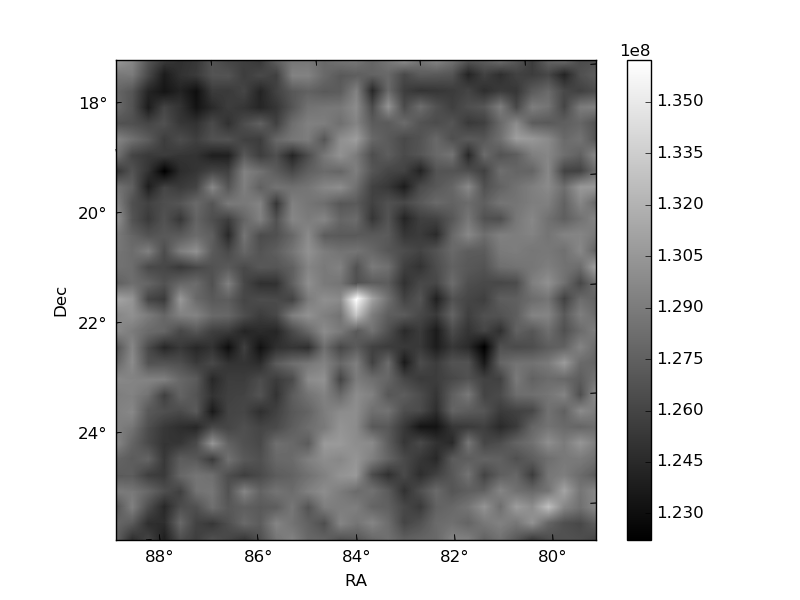
Histogram calculated using DETX and DETY for each event in the final _common_clean file
| Quadrant A | 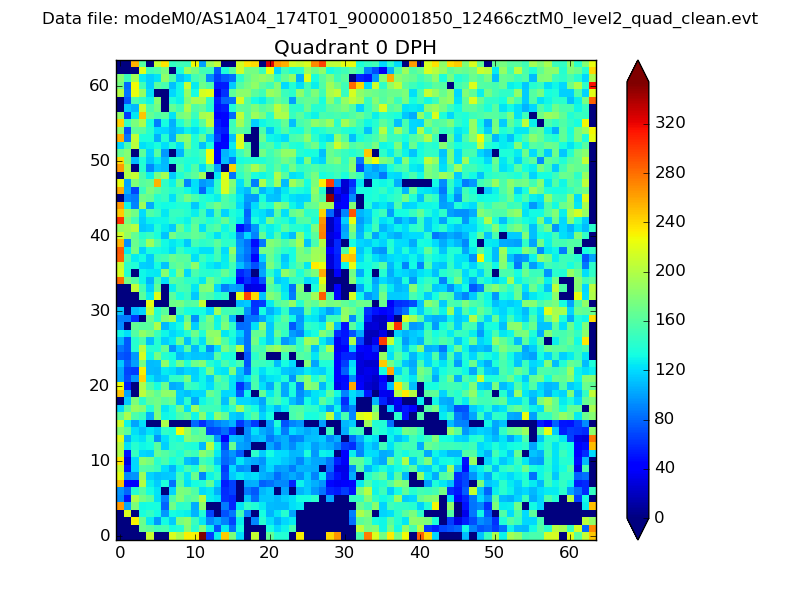 |
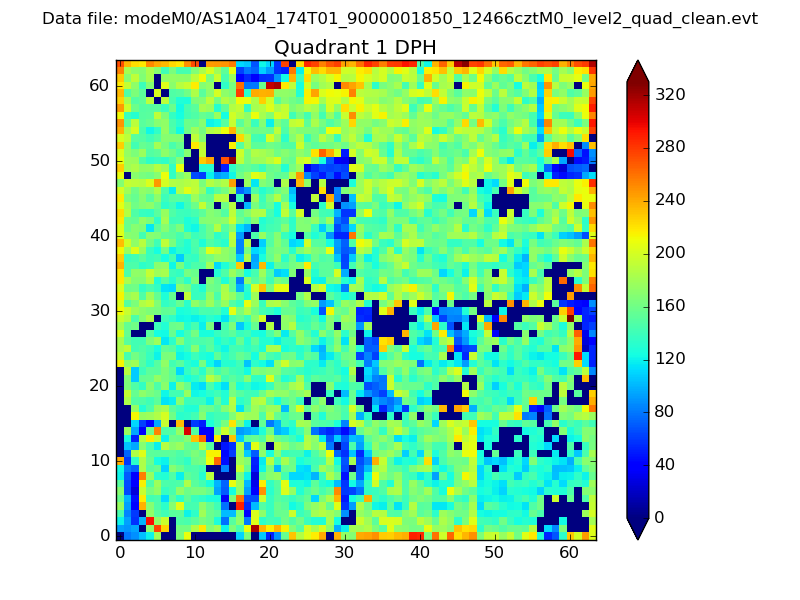 |
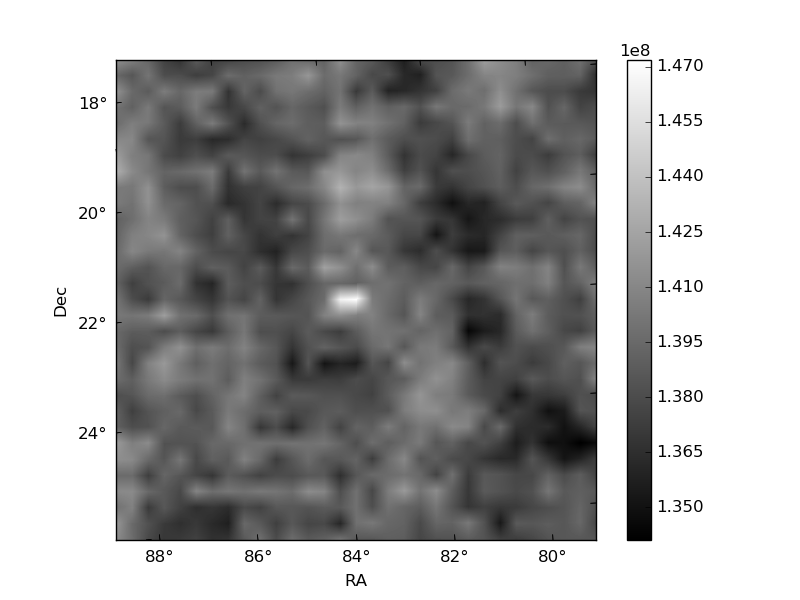
Quadrant B |
|---|---|---|---|
| Quadrant D | 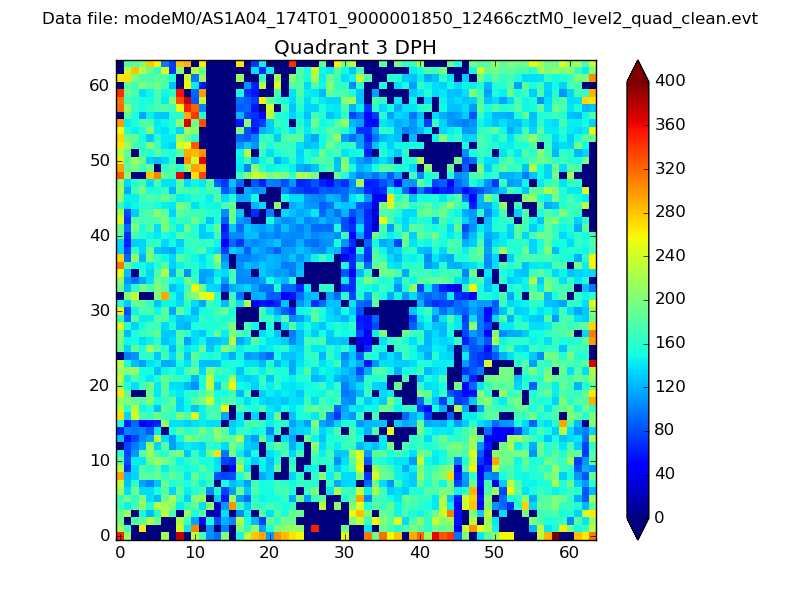 |
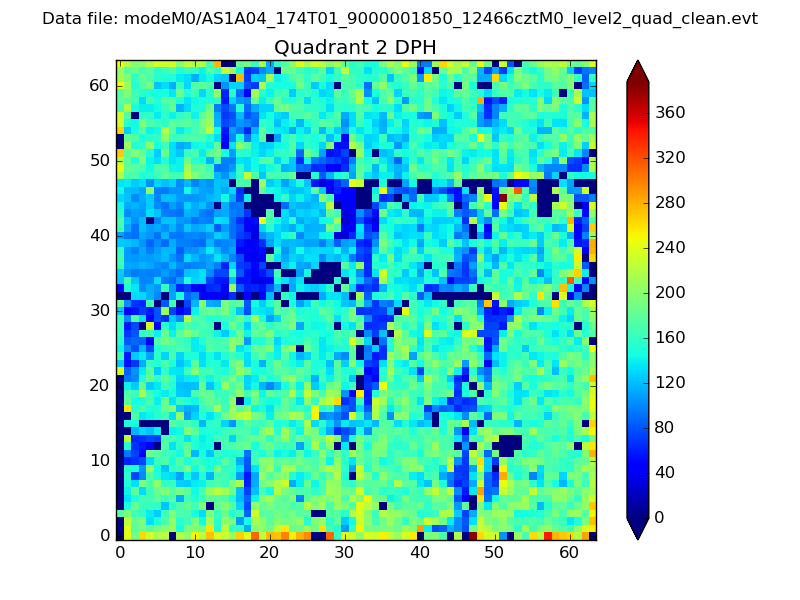 |
Quadrant C |
| Plot type | Count rate plots | Images |
|---|---|---|
| Comparison with Poisson distribution Blue bars denote a histogram of data divided into 1 sec bins. Red curve is a Poisson curve with rate = median count rate of data. |
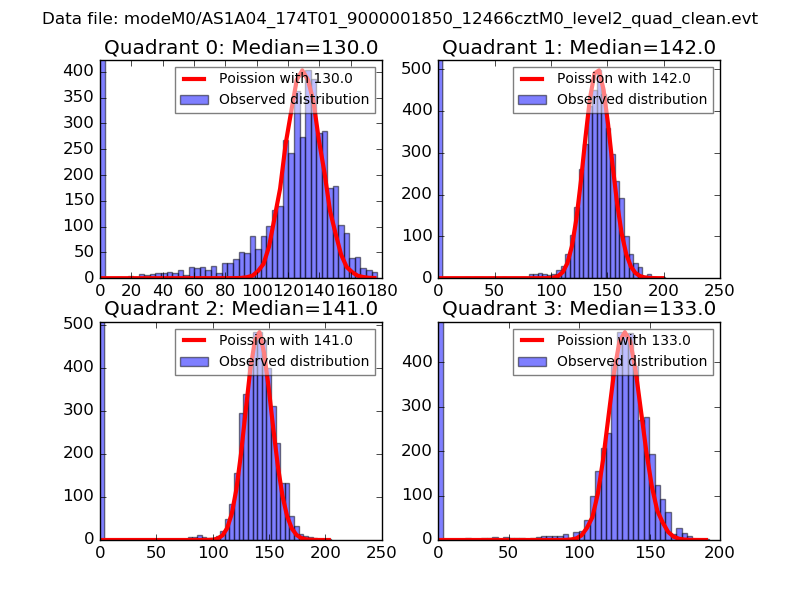 |
 |
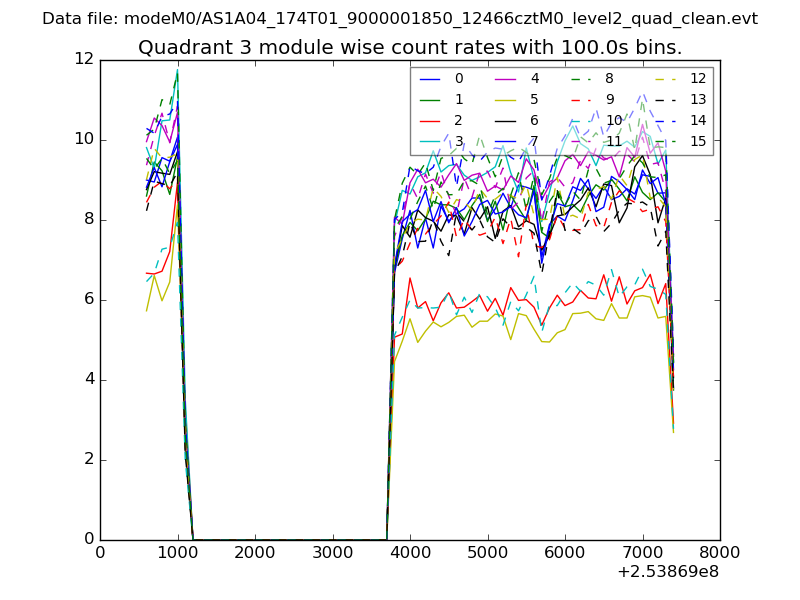
| Quadrant-wise count rates Data is divided into 100 sec bins |
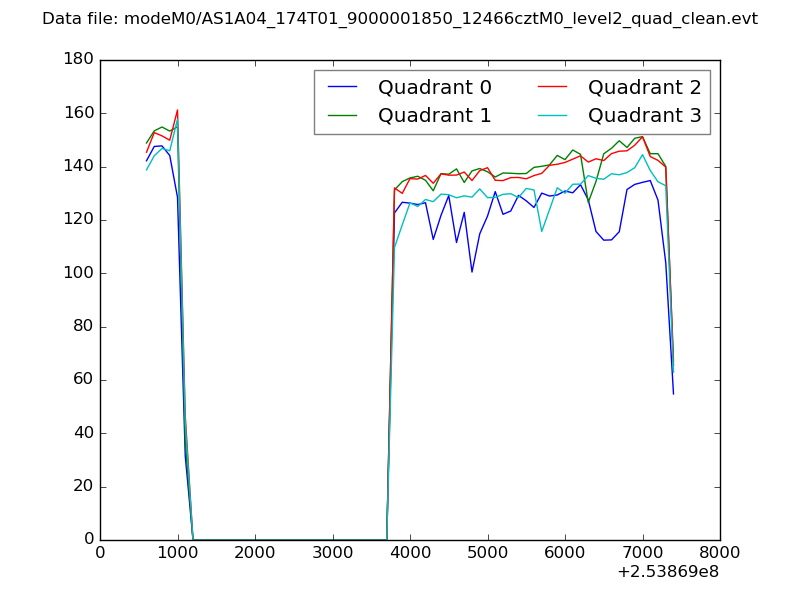 |
|
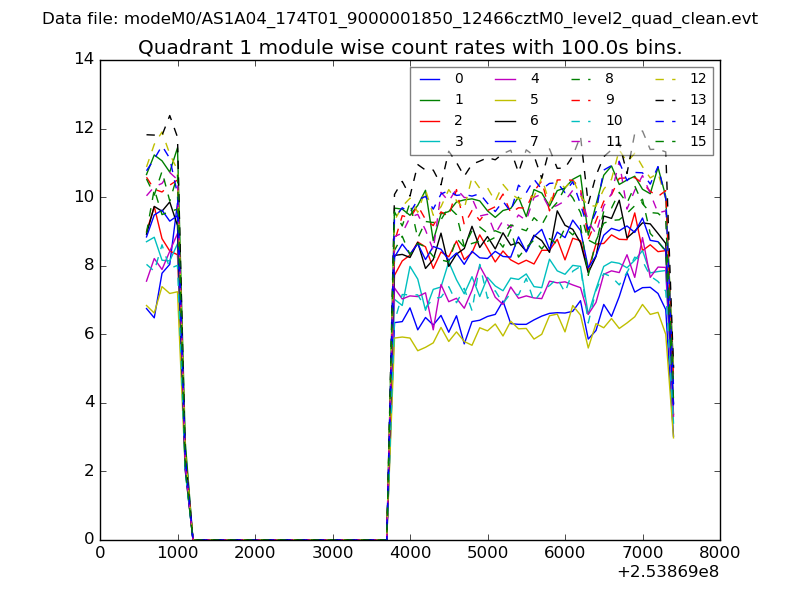
| Module-wise count rates for Quadrant A Data is divided into 100 sec bins |
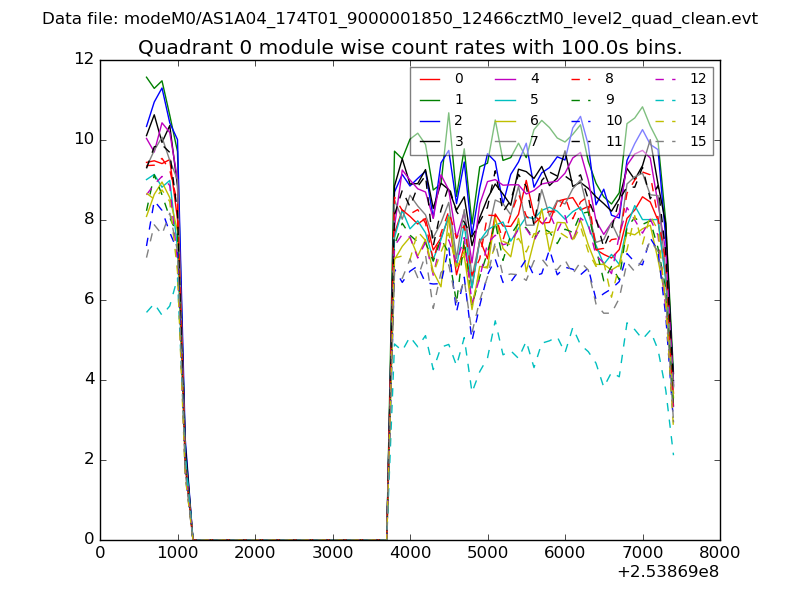 |
 |
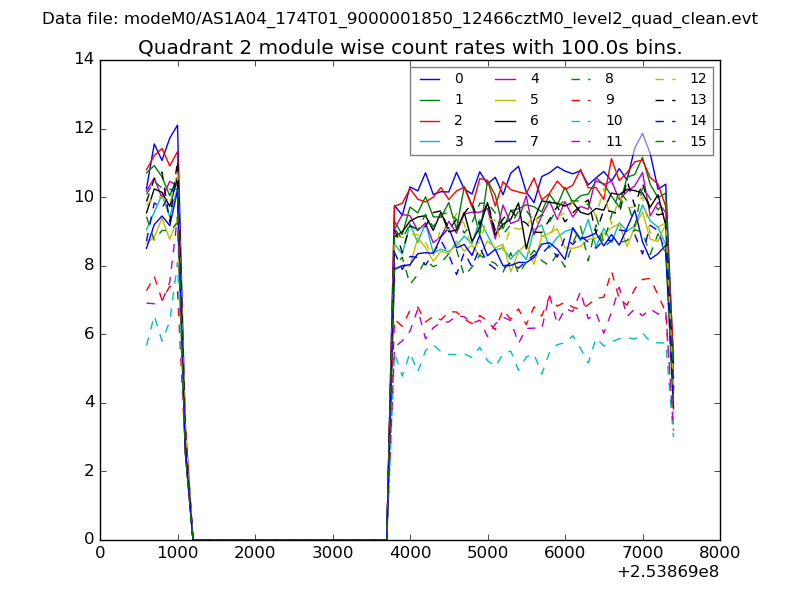
| Module-wise count rates for Quadrant B Data is divided into 100 sec bins |
 |
 |
| Module-wise count rates for Quadrant C Data is divided into 100 sec bins |
 |
 |
| Module-wise count rates for Quadrant D Data is divided into 100 sec bins |
 |
 |
| Parameter | Plot |
|---|---|
| CZT HV Monitor | 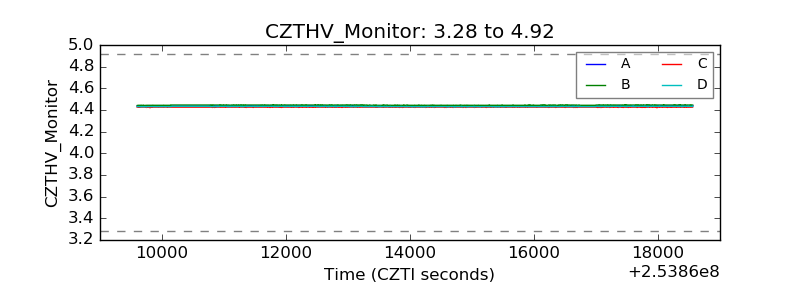 |
| D_VDD | 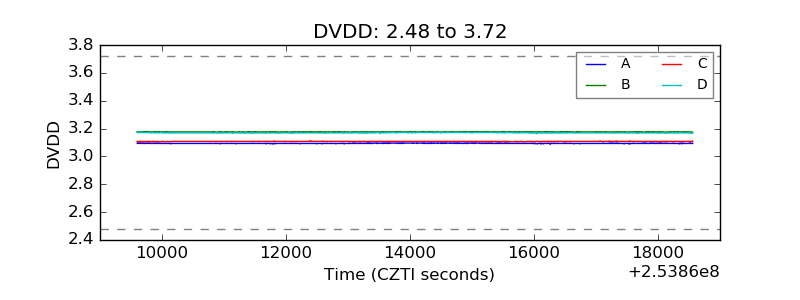 |
| Temperature 1 | 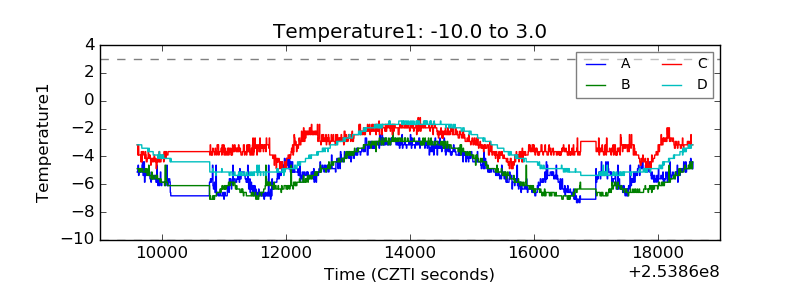 |
| Veto HV Monitor | 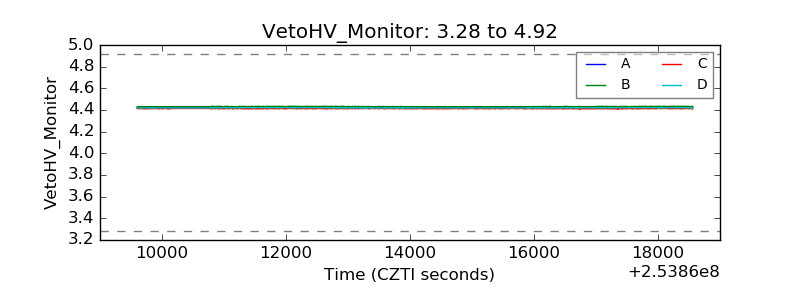 |
| Veto LLD | 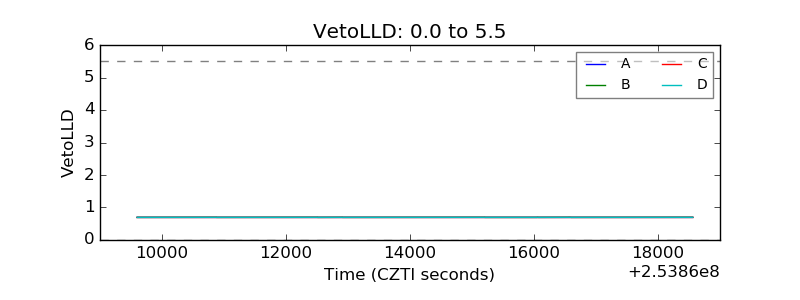 |
| Alpha Counter | 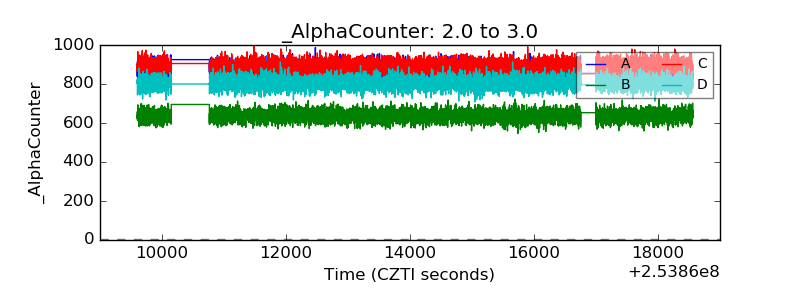 |
| _CPM_Rate | 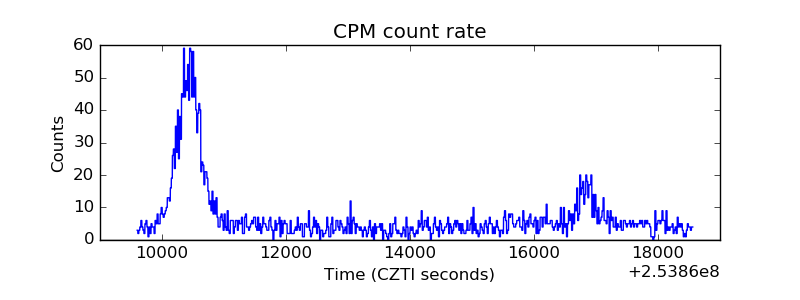 |
| CZT Counter | 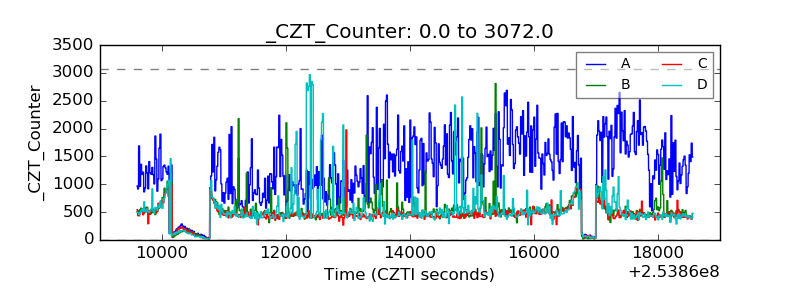 |
| +2.5 Volts monitor |  |
| +5 Volts monitor |  |
| _ROLL_ROT | 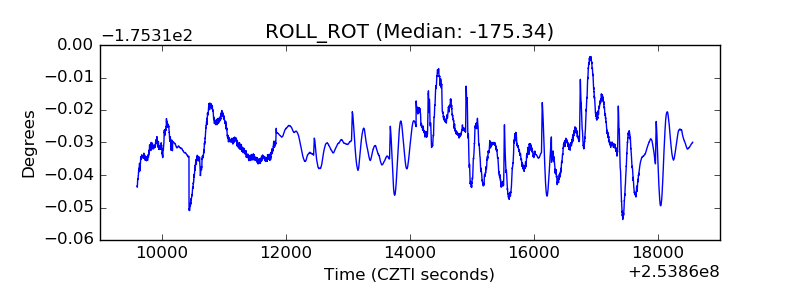 |
| _Roll_DEC | 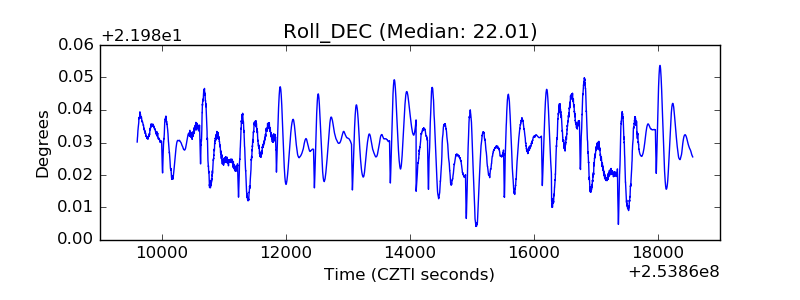 |
| _Roll_RA | 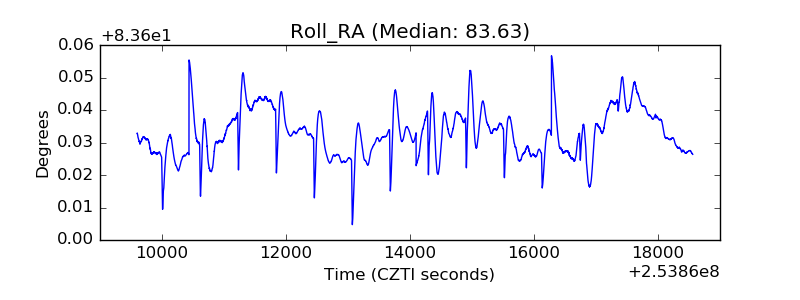 |
| Veto Counter | 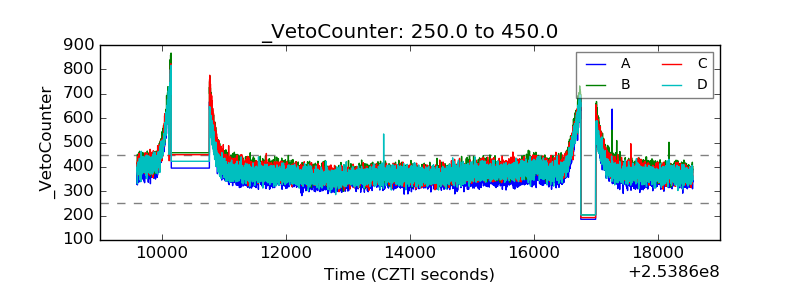 |