| Param | Original file | Final file |
|---|---|---|
| Filename | modeM0/AS1A04_174T01_9000001850_12468cztM0_level2.evt | modeM0/AS1A04_174T01_9000001850_12468cztM0_level2_quad_clean.evt |
| Size (bytes) | 907,076,160 | 85,933,440 |
| Size | 865.1 MB | 82.0 MB |
| Events in quadrant A | 15,171,757 | 332,127 |
| Events in quadrant B | 3,836,314 | 611,992 |
| Events in quadrant C | 3,186,547 | 617,235 |
| Events in quadrant D | 4,811,575 | 560,589 |
| Mode M0 | |||
|---|---|---|---|
| Quadrant | BADHDUFLAG | Total packets | Discarded packets |
| A | 0 | 49697 | 2 |
| B | 0 | 15580 | 1 |
| C | 0 | 13944 | 1 |
| D | 0 | 18875 | 1 |
| Mode M9 | |||
|---|---|---|---|
| Quadrant | BADHDUFLAG | Total packets | Discarded packets |
| A | 0 | 4 | 0 |
| B | 0 | 4 | 0 |
| C | 0 | 4 | 0 |
| D | 0 | 4 | 0 |
| Mode SS | |||
|---|---|---|---|
| Quadrant | BADHDUFLAG | Total packets | Discarded packets |
| A | 0 | 140 | 0 |
| B | 0 | 140 | 0 |
| C | 0 | 140 | 0 |
| D | 0 | 140 | 0 |
| Quadrant | Total seconds | Saturated seconds | Saturation percentage |
|---|---|---|---|
| A | 6860 | 6418 | 93.556851% |
| B | 6860 | 218 | 3.177843% |
| C | 6860 | 50 | 0.728863% |
| D | 6860 | 387 | 5.641399% |
Noise dominated data is calculated using 1-second bins in cleaned event files. If a bin has >2000 counts, and if more than 50% of those come from <1% of pixels, then it is considered to be noise-dominated and hence unusable.
| Quadrant | # 1 sec bins | Bins with >0 counts | Bins with >2000 counts | High rate bins dominated by noise | Noise dominated (total time) | Noise dominated (detector-on time) | Marked lightcurve |
|---|---|---|---|---|---|---|---|
| A | 7230 | 6860 | 5281 | 5281 | 73.04% | 76.98% | 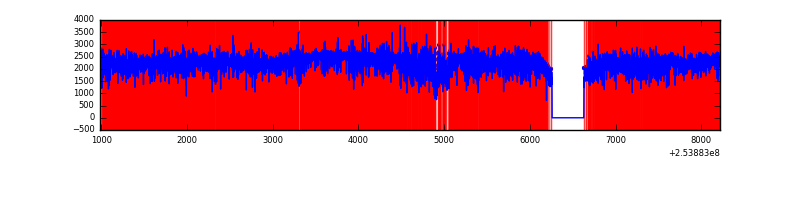 |
| B | 7231 | 6861 | 75 | 75 | 1.04% | 1.09% | 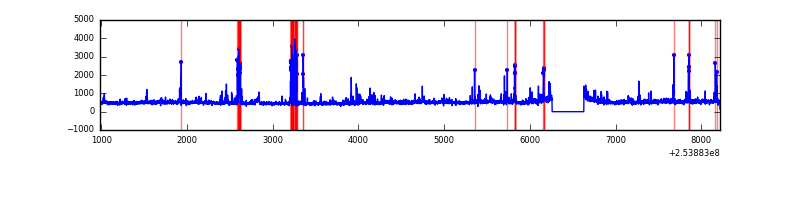 |
| C | 7231 | 6862 | 0 | 0 | 0.00% | 0.00% | 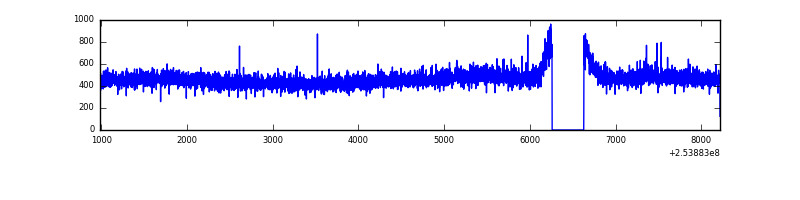 |
| D | 7231 | 6861 | 302 | 302 | 4.18% | 4.40% | 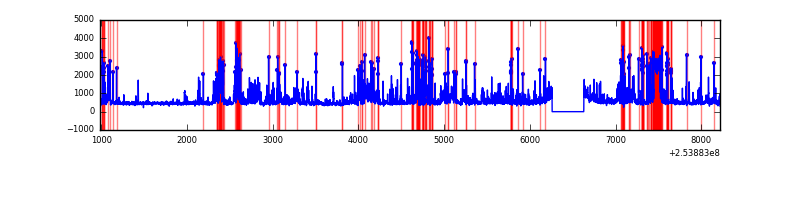 |
Top three noisy pixels from each quadrant. If the there are fewer than three noisy pixels in the level2.evt file, extra rows are filled as -1
| Pixel properties | Quadrant properties | ||||||
|---|---|---|---|---|---|---|---|
| Quadrant | DetID | PixID | Counts | Sigma | Mean | Median | Sigma |
| A | 13 | 251 | 10966984 | 101543.05 | 520 | 511 | 108.0 |
| A | 0 | 23 | 1941084 | 17968.56 | 520 | 511 | 108.0 |
| A | 0 | 226 | 133837 | 1234.52 | 520 | 511 | 108.0 |
| B | 4 | 239 | 276353 | 1733.8 | 828 | 810 | 158.9 |
| B | 3 | 64 | 159610 | 999.22 | 828 | 810 | 158.9 |
| B | 0 | 187 | 49537 | 306.61 | 828 | 810 | 158.9 |
| C | 3 | 233 | 10701 | 52.06 | 814 | 821 | 189.8 |
| C | 13 | 61 | 6012 | 27.35 | 814 | 821 | 189.8 |
| C | 3 | 202 | 2027 | 6.35 | 814 | 821 | 189.8 |
| D | 1 | 52 | 1480353 | 7690.08 | 790 | 767 | 192.4 |
| D | 13 | 104 | 94842 | 488.95 | 790 | 767 | 192.4 |
| D | 13 | 249 | 71671 | 368.52 | 790 | 767 | 192.4 |
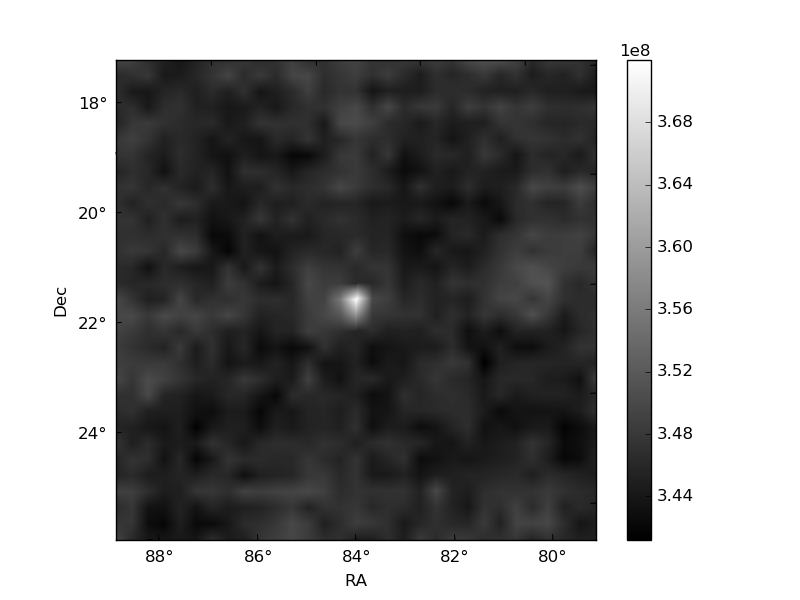
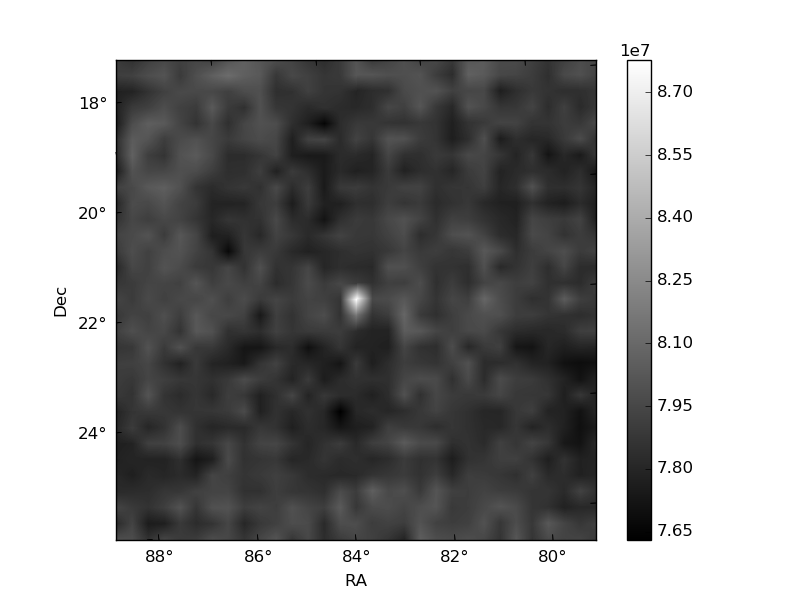
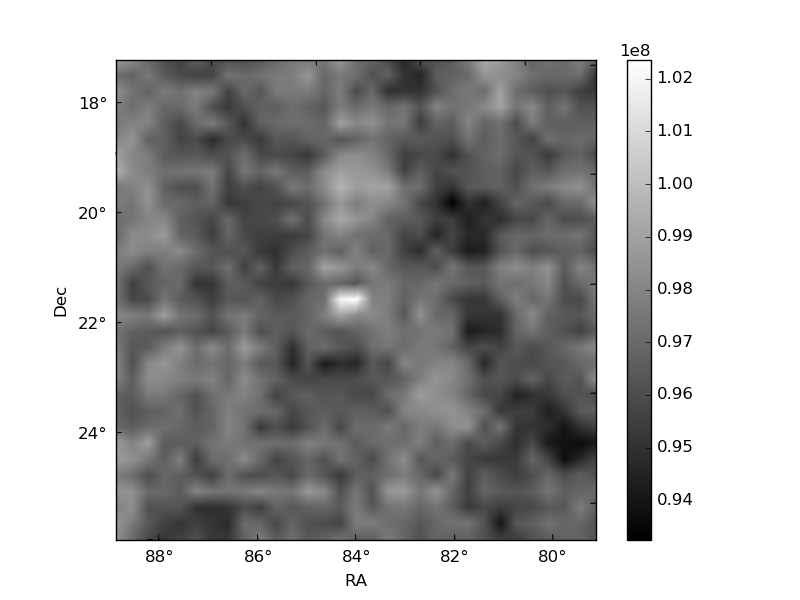
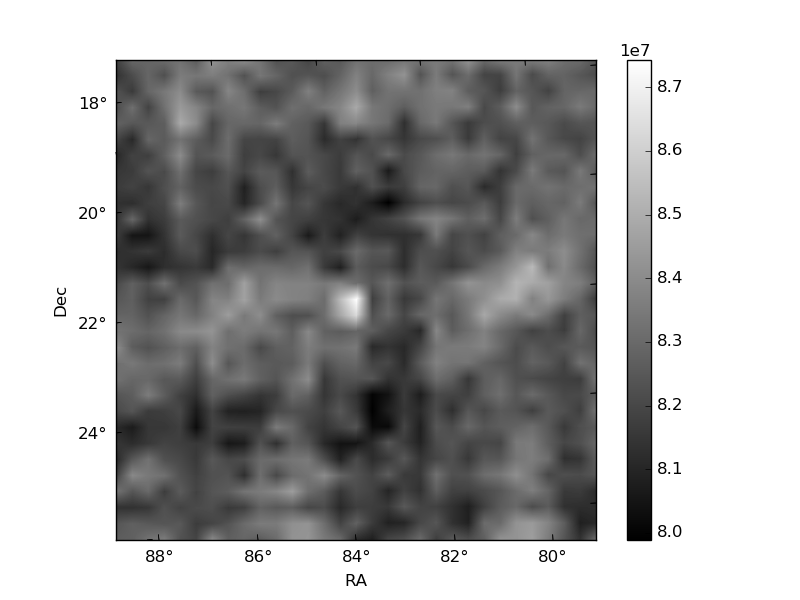
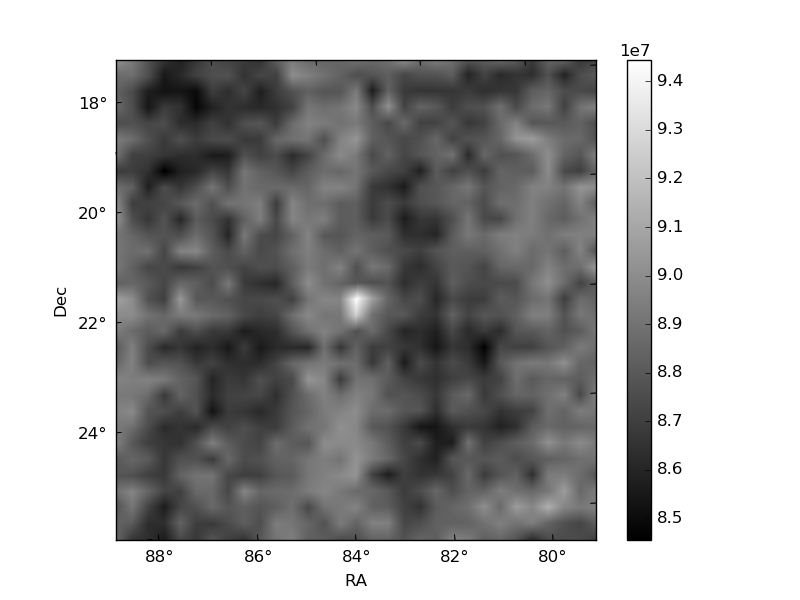
Histogram calculated using DETX and DETY for each event in the final _common_clean file
| Quadrant A | 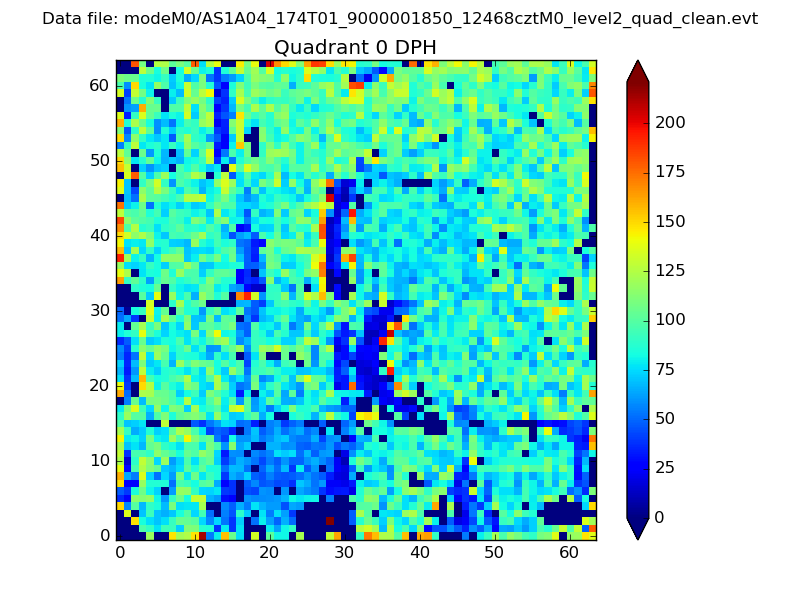 |
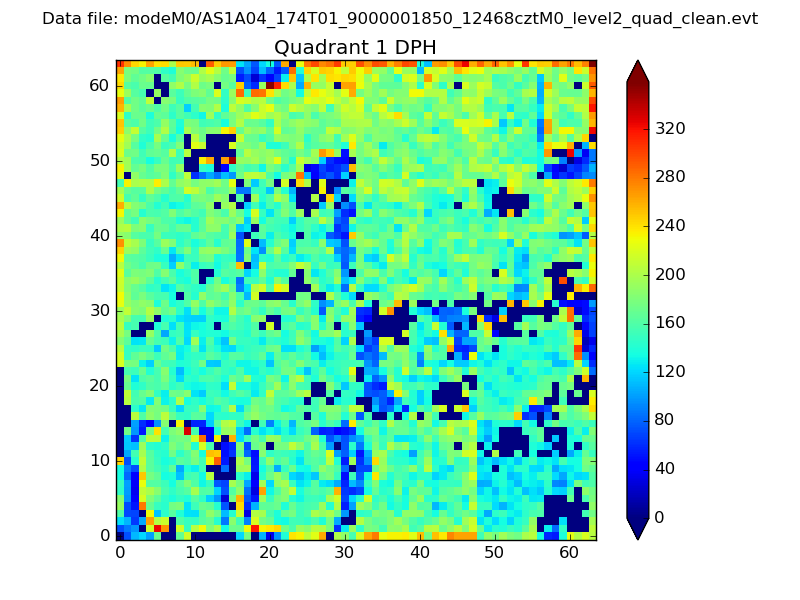 |
Quadrant B |
|---|---|---|---|
| Quadrant D | 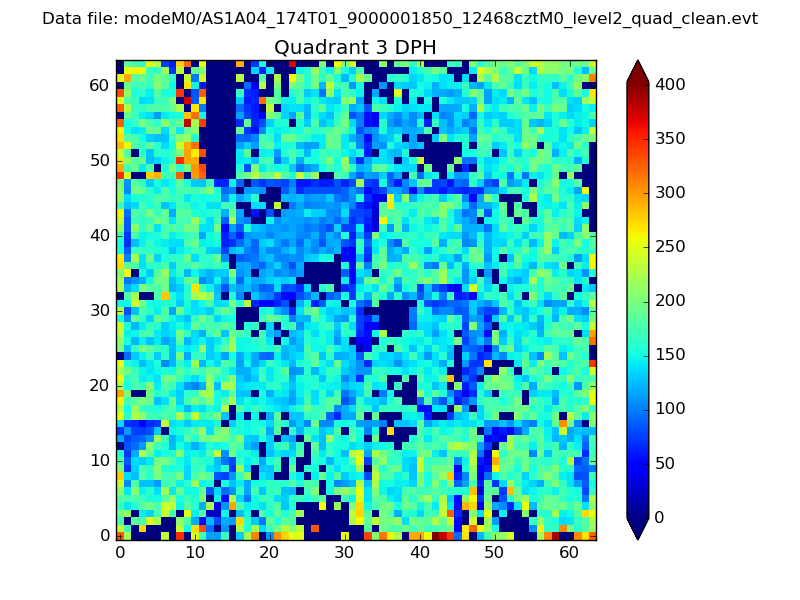 |
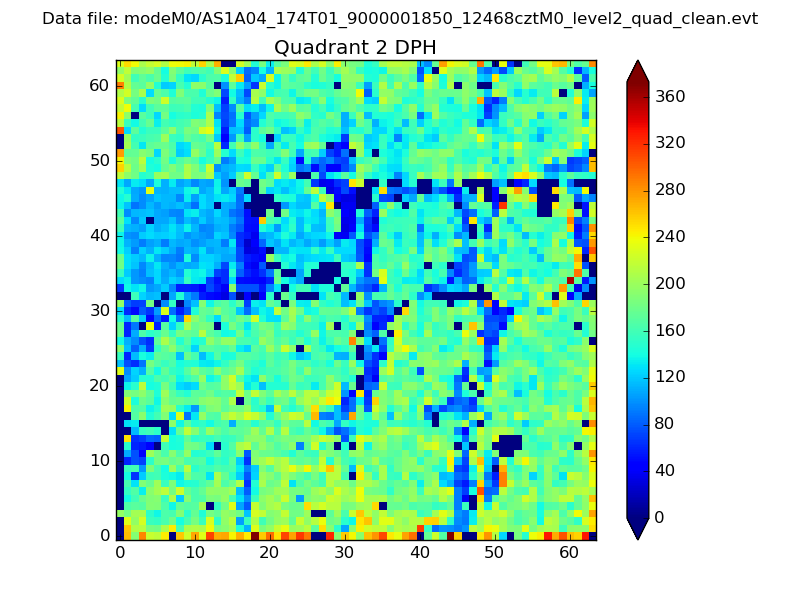 |
Quadrant C |
| Plot type | Count rate plots | Images |
|---|---|---|
| Comparison with Poisson distribution Blue bars denote a histogram of data divided into 1 sec bins. Red curve is a Poisson curve with rate = median count rate of data. |
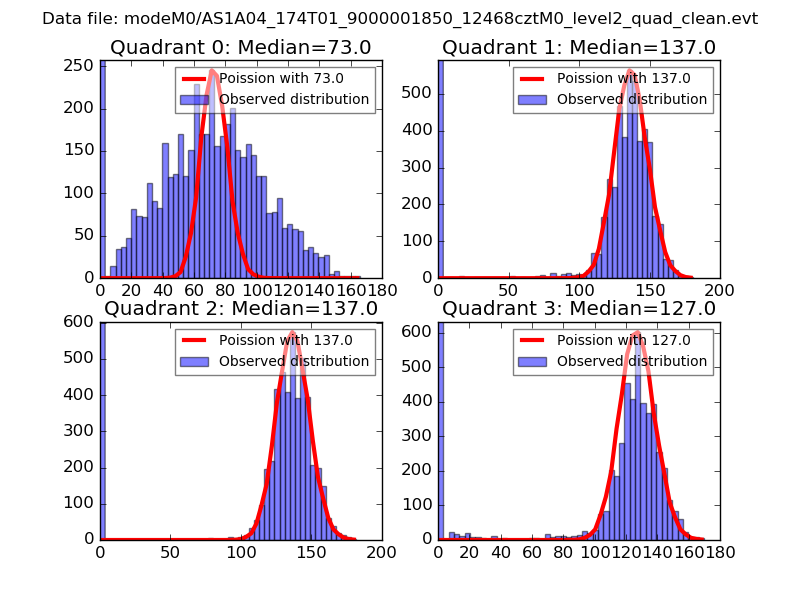 |
 |
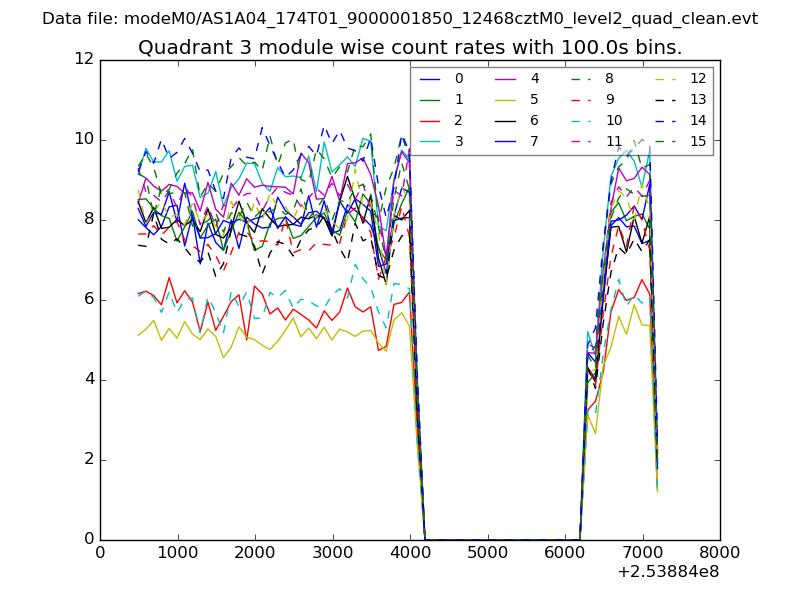
| Quadrant-wise count rates Data is divided into 100 sec bins |
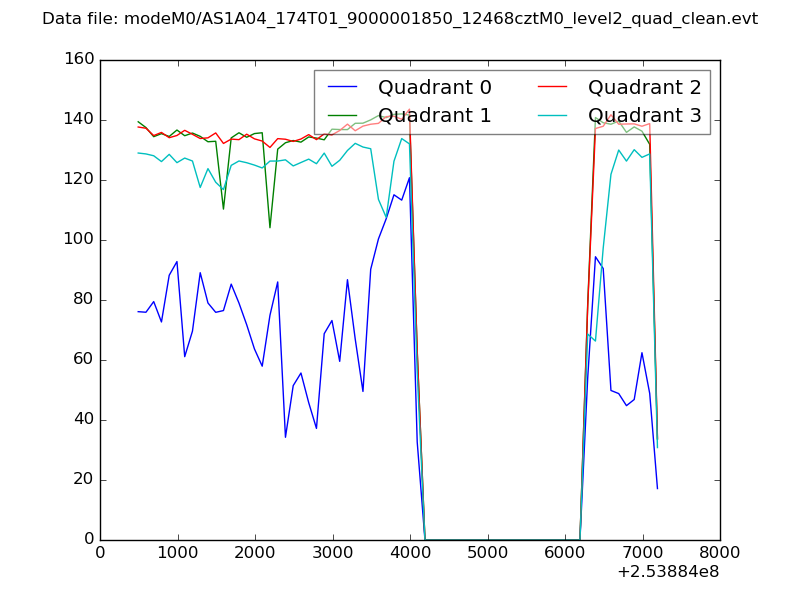 |
|
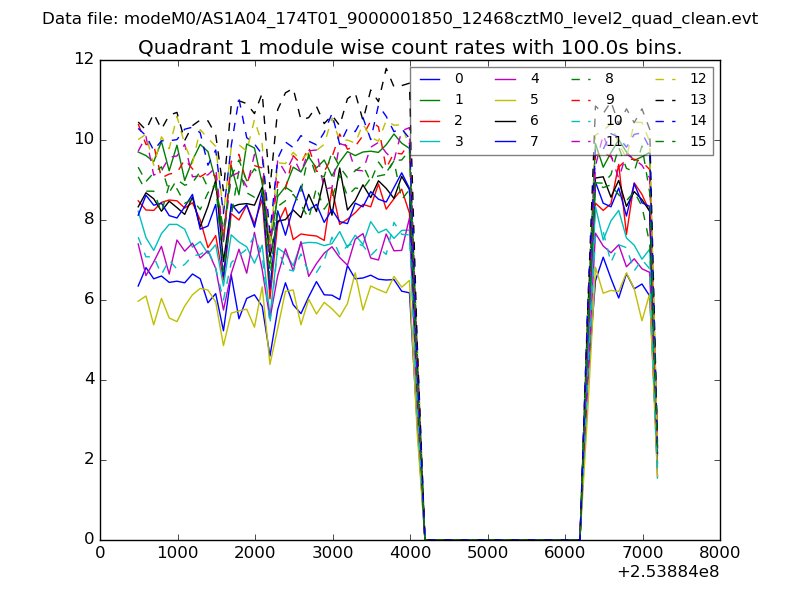
| Module-wise count rates for Quadrant A Data is divided into 100 sec bins |
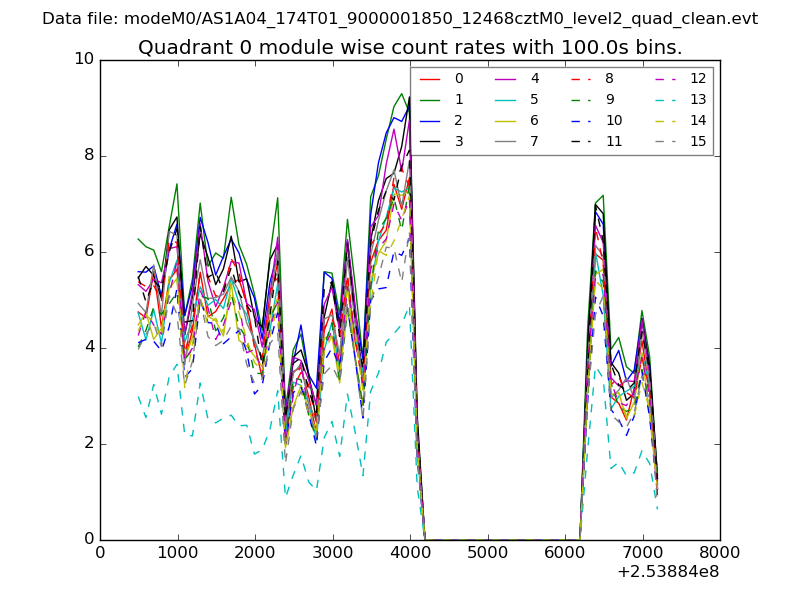 |
 |
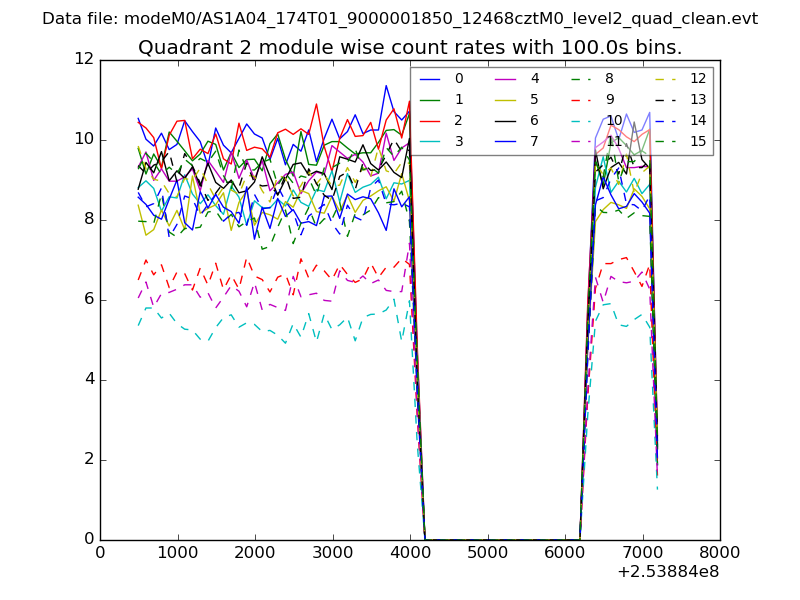
| Module-wise count rates for Quadrant B Data is divided into 100 sec bins |
 |
 |
| Module-wise count rates for Quadrant C Data is divided into 100 sec bins |
 |
 |
| Module-wise count rates for Quadrant D Data is divided into 100 sec bins |
 |
 |
| Parameter | Plot |
|---|---|
| CZT HV Monitor |  |
| D_VDD | 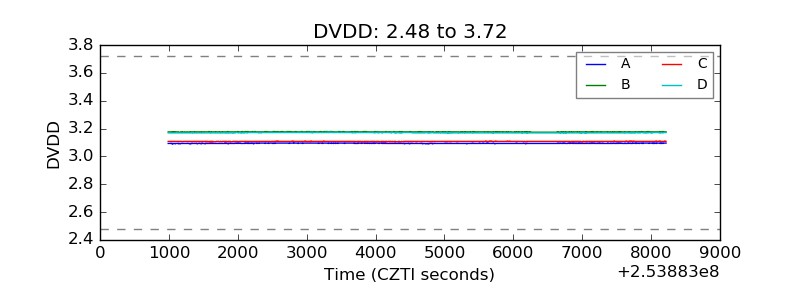 |
| Temperature 1 | 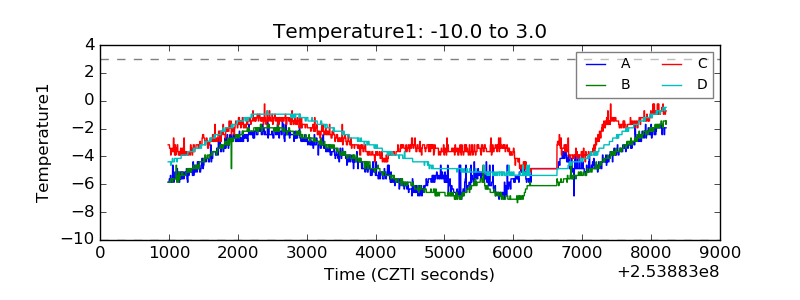 |
| Veto HV Monitor | 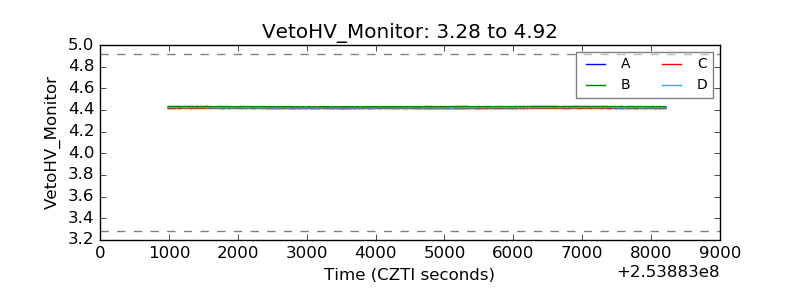 |
| Veto LLD | 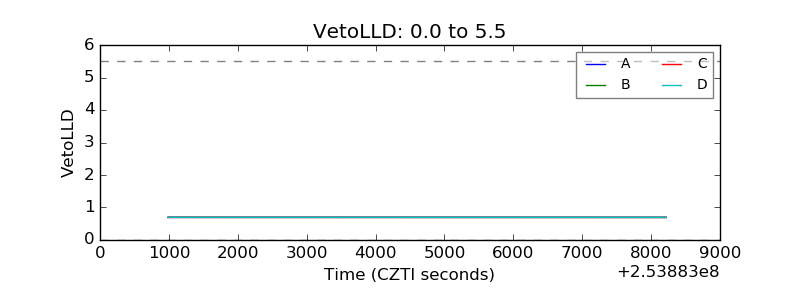 |
| Alpha Counter | 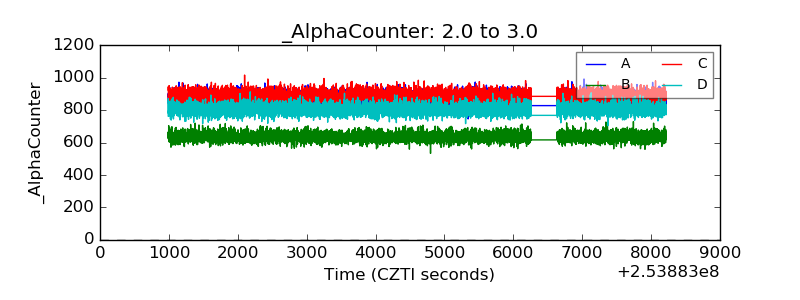 |
| _CPM_Rate | 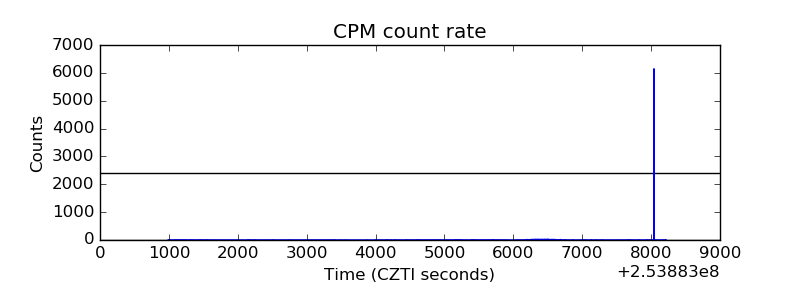 |
| CZT Counter | 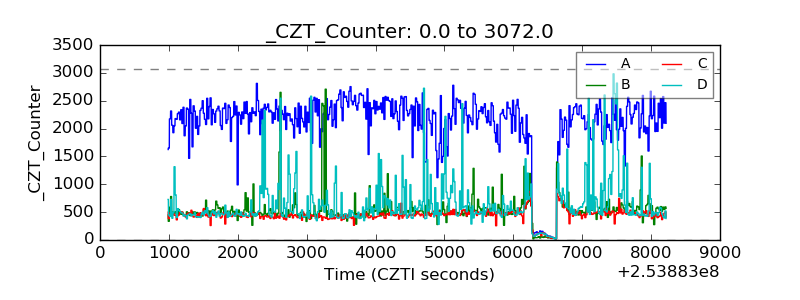 |
| +2.5 Volts monitor |  |
| +5 Volts monitor | 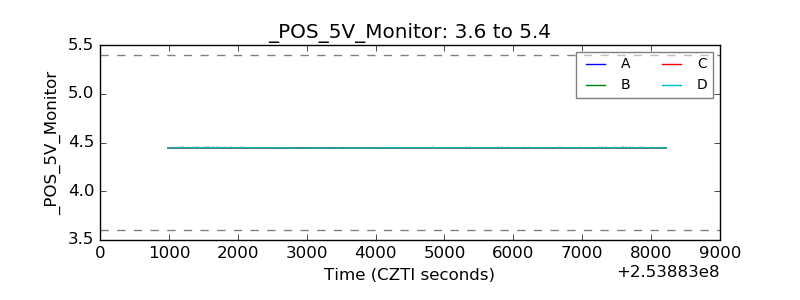 |
| _ROLL_ROT | 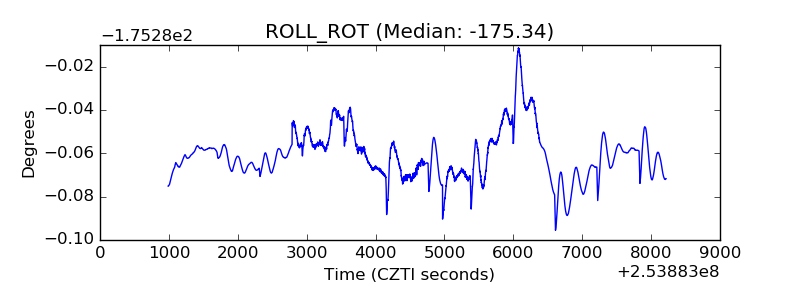 |
| _Roll_DEC | 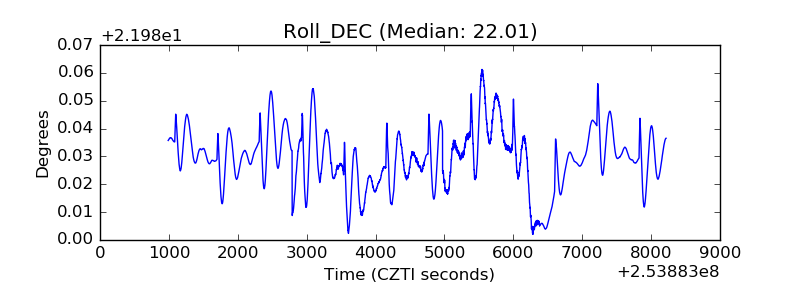 |
| _Roll_RA | 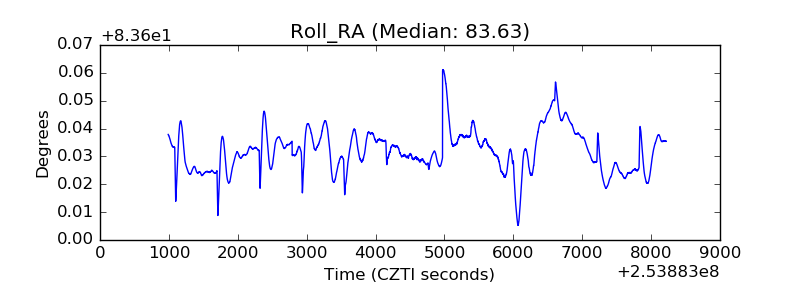 |
| Veto Counter | 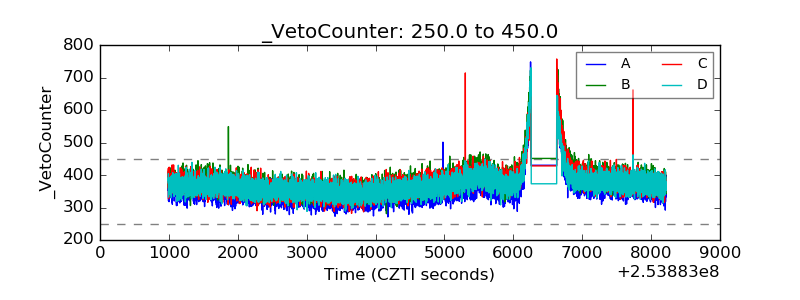 |