| Param | Original file | Final file |
|---|---|---|
| Filename | modeM0/AS1A04_174T01_9000001850_12470cztM0_level2.evt | modeM0/AS1A04_174T01_9000001850_12470cztM0_level2_quad_clean.evt |
| Size (bytes) | 1,361,419,200 | 140,621,760 |
| Size | 1.3 GB | 134.1 MB |
| Events in quadrant A | 21,962,326 | 649,543 |
| Events in quadrant B | 6,003,490 | 982,729 |
| Events in quadrant C | 4,886,203 | 984,438 |
| Events in quadrant D | 7,661,425 | 902,424 |
| Mode M0 | |||
|---|---|---|---|
| Quadrant | BADHDUFLAG | Total packets | Discarded packets |
| A | 0 | 72588 | 1 |
| B | 0 | 24588 | 1 |
| C | 0 | 21584 | 1 |
| D | 0 | 30005 | 1 |
| Mode M9 | |||
|---|---|---|---|
| Quadrant | BADHDUFLAG | Total packets | Discarded packets |
| A | 0 | 12 | 0 |
| B | 0 | 11 | 0 |
| C | 0 | 11 | 0 |
| D | 0 | 11 | 0 |
| Mode SS | |||
|---|---|---|---|
| Quadrant | BADHDUFLAG | Total packets | Discarded packets |
| A | 0 | 218 | 0 |
| B | 0 | 218 | 0 |
| C | 0 | 218 | 0 |
| D | 0 | 218 | 0 |
| Quadrant | Total seconds | Saturated seconds | Saturation percentage |
|---|---|---|---|
| A | 10637 | 7844 | 73.742597% |
| B | 10637 | 241 | 2.265676% |
| C | 10637 | 70 | 0.658080% |
| D | 10637 | 530 | 4.982608% |
Noise dominated data is calculated using 1-second bins in cleaned event files. If a bin has >2000 counts, and if more than 50% of those come from <1% of pixels, then it is considered to be noise-dominated and hence unusable.
| Quadrant | # 1 sec bins | Bins with >0 counts | Bins with >2000 counts | High rate bins dominated by noise | Noise dominated (total time) | Noise dominated (detector-on time) | Marked lightcurve |
|---|---|---|---|---|---|---|---|
| A | 11202 | 10637 | 6316 | 6316 | 56.38% | 59.38% | 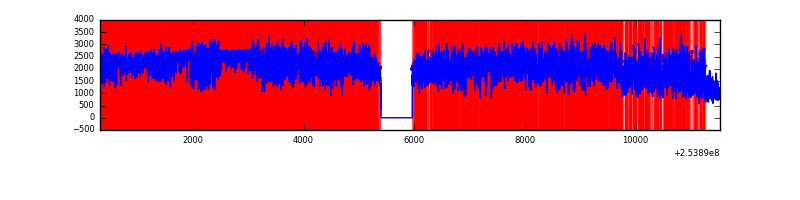 |
| B | 11202 | 10637 | 71 | 71 | 0.63% | 0.67% | 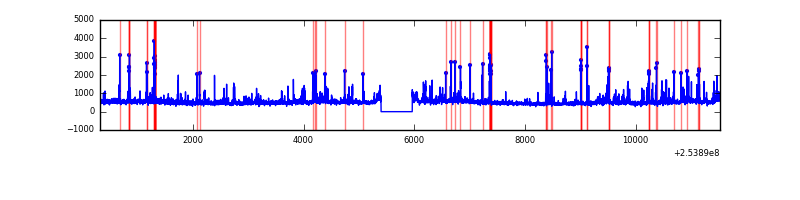 |
| C | 11202 | 10638 | 1 | 1 | 0.01% | 0.01% | 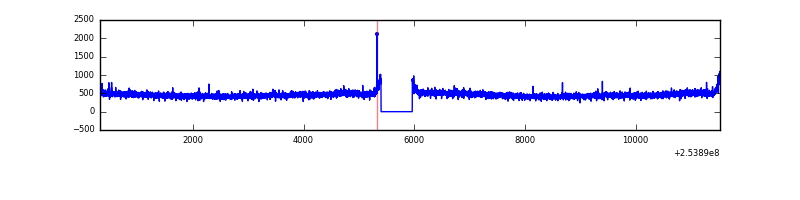 |
| D | 11202 | 10637 | 404 | 404 | 3.61% | 3.80% | 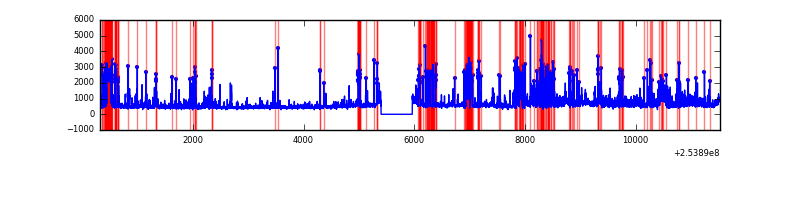 |
Top three noisy pixels from each quadrant. If the there are fewer than three noisy pixels in the level2.evt file, extra rows are filled as -1
| Pixel properties | Quadrant properties | ||||||
|---|---|---|---|---|---|---|---|
| Quadrant | DetID | PixID | Counts | Sigma | Mean | Median | Sigma |
| A | 13 | 251 | 13609440 | 68624.21 | 959 | 939 | 198.3 |
| A | 0 | 23 | 4028453 | 20309.73 | 959 | 939 | 198.3 |
| A | 0 | 226 | 306697 | 1541.86 | 959 | 939 | 198.3 |
| B | 4 | 239 | 497800 | 2052.96 | 1272 | 1241 | 241.9 |
| B | 11 | 51 | 93051 | 379.57 | 1272 | 1241 | 241.9 |
| B | 3 | 64 | 89817 | 366.2 | 1272 | 1241 | 241.9 |
| C | 8 | 128 | 10345 | 31.41 | 1247 | 1259 | 289.3 |
| C | 13 | 61 | 9190 | 27.42 | 1247 | 1259 | 289.3 |
| C | 8 | 112 | 6238 | 17.21 | 1247 | 1259 | 289.3 |
| D | 1 | 52 | 2773718 | 9500.68 | 1209 | 1176 | 291.8 |
| D | 7 | 71 | 73364 | 247.37 | 1209 | 1176 | 291.8 |
| D | 8 | 195 | 57372 | 192.57 | 1209 | 1176 | 291.8 |
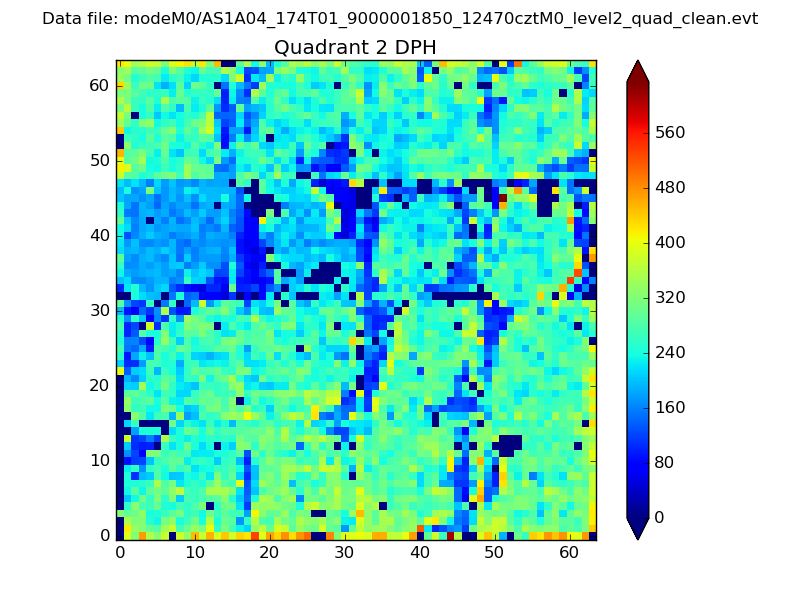
Histogram calculated using DETX and DETY for each event in the final _common_clean file
| Quadrant A | 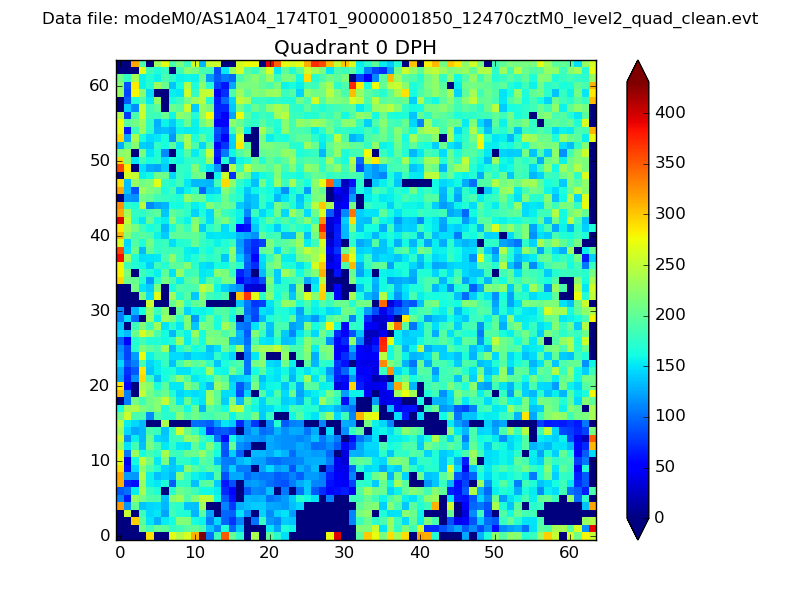 |
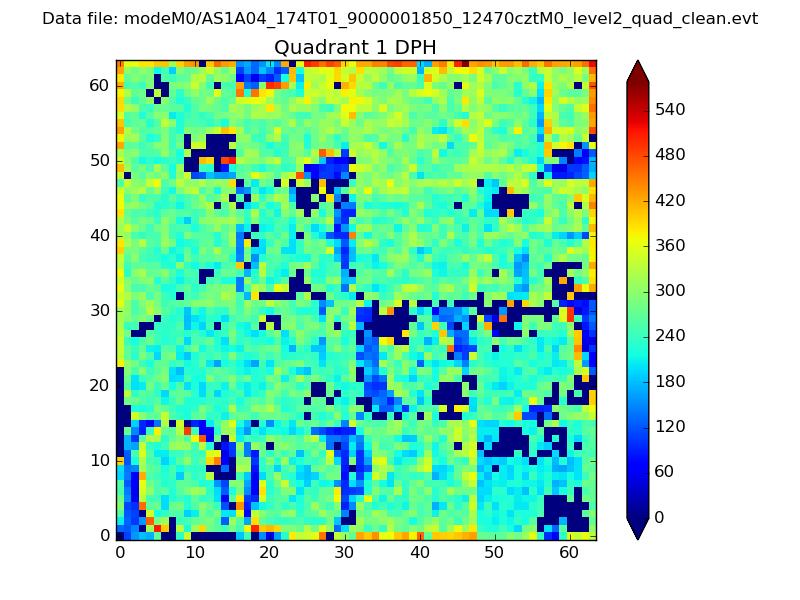 |
Quadrant B |
|---|---|---|---|
| Quadrant D | 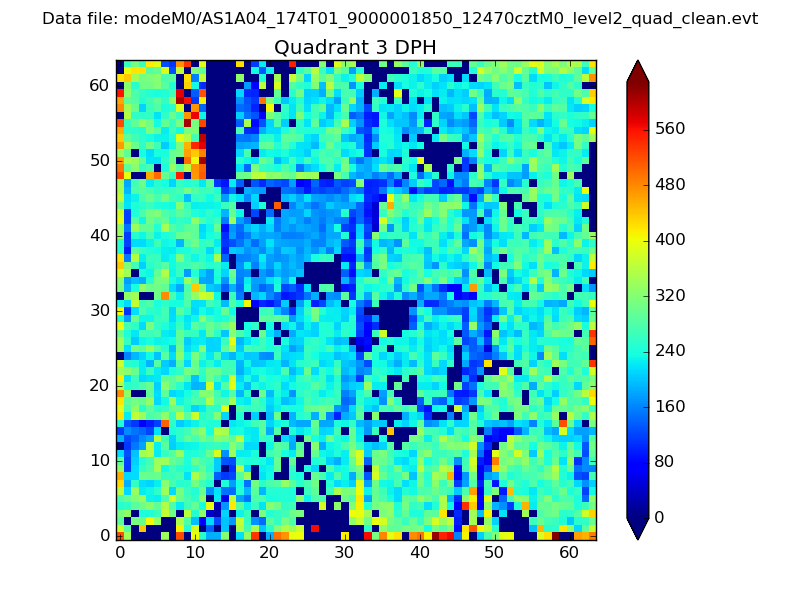 |
 |
Quadrant C |
| Plot type | Count rate plots | Images |
|---|---|---|
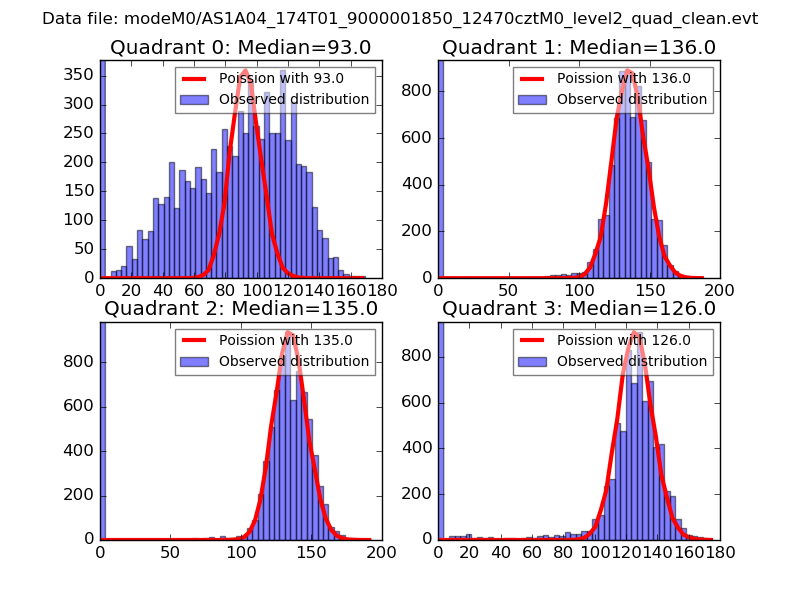
| Comparison with Poisson distribution Blue bars denote a histogram of data divided into 1 sec bins. Red curve is a Poisson curve with rate = median count rate of data. |
 |
 |
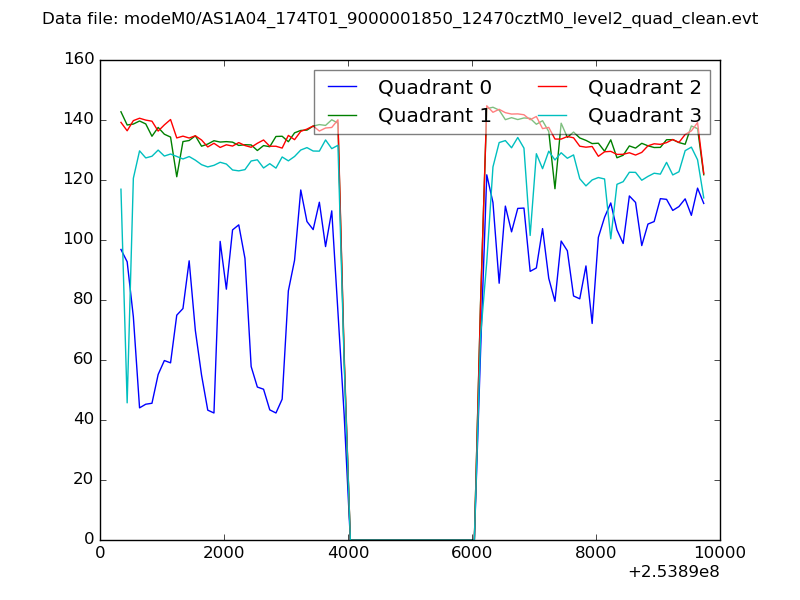
| Quadrant-wise count rates Data is divided into 100 sec bins |
 |
|
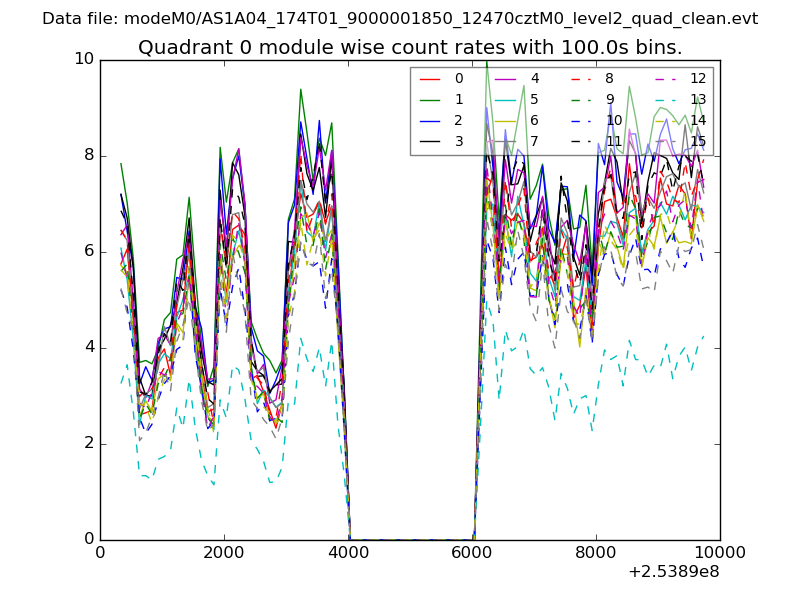
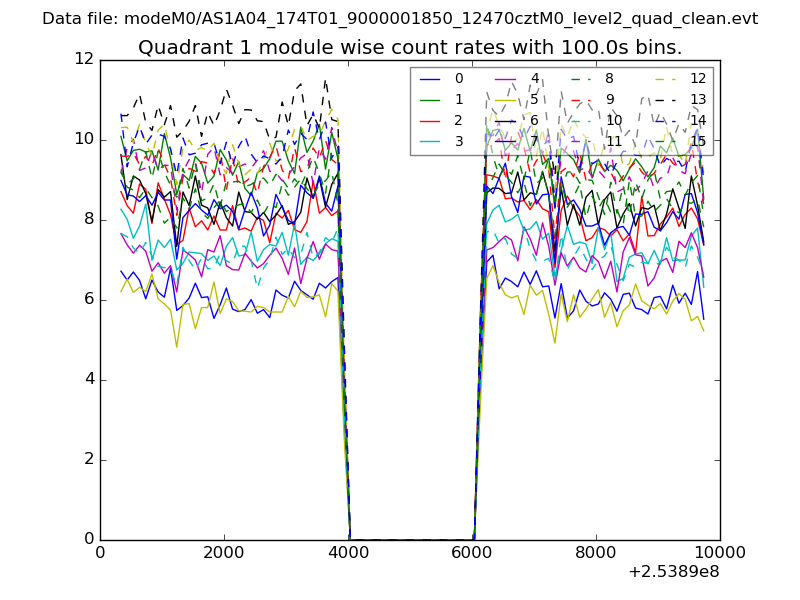
| Module-wise count rates for Quadrant A Data is divided into 100 sec bins |
 |
 |
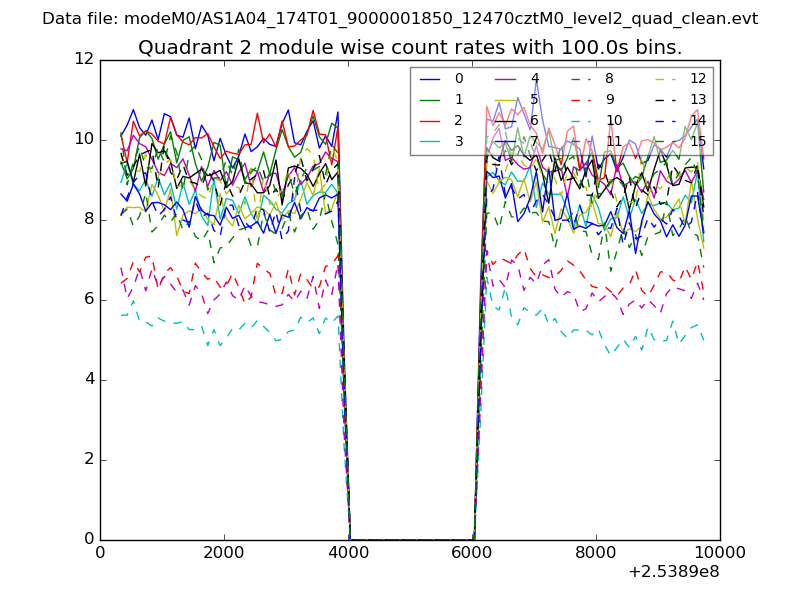
| Module-wise count rates for Quadrant B Data is divided into 100 sec bins |
 |
 |
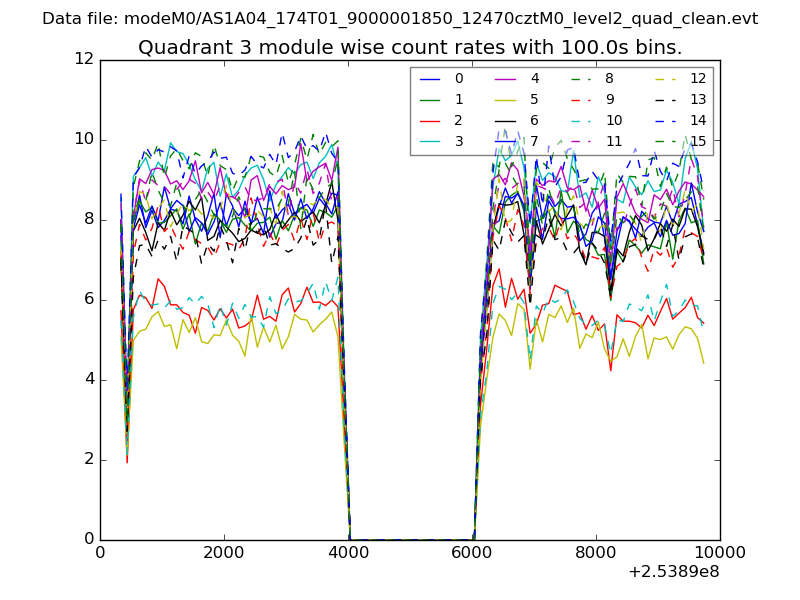
| Module-wise count rates for Quadrant C Data is divided into 100 sec bins |
 |
 |
| Module-wise count rates for Quadrant D Data is divided into 100 sec bins |
 |
 |
| Parameter | Plot |
|---|---|
| CZT HV Monitor | 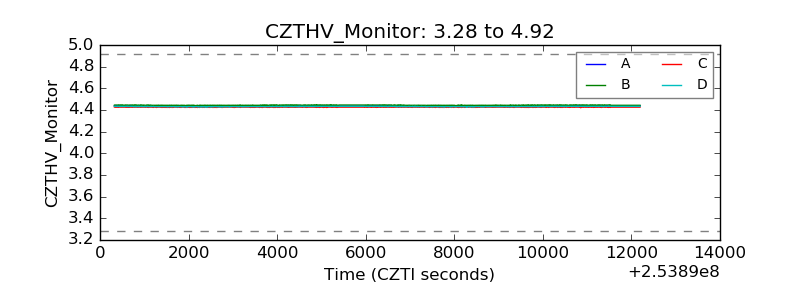 |
| D_VDD | 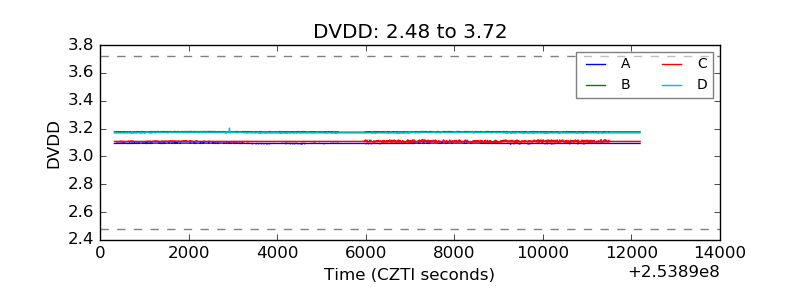 |
| Temperature 1 | 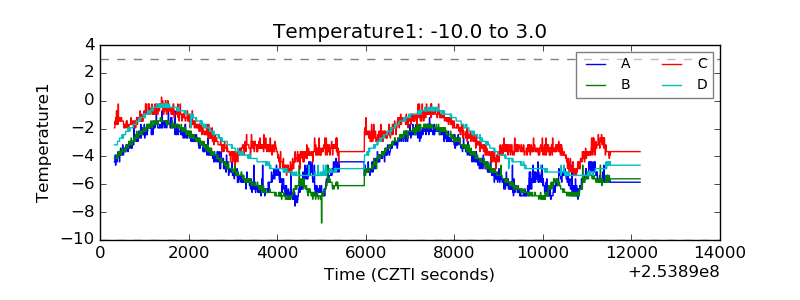 |
| Veto HV Monitor | 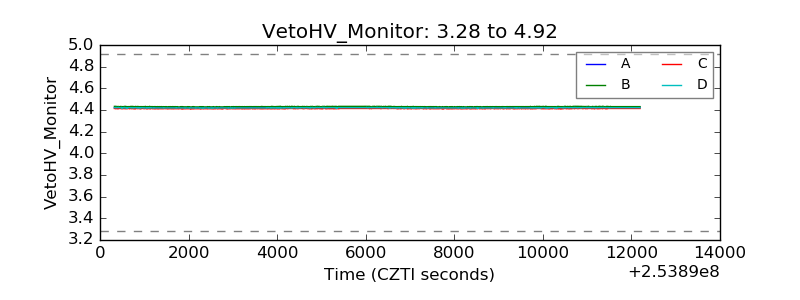 |
| Veto LLD | 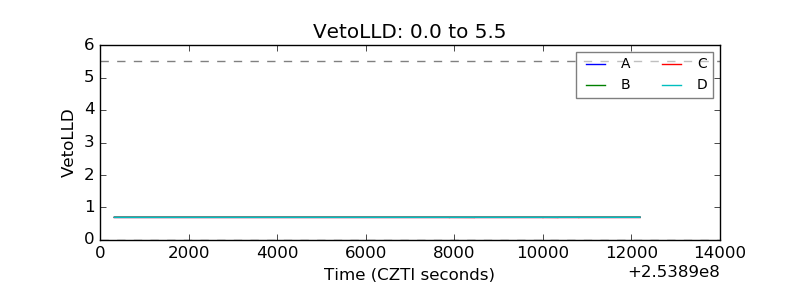 |
| Alpha Counter | 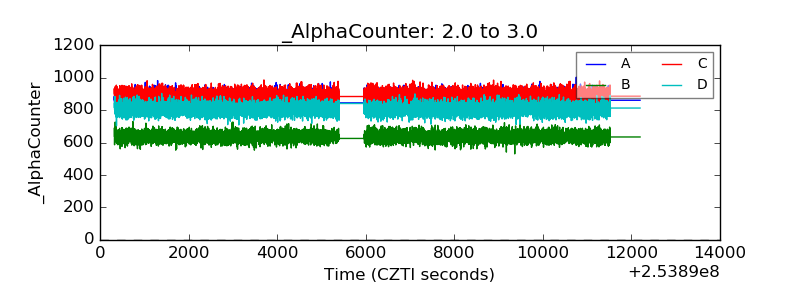 |
| _CPM_Rate | 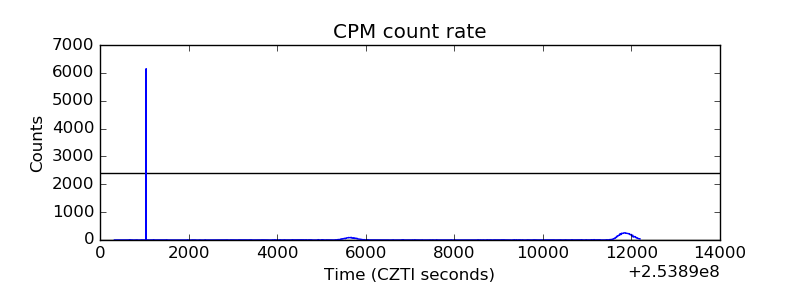 |
| CZT Counter | 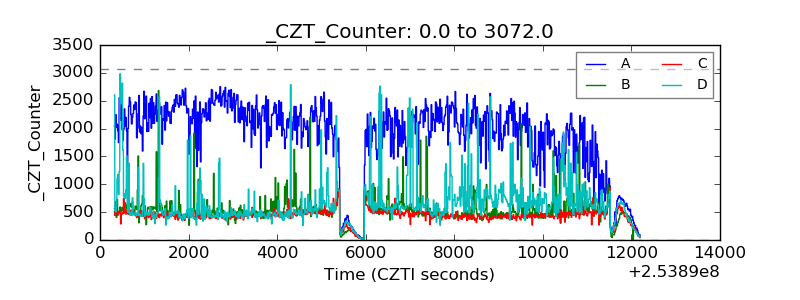 |
| +2.5 Volts monitor | 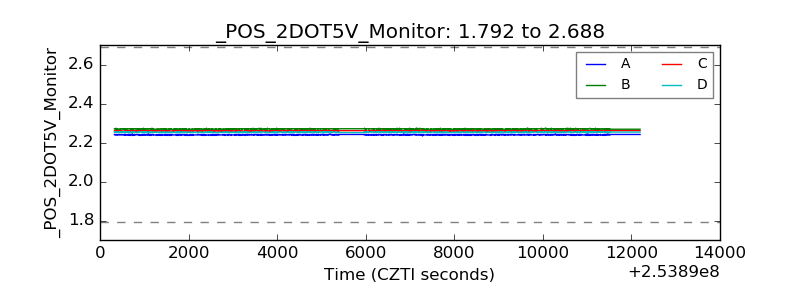 |
| +5 Volts monitor | 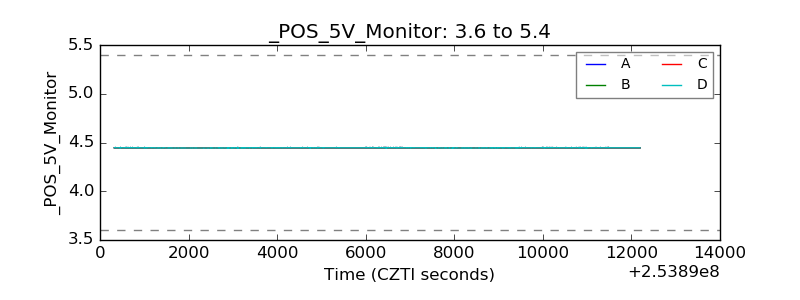 |
| _ROLL_ROT | 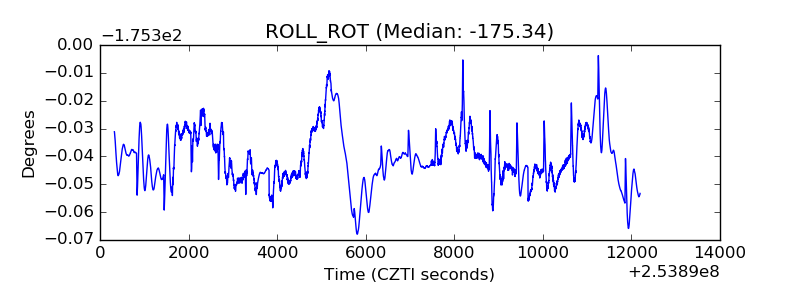 |
| _Roll_DEC | 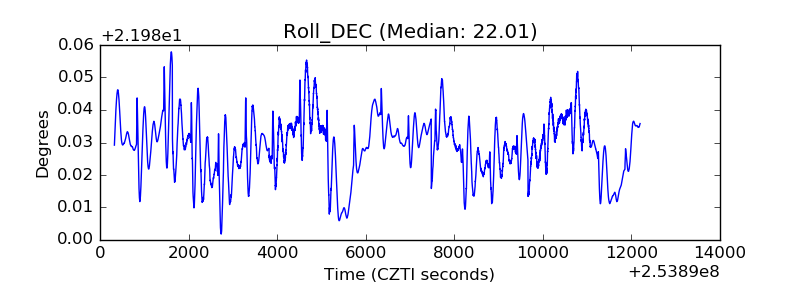 |
| _Roll_RA | 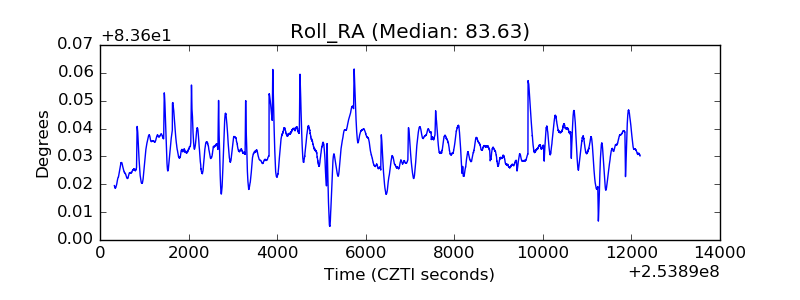 |
| Veto Counter | 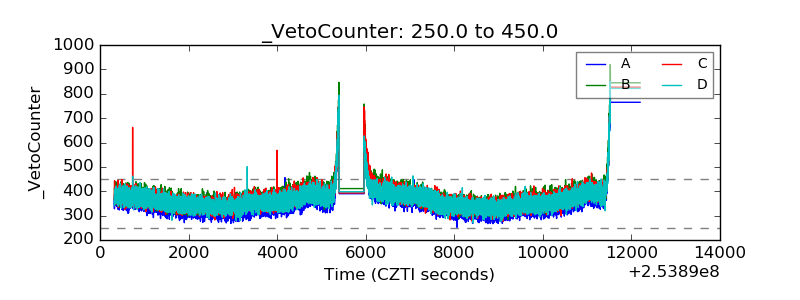 |