| Param | Original file | Final file |
|---|---|---|
| Filename | modeM0/AS1A04_174T01_9000001850_12471cztM0_level2.evt | modeM0/AS1A04_174T01_9000001850_12471cztM0_level2_quad_clean.evt |
| Size (bytes) | 834,681,600 | 101,583,360 |
| Size | 796.0 MB | 96.9 MB |
| Events in quadrant A | 13,094,655 | 549,067 |
| Events in quadrant B | 4,017,597 | 696,562 |
| Events in quadrant C | 3,245,017 | 694,499 |
| Events in quadrant D | 4,453,805 | 653,260 |
| Mode M0 | |||
|---|---|---|---|
| Quadrant | BADHDUFLAG | Total packets | Discarded packets |
| A | 0 | 43668 | 3 |
| B | 0 | 16395 | 2 |
| C | 0 | 14181 | 2 |
| D | 0 | 17875 | 2 |
| Mode M9 | |||
|---|---|---|---|
| Quadrant | BADHDUFLAG | Total packets | Discarded packets |
| A | 0 | 9 | 0 |
| B | 0 | 9 | 0 |
| C | 0 | 9 | 0 |
| D | 0 | 9 | 0 |
| Mode SS | |||
|---|---|---|---|
| Quadrant | BADHDUFLAG | Total packets | Discarded packets |
| A | 0 | 142 | 0 |
| B | 0 | 142 | 0 |
| C | 0 | 142 | 0 |
| D | 0 | 142 | 0 |
| Quadrant | Total seconds | Saturated seconds | Saturation percentage |
|---|---|---|---|
| A | 6906 | 4405 | 63.785114% |
| B | 6906 | 202 | 2.924993% |
| C | 6906 | 24 | 0.347524% |
| D | 6907 | 103 | 1.491241% |
Noise dominated data is calculated using 1-second bins in cleaned event files. If a bin has >2000 counts, and if more than 50% of those come from <1% of pixels, then it is considered to be noise-dominated and hence unusable.
| Quadrant | # 1 sec bins | Bins with >0 counts | Bins with >2000 counts | High rate bins dominated by noise | Noise dominated (total time) | Noise dominated (detector-on time) | Marked lightcurve |
|---|---|---|---|---|---|---|---|
| A | 7842 | 6907 | 3004 | 3004 | 38.31% | 43.49% | 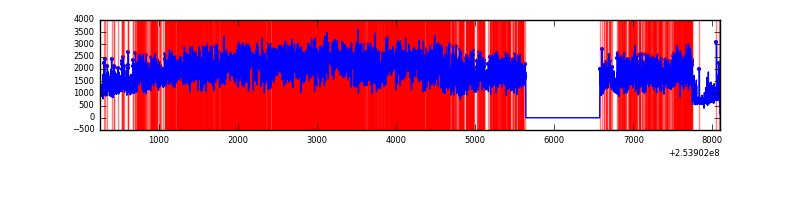 |
| B | 7842 | 6908 | 89 | 89 | 1.13% | 1.29% |  |
| C | 7842 | 6908 | 1 | 1 | 0.01% | 0.01% |  |
| D | 7843 | 6909 | 42 | 42 | 0.54% | 0.61% |  |
Top three noisy pixels from each quadrant. If the there are fewer than three noisy pixels in the level2.evt file, extra rows are filled as -1
| Pixel properties | Quadrant properties | ||||||
|---|---|---|---|---|---|---|---|
| Quadrant | DetID | PixID | Counts | Sigma | Mean | Median | Sigma |
| A | 13 | 251 | 8971784 | 61274.49 | 707 | 693 | 146.4 |
| A | 0 | 23 | 1094891 | 7473.61 | 707 | 693 | 146.4 |
| A | 15 | 239 | 85726 | 580.79 | 707 | 693 | 146.4 |
| B | 4 | 239 | 499076 | 3087.45 | 846 | 828 | 161.4 |
| B | 11 | 51 | 39175 | 237.62 | 846 | 828 | 161.4 |
| B | 3 | 209 | 36842 | 223.16 | 846 | 828 | 161.4 |
| C | 13 | 61 | 5999 | 26.96 | 828 | 836 | 191.5 |
| C | 8 | 128 | 5682 | 25.3 | 828 | 836 | 191.5 |
| C | 14 | 234 | 5620 | 24.98 | 828 | 836 | 191.5 |
| D | 1 | 52 | 1097175 | 5490.45 | 826 | 805 | 199.7 |
| D | 7 | 71 | 77332 | 383.24 | 826 | 805 | 199.7 |
| D | 13 | 104 | 66725 | 330.12 | 826 | 805 | 199.7 |
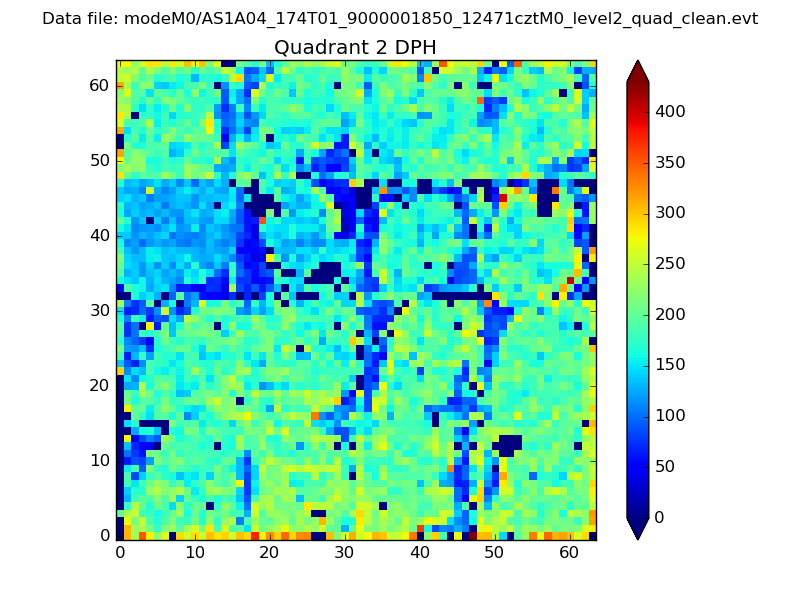
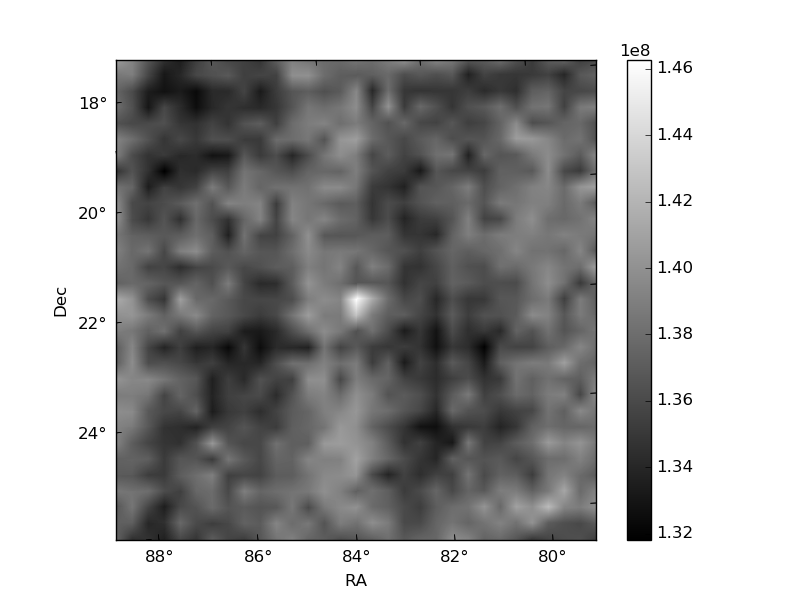
Histogram calculated using DETX and DETY for each event in the final _common_clean file
| Quadrant A | 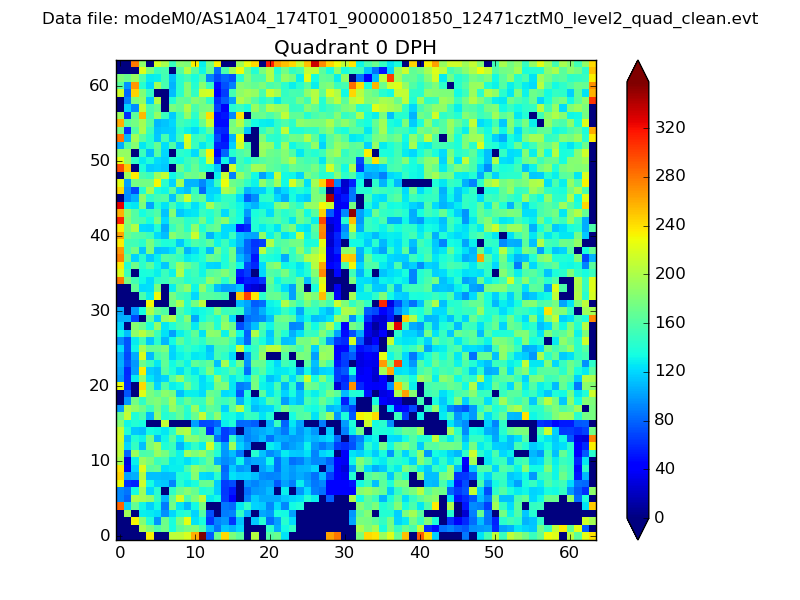 |
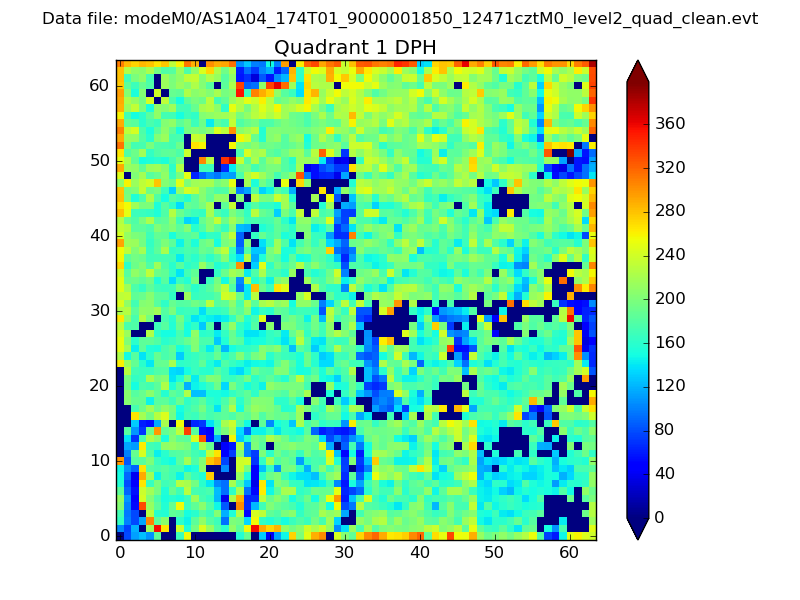 |
Quadrant B |
|---|---|---|---|
| Quadrant D | 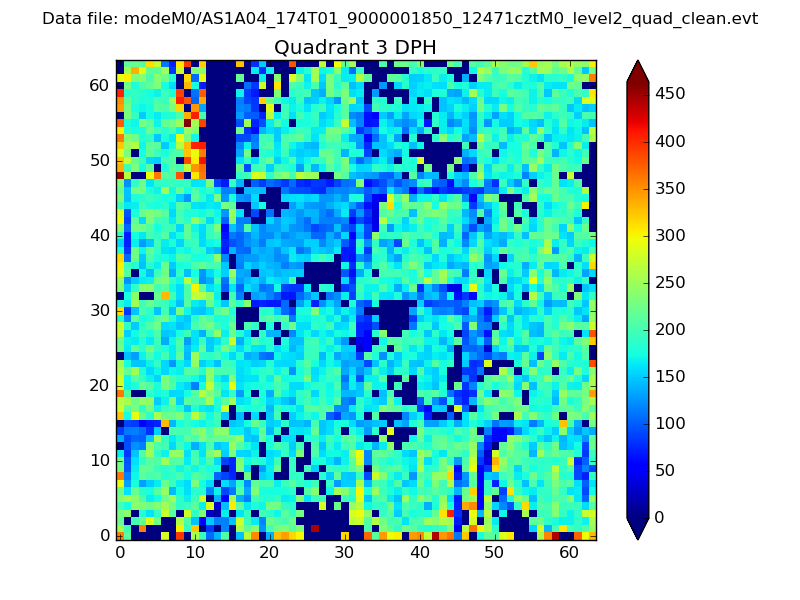 |
 |
Quadrant C |
| Plot type | Count rate plots | Images |
|---|---|---|
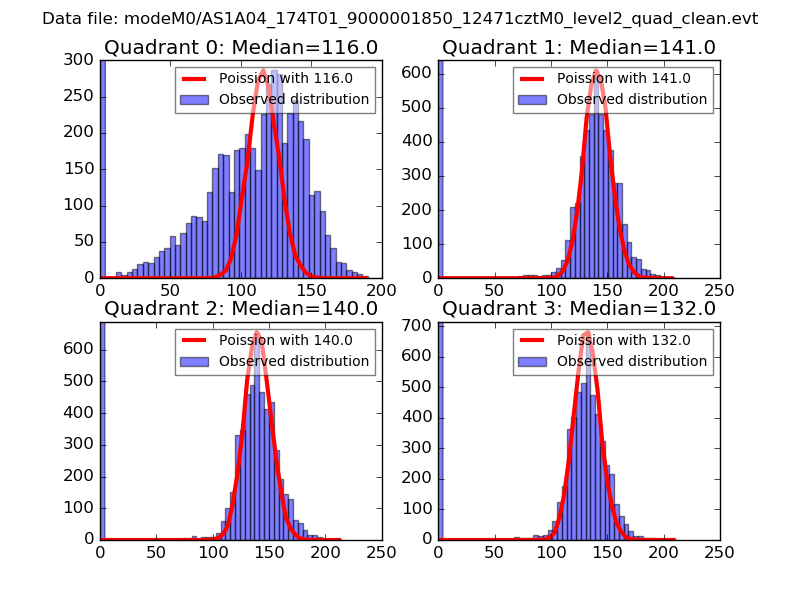
| Comparison with Poisson distribution Blue bars denote a histogram of data divided into 1 sec bins. Red curve is a Poisson curve with rate = median count rate of data. |
 |
 |
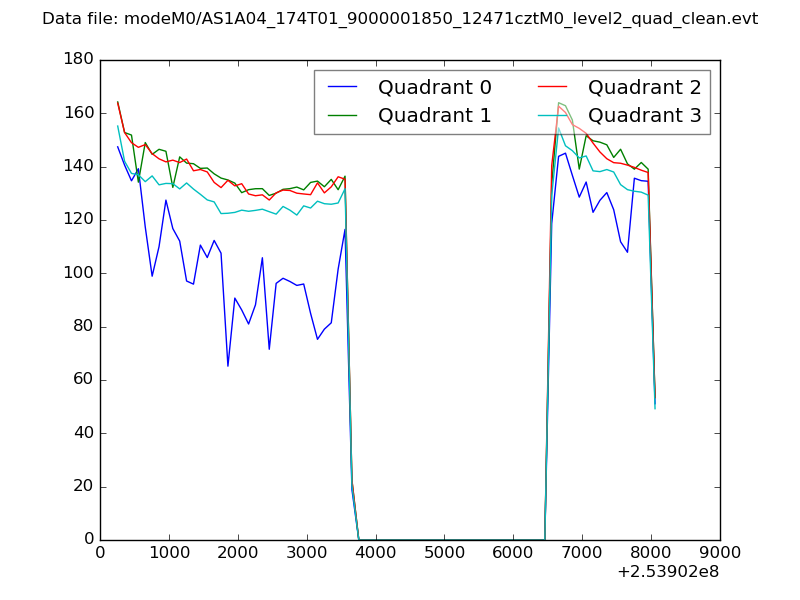
| Quadrant-wise count rates Data is divided into 100 sec bins |
 |
|
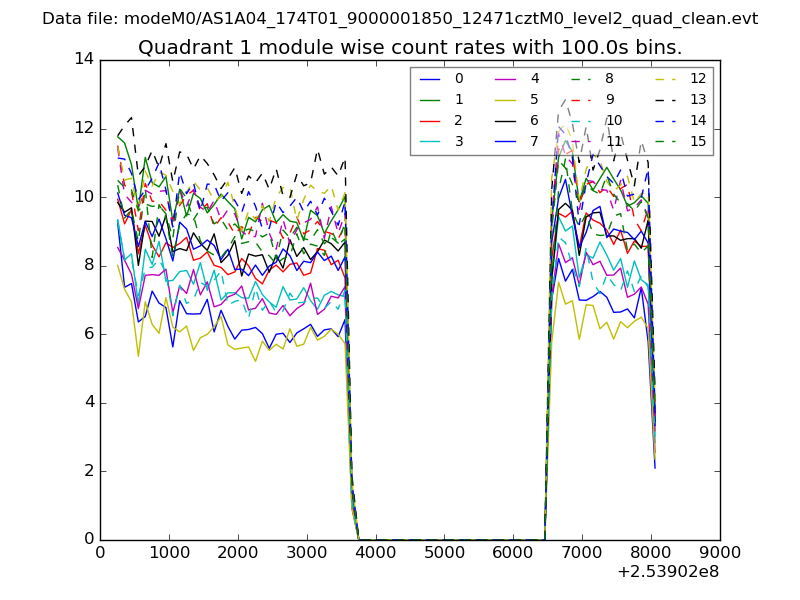
| Module-wise count rates for Quadrant A Data is divided into 100 sec bins |
 |
 |
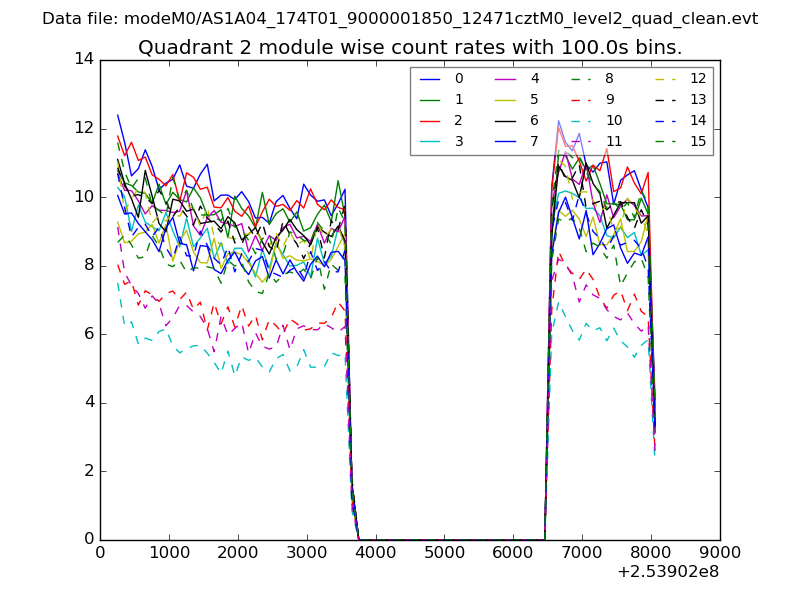
| Module-wise count rates for Quadrant B Data is divided into 100 sec bins |
 |
 |
| Module-wise count rates for Quadrant C Data is divided into 100 sec bins |
 |
 |
| Module-wise count rates for Quadrant D Data is divided into 100 sec bins |
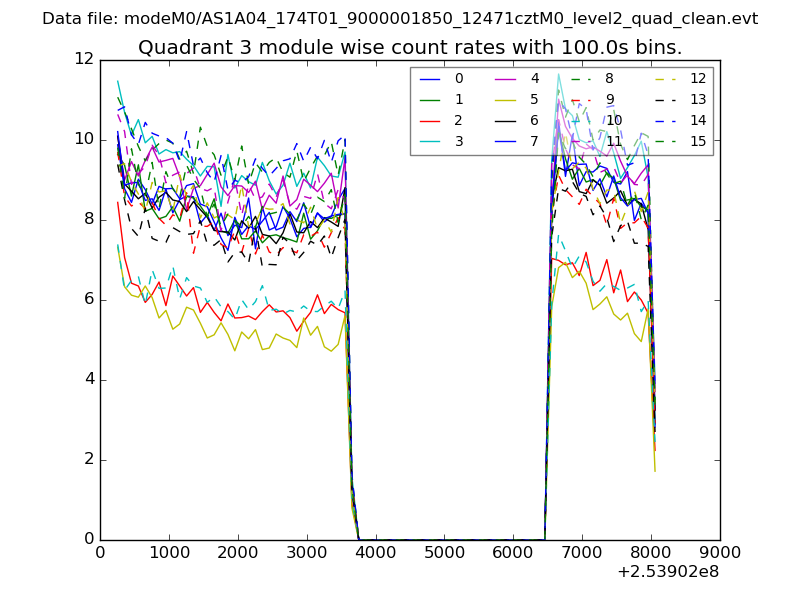 |
 |
| Parameter | Plot |
|---|---|
| CZT HV Monitor | 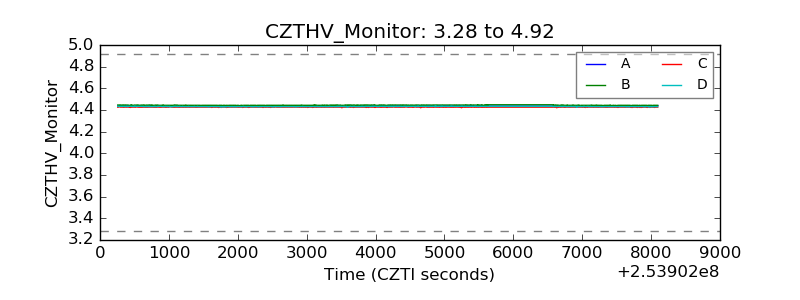 |
| D_VDD | 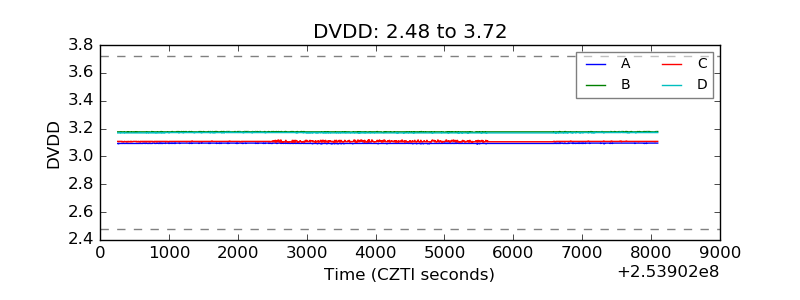 |
| Temperature 1 |  |
| Veto HV Monitor | 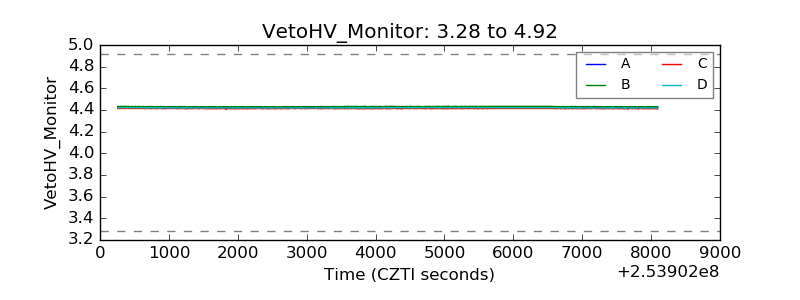 |
| Veto LLD | 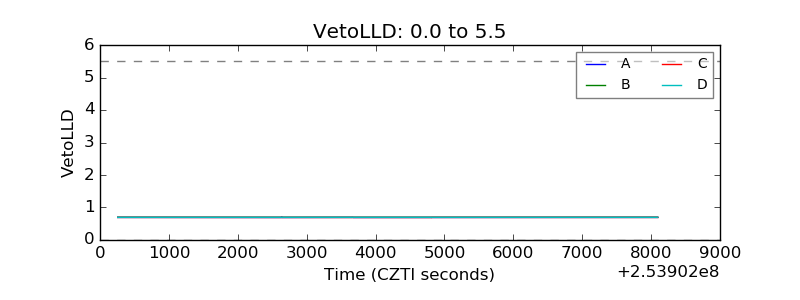 |
| Alpha Counter | 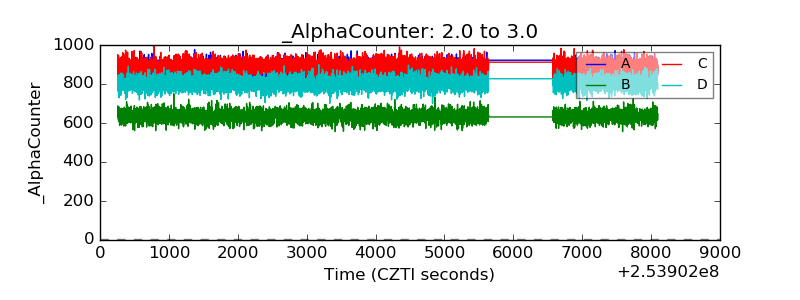 |
| _CPM_Rate | 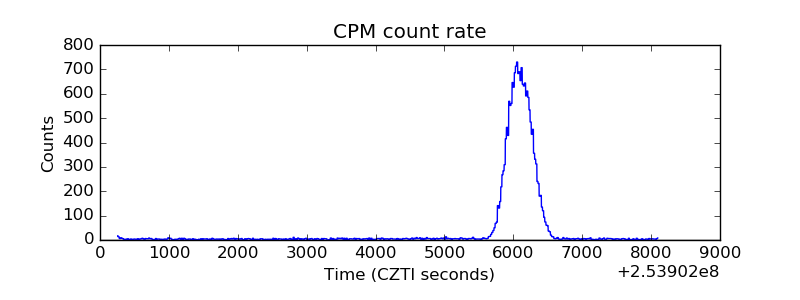 |
| CZT Counter | 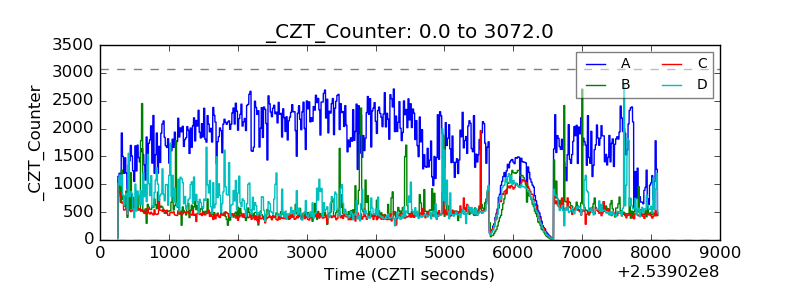 |
| +2.5 Volts monitor |  |
| +5 Volts monitor |  |
| _ROLL_ROT | 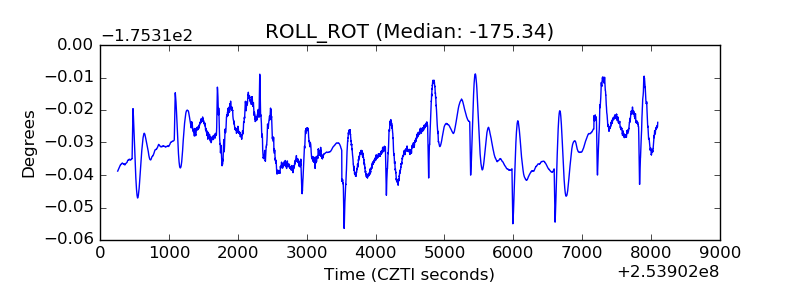 |
| _Roll_DEC | 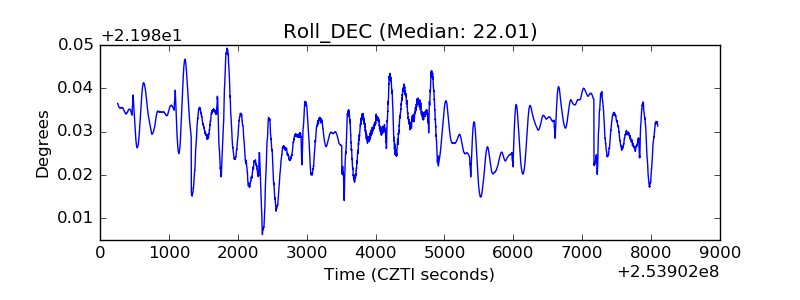 |
| _Roll_RA | 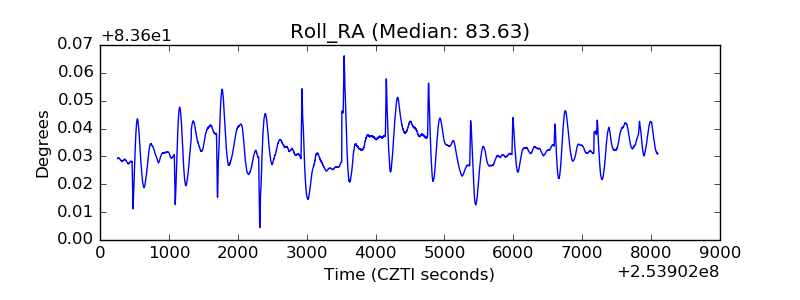 |
| Veto Counter | 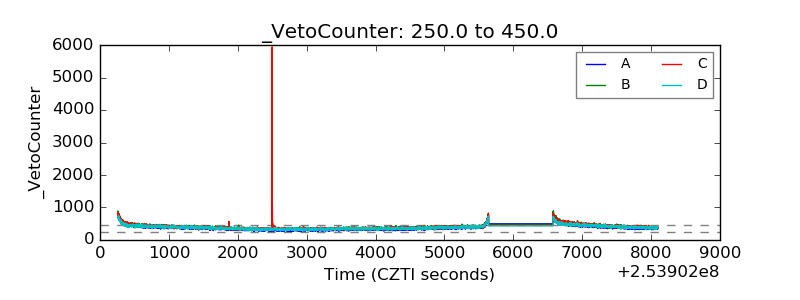 |