| Param | Original file | Final file |
|---|---|---|
| Filename | modeM0/AS1A04_174T01_9000001850_12472cztM0_level2.evt | modeM0/AS1A04_174T01_9000001850_12472cztM0_level2_quad_clean.evt |
| Size (bytes) | 679,668,480 | 87,891,840 |
| Size | 648.2 MB | 83.8 MB |
| Events in quadrant A | 8,884,946 | 511,710 |
| Events in quadrant B | 3,504,313 | 592,178 |
| Events in quadrant C | 2,902,246 | 585,260 |
| Events in quadrant D | 4,869,245 | 534,591 |
| Mode M0 | |||
|---|---|---|---|
| Quadrant | BADHDUFLAG | Total packets | Discarded packets |
| A | 0 | 30853 | 2 |
| B | 0 | 14345 | 1 |
| C | 0 | 12817 | 1 |
| D | 0 | 18627 | 1 |
| Mode M9 | |||
|---|---|---|---|
| Quadrant | BADHDUFLAG | Total packets | Discarded packets |
| A | 0 | 10 | 0 |
| B | 0 | 10 | 0 |
| C | 0 | 10 | 0 |
| D | 0 | 10 | 0 |
| Mode SS | |||
|---|---|---|---|
| Quadrant | BADHDUFLAG | Total packets | Discarded packets |
| A | 0 | 130 | 0 |
| B | 0 | 130 | 0 |
| C | 0 | 130 | 0 |
| D | 0 | 130 | 0 |
| Quadrant | Total seconds | Saturated seconds | Saturation percentage |
|---|---|---|---|
| A | 6252 | 1683 | 26.919386% |
| B | 6252 | 123 | 1.967370% |
| C | 6252 | 37 | 0.591811% |
| D | 6252 | 345 | 5.518234% |
Noise dominated data is calculated using 1-second bins in cleaned event files. If a bin has >2000 counts, and if more than 50% of those come from <1% of pixels, then it is considered to be noise-dominated and hence unusable.
| Quadrant | # 1 sec bins | Bins with >0 counts | Bins with >2000 counts | High rate bins dominated by noise | Noise dominated (total time) | Noise dominated (detector-on time) | Marked lightcurve |
|---|---|---|---|---|---|---|---|
| A | 7327 | 6252 | 1083 | 1083 | 14.78% | 17.32% | 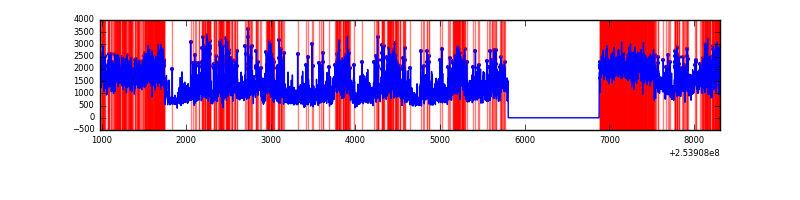 |
| B | 7328 | 6253 | 50 | 50 | 0.68% | 0.80% | 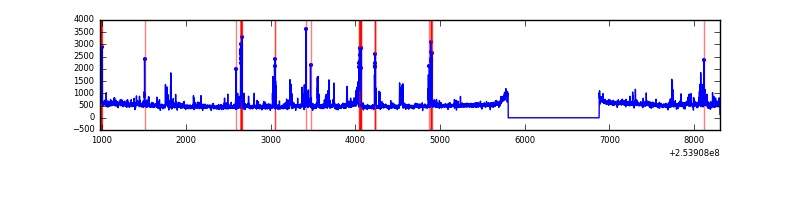 |
| C | 7328 | 6253 | 0 | 0 | 0.00% | 0.00% | 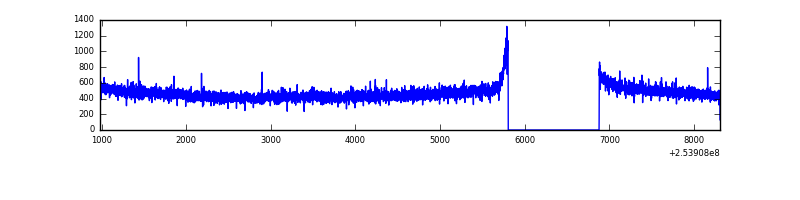 |
| D | 7328 | 6253 | 248 | 248 | 3.38% | 3.97% | 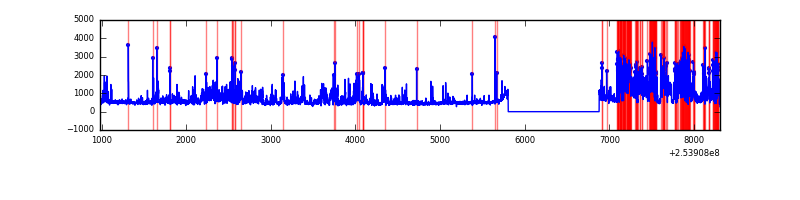 |
Top three noisy pixels from each quadrant. If the there are fewer than three noisy pixels in the level2.evt file, extra rows are filled as -1
| Pixel properties | Quadrant properties | ||||||
|---|---|---|---|---|---|---|---|
| Quadrant | DetID | PixID | Counts | Sigma | Mean | Median | Sigma |
| A | 13 | 251 | 4833965 | 33417.69 | 706 | 693 | 144.6 |
| A | 0 | 23 | 1004655 | 6941.49 | 706 | 693 | 144.6 |
| A | 12 | 189 | 103205 | 708.78 | 706 | 693 | 144.6 |
| B | 4 | 239 | 266019 | 1838.85 | 762 | 746 | 144.3 |
| B | 3 | 64 | 118360 | 815.29 | 762 | 746 | 144.3 |
| B | 11 | 51 | 39985 | 272.0 | 762 | 746 | 144.3 |
| C | 13 | 61 | 5546 | 27.86 | 744 | 751 | 172.1 |
| C | 14 | 67 | 2414 | 9.66 | 744 | 751 | 172.1 |
| C | 8 | 222 | 1813 | 6.17 | 744 | 751 | 172.1 |
| D | 1 | 52 | 1969638 | 11221.63 | 726 | 708 | 175.5 |
| D | 7 | 71 | 73507 | 414.91 | 726 | 708 | 175.5 |
| D | 2 | 234 | 27080 | 150.3 | 726 | 708 | 175.5 |
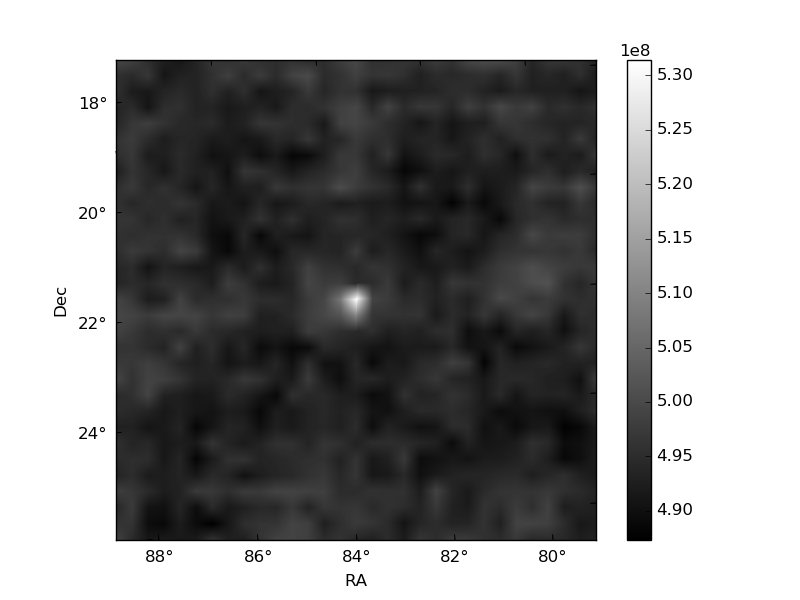
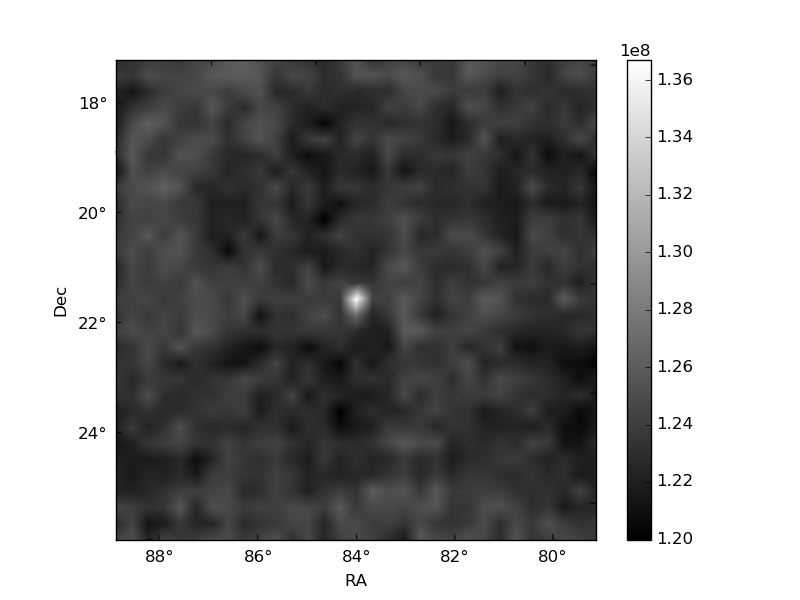
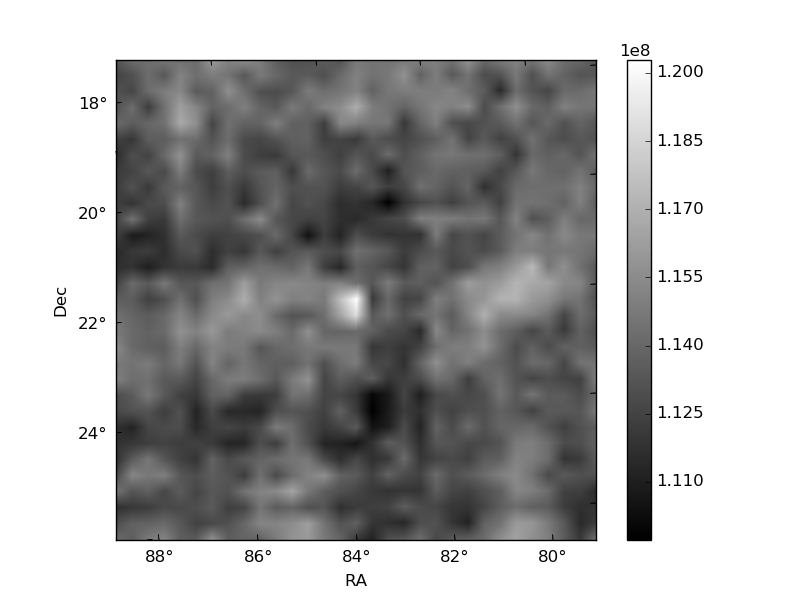
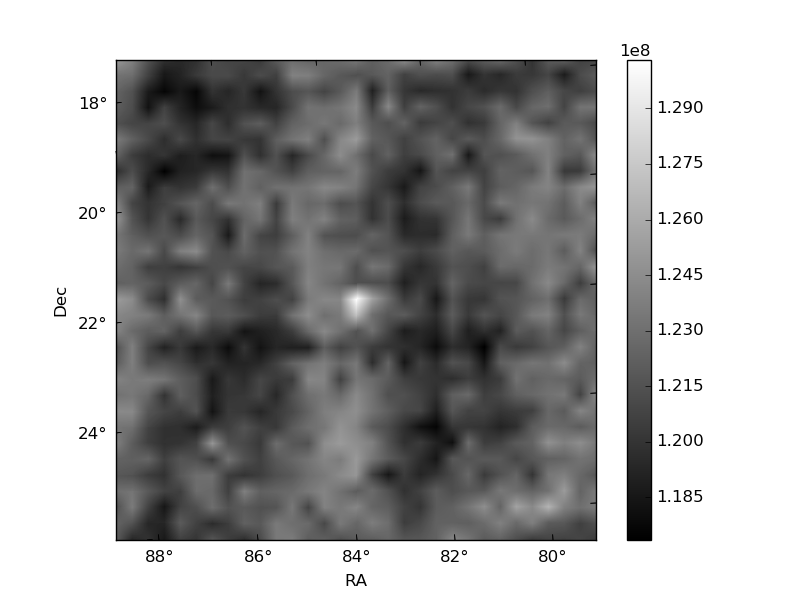
Histogram calculated using DETX and DETY for each event in the final _common_clean file
| Quadrant A | 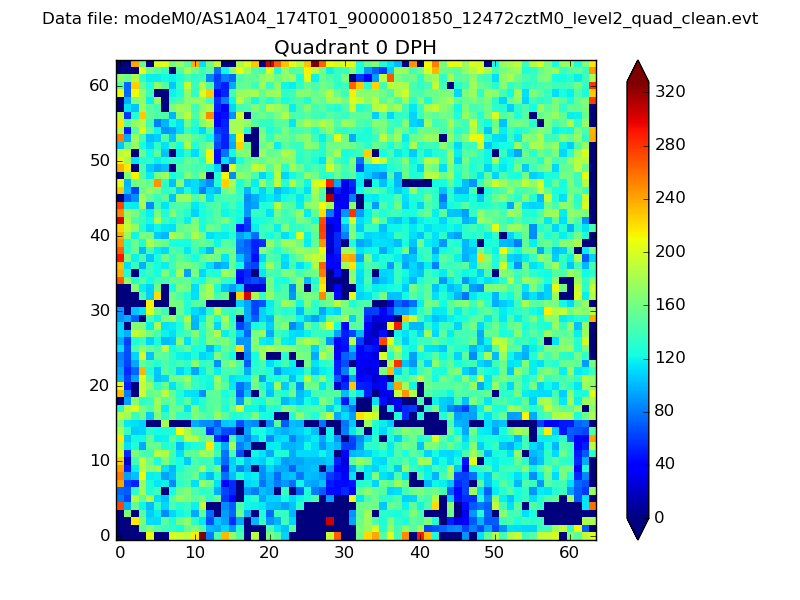 |
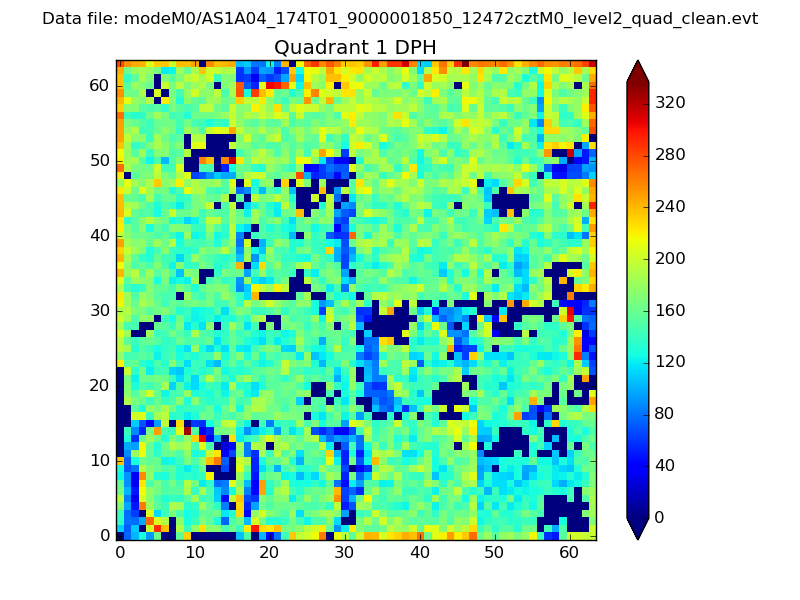 |
Quadrant B |
|---|---|---|---|
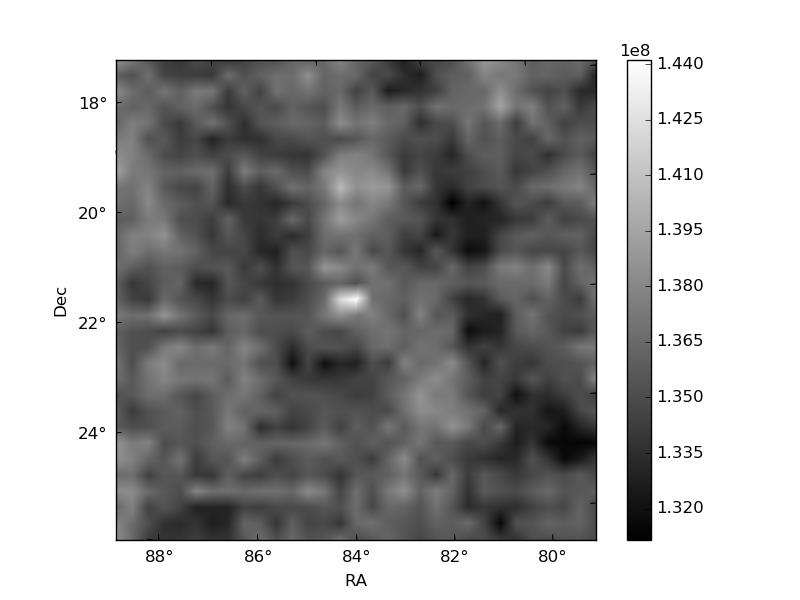
| Quadrant D | 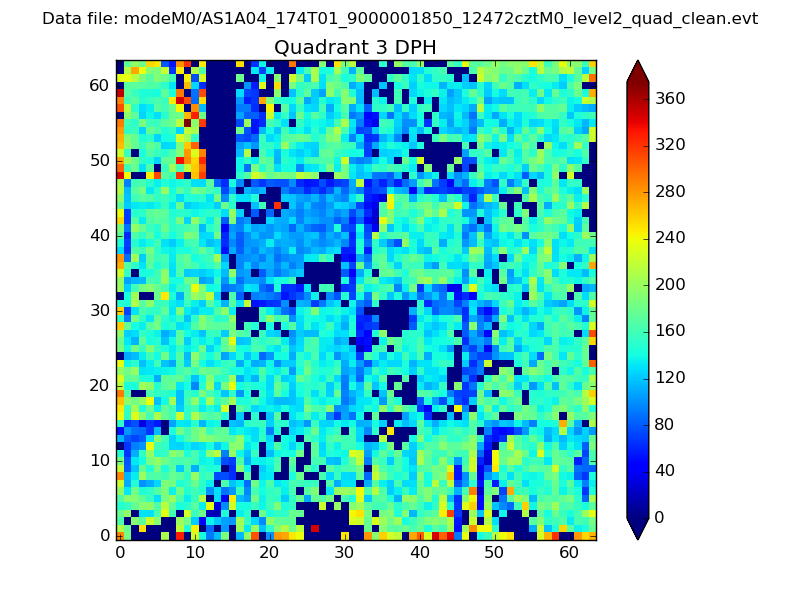 |
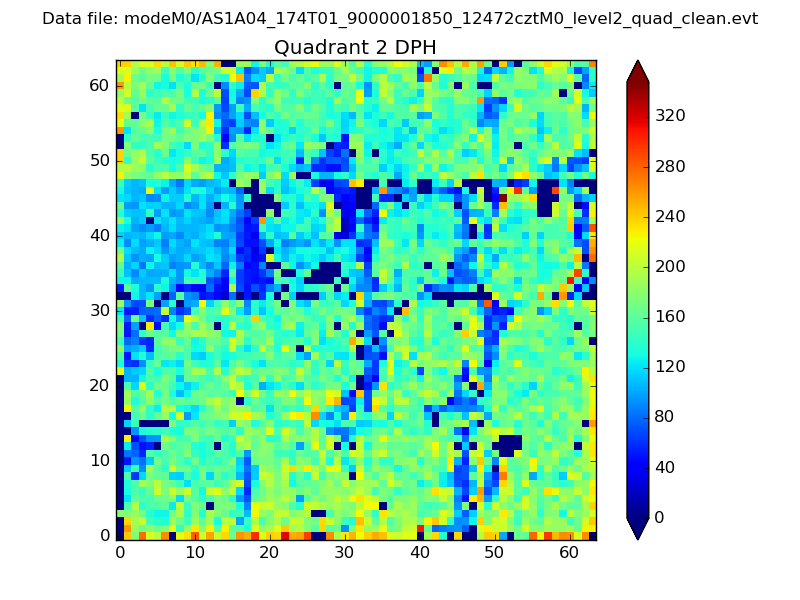 |
Quadrant C |
| Plot type | Count rate plots | Images |
|---|---|---|
| Comparison with Poisson distribution Blue bars denote a histogram of data divided into 1 sec bins. Red curve is a Poisson curve with rate = median count rate of data. |
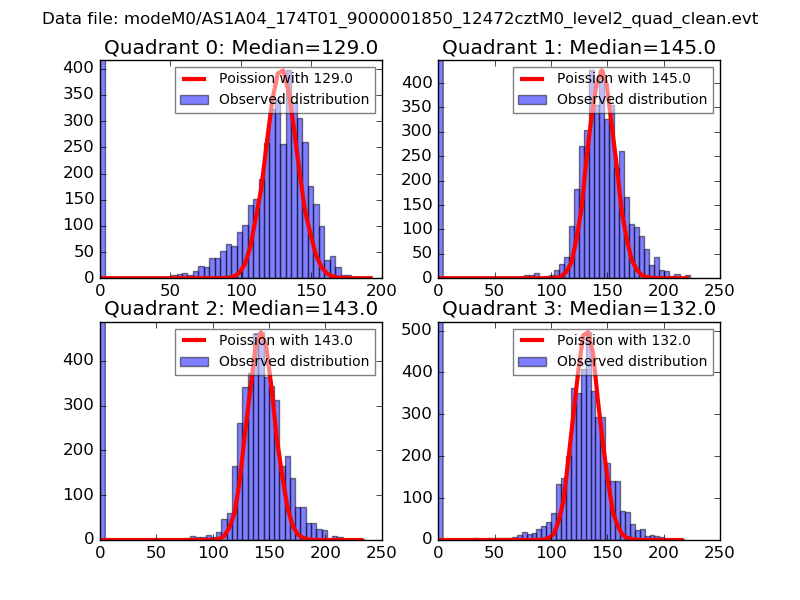 |
 |
| Quadrant-wise count rates Data is divided into 100 sec bins |
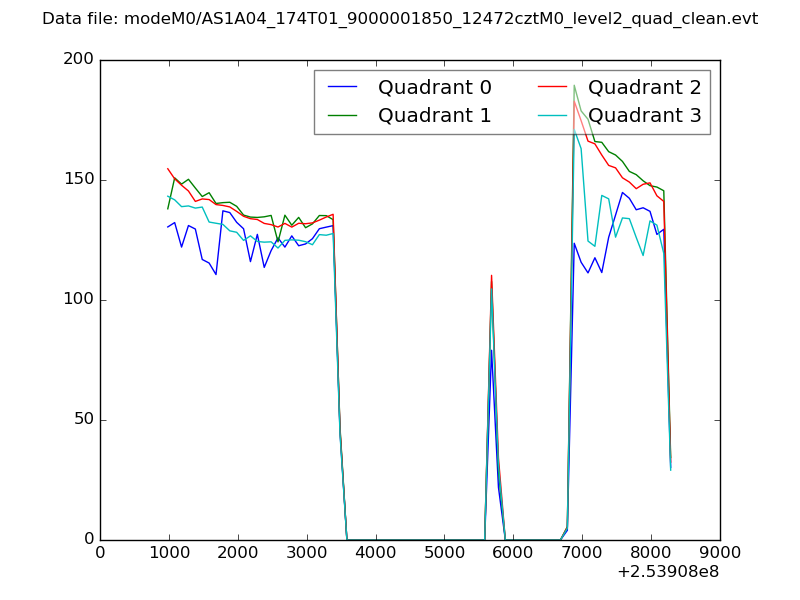 |
|
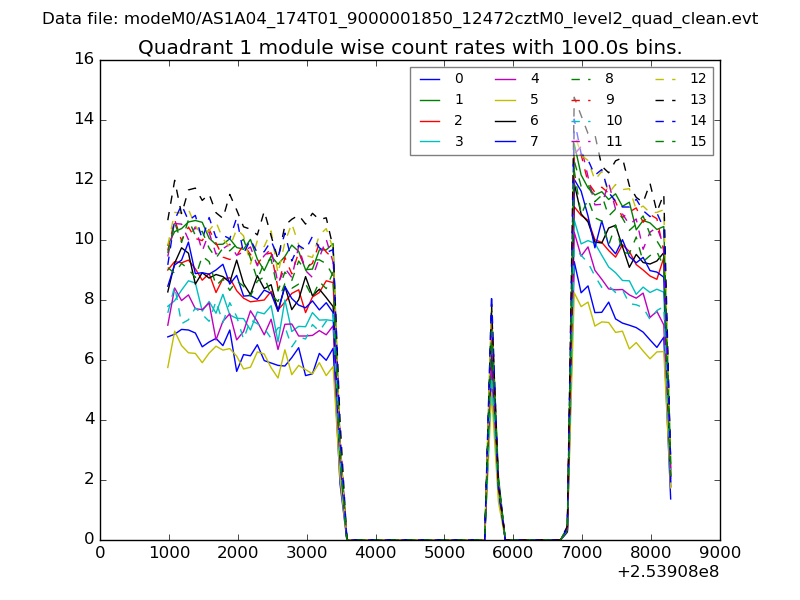
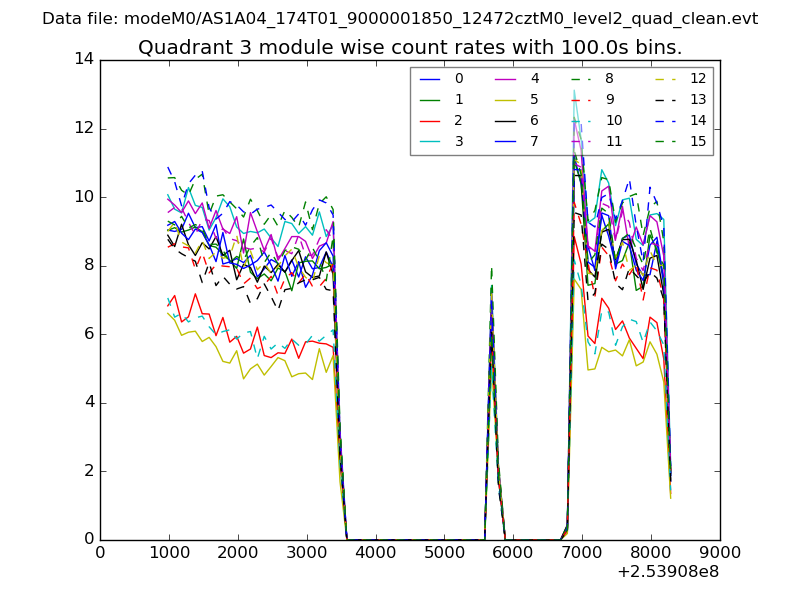
| Module-wise count rates for Quadrant A Data is divided into 100 sec bins |
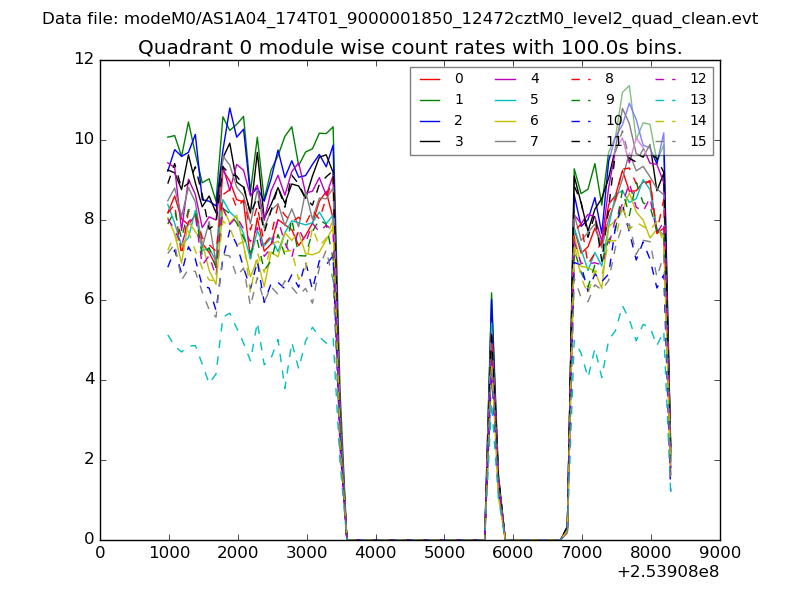 |
 |
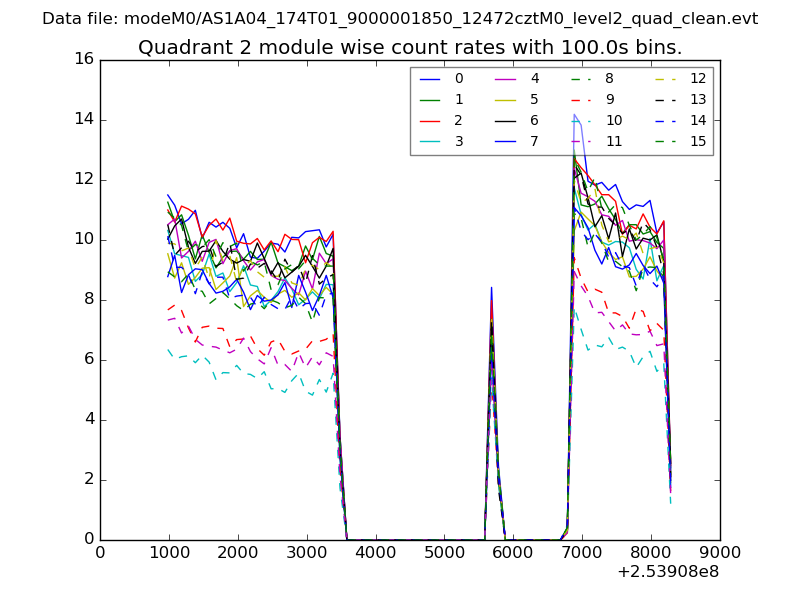
| Module-wise count rates for Quadrant B Data is divided into 100 sec bins |
 |
 |
| Module-wise count rates for Quadrant C Data is divided into 100 sec bins |
 |
 |
| Module-wise count rates for Quadrant D Data is divided into 100 sec bins |
 |
 |
| Parameter | Plot |
|---|---|
| CZT HV Monitor | 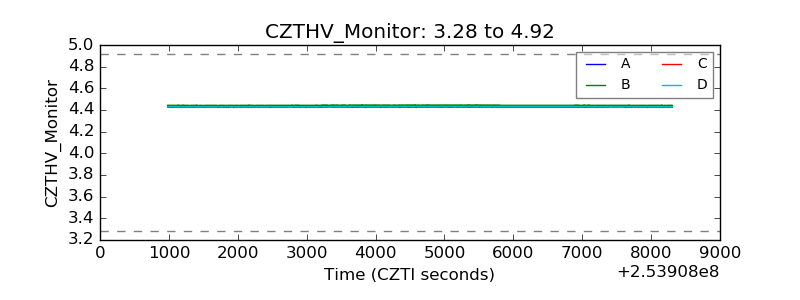 |
| D_VDD | 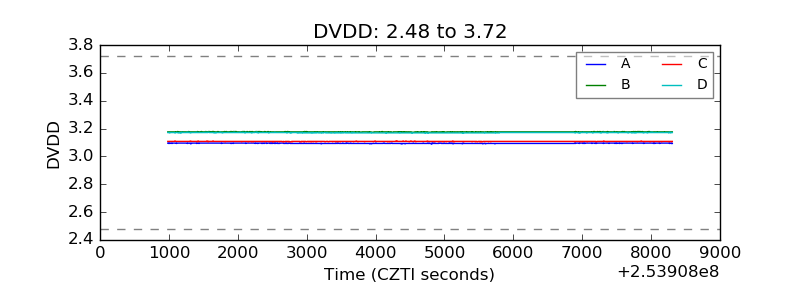 |
| Temperature 1 | 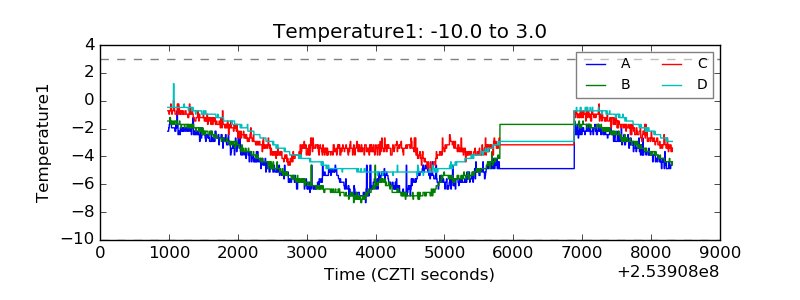 |
| Veto HV Monitor | 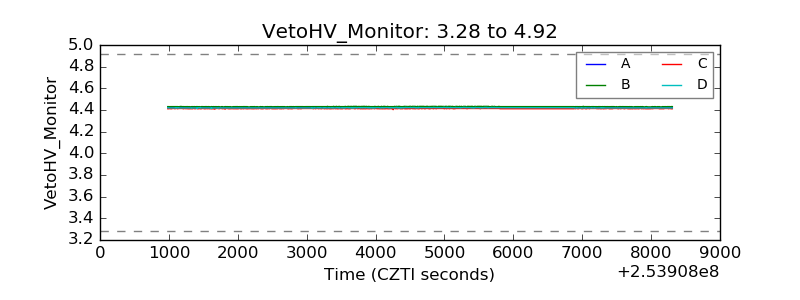 |
| Veto LLD | 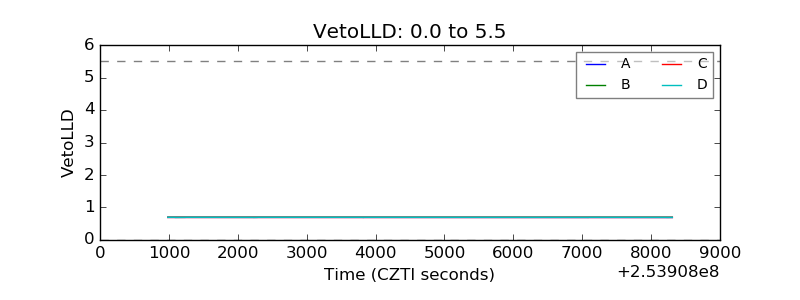 |
| Alpha Counter | 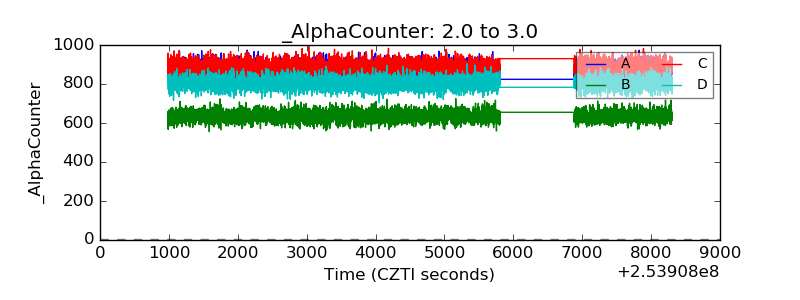 |
| _CPM_Rate | 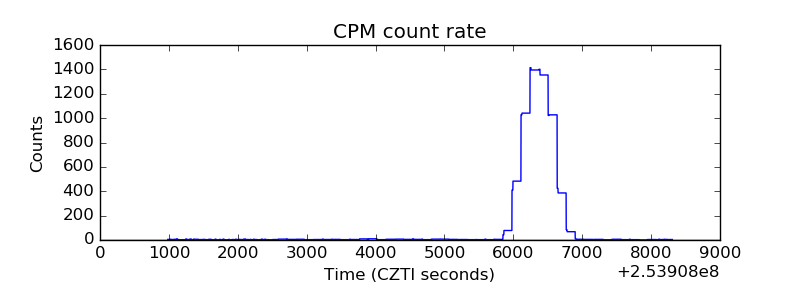 |
| CZT Counter | 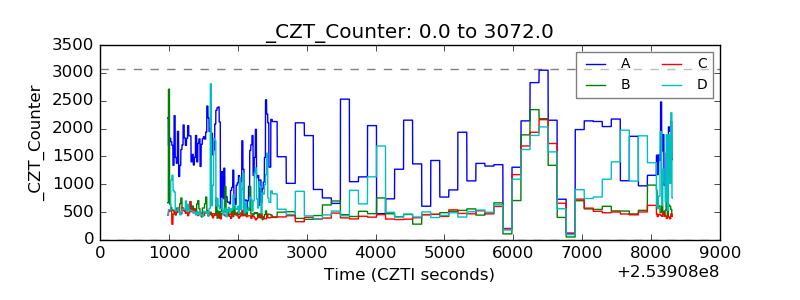 |
| +2.5 Volts monitor | 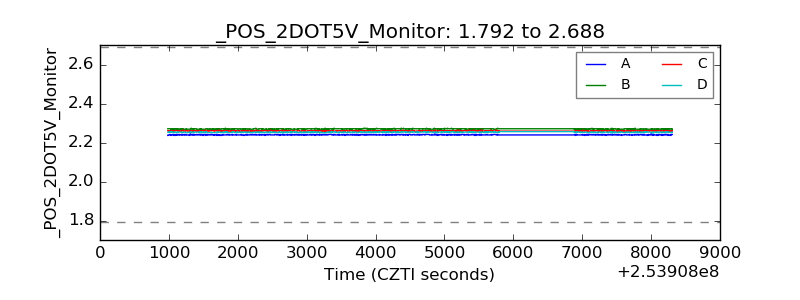 |
| +5 Volts monitor |  |
| _ROLL_ROT | 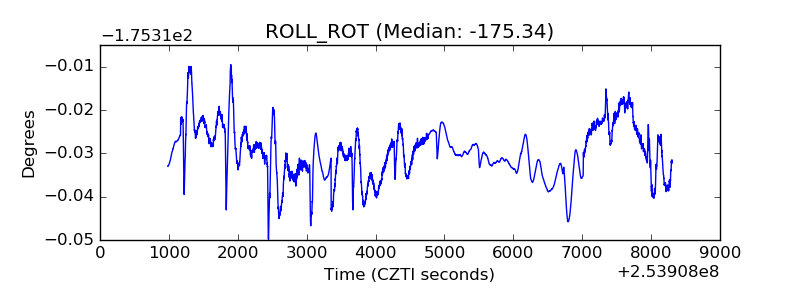 |
| _Roll_DEC | 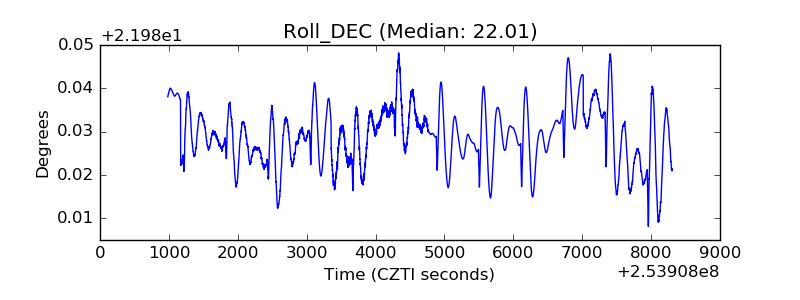 |
| _Roll_RA | 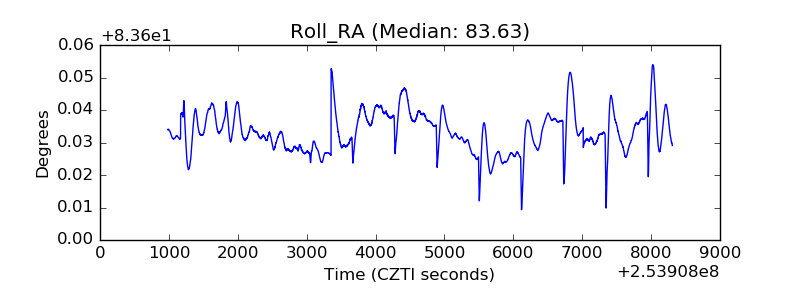 |
| Veto Counter | 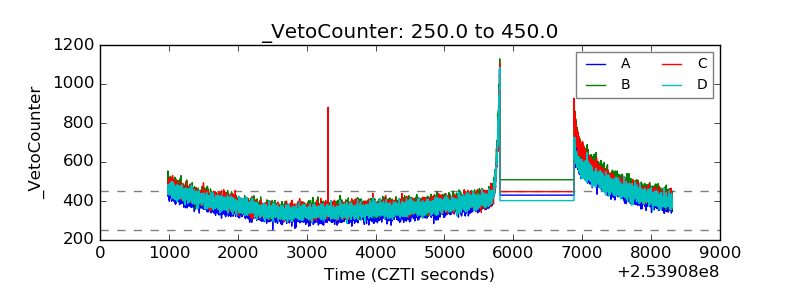 |