| Param | Original file | Final file |
|---|---|---|
| Filename | modeM0/AS1A04_174T01_9000001850_12474cztM0_level2.evt | modeM0/AS1A04_174T01_9000001850_12474cztM0_level2_quad_clean.evt |
| Size (bytes) | 668,404,800 | 78,272,640 |
| Size | 637.4 MB | 74.6 MB |
| Events in quadrant A | 9,324,594 | 461,128 |
| Events in quadrant B | 3,402,317 | 526,286 |
| Events in quadrant C | 2,646,475 | 521,696 |
| Events in quadrant D | 4,488,980 | 466,632 |
| Mode M0 | |||
|---|---|---|---|
| Quadrant | BADHDUFLAG | Total packets | Discarded packets |
| A | 0 | 31595 | 2 |
| B | 0 | 13639 | 1 |
| C | 0 | 11562 | 1 |
| D | 0 | 17130 | 1 |
| Mode M9 | |||
|---|---|---|---|
| Quadrant | BADHDUFLAG | Total packets | Discarded packets |
| A | 0 | 12 | 0 |
| B | 0 | 12 | 0 |
| C | 0 | 12 | 0 |
| D | 0 | 12 | 0 |
| Mode SS | |||
|---|---|---|---|
| Quadrant | BADHDUFLAG | Total packets | Discarded packets |
| A | 0 | 114 | 0 |
| B | 0 | 114 | 0 |
| C | 0 | 114 | 0 |
| D | 0 | 114 | 0 |
| Quadrant | Total seconds | Saturated seconds | Saturation percentage |
|---|---|---|---|
| A | 5633 | 1880 | 33.374756% |
| B | 5633 | 210 | 3.728031% |
| C | 5633 | 21 | 0.372803% |
| D | 5633 | 414 | 7.349547% |
Noise dominated data is calculated using 1-second bins in cleaned event files. If a bin has >2000 counts, and if more than 50% of those come from <1% of pixels, then it is considered to be noise-dominated and hence unusable.
| Quadrant | # 1 sec bins | Bins with >0 counts | Bins with >2000 counts | High rate bins dominated by noise | Noise dominated (total time) | Noise dominated (detector-on time) | Marked lightcurve |
|---|---|---|---|---|---|---|---|
| A | 6834 | 5634 | 1385 | 1385 | 20.27% | 24.58% | 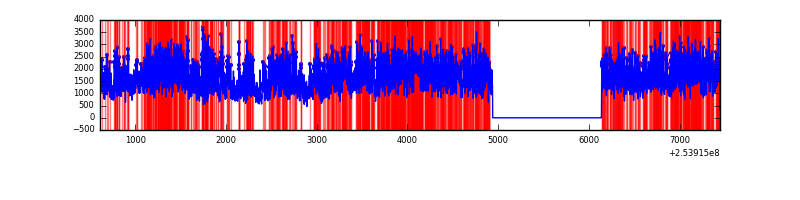 |
| B | 6834 | 5635 | 114 | 114 | 1.67% | 2.02% | 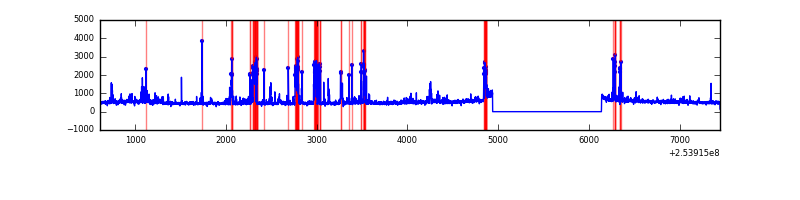 |
| C | 6834 | 5635 | 0 | 0 | 0.00% | 0.00% | 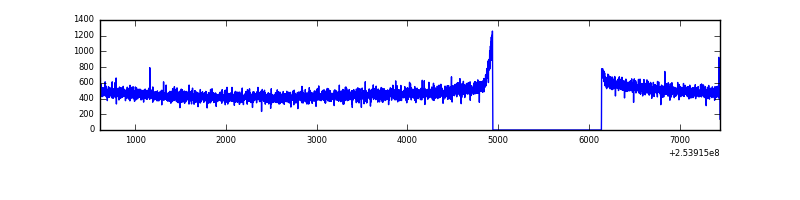 |
| D | 6834 | 5635 | 372 | 372 | 5.44% | 6.60% | 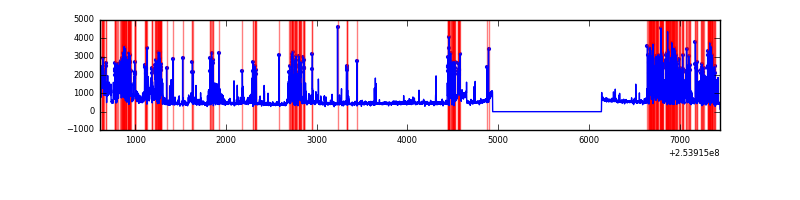 |
Top three noisy pixels from each quadrant. If the there are fewer than three noisy pixels in the level2.evt file, extra rows are filled as -1
| Pixel properties | Quadrant properties | ||||||
|---|---|---|---|---|---|---|---|
| Quadrant | DetID | PixID | Counts | Sigma | Mean | Median | Sigma |
| A | 13 | 251 | 6080205 | 47449.81 | 629 | 619 | 128.1 |
| A | 0 | 23 | 568218 | 4429.98 | 629 | 619 | 128.1 |
| A | 12 | 189 | 67294 | 520.38 | 629 | 619 | 128.1 |
| B | 4 | 239 | 456900 | 3515.98 | 689 | 675 | 129.8 |
| B | 3 | 64 | 169920 | 1304.32 | 689 | 675 | 129.8 |
| B | 0 | 214 | 15690 | 115.72 | 689 | 675 | 129.8 |
| C | 13 | 61 | 5041 | 27.78 | 678 | 682 | 156.9 |
| C | 3 | 233 | 3415 | 17.42 | 678 | 682 | 156.9 |
| C | 8 | 222 | 1987 | 8.32 | 678 | 682 | 156.9 |
| D | 1 | 52 | 1908059 | 12053.29 | 654 | 638 | 158.2 |
| D | 7 | 71 | 60686 | 379.45 | 654 | 638 | 158.2 |
| D | 2 | 234 | 21246 | 130.23 | 654 | 638 | 158.2 |
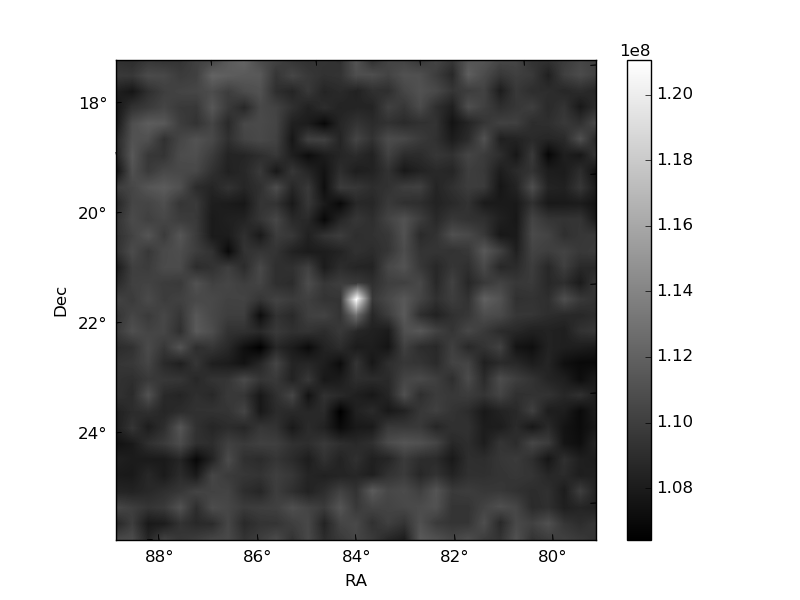
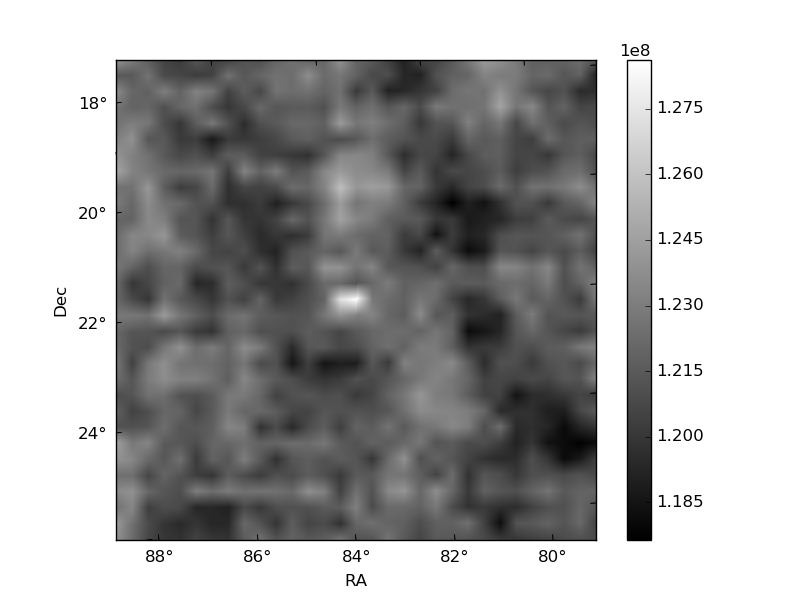
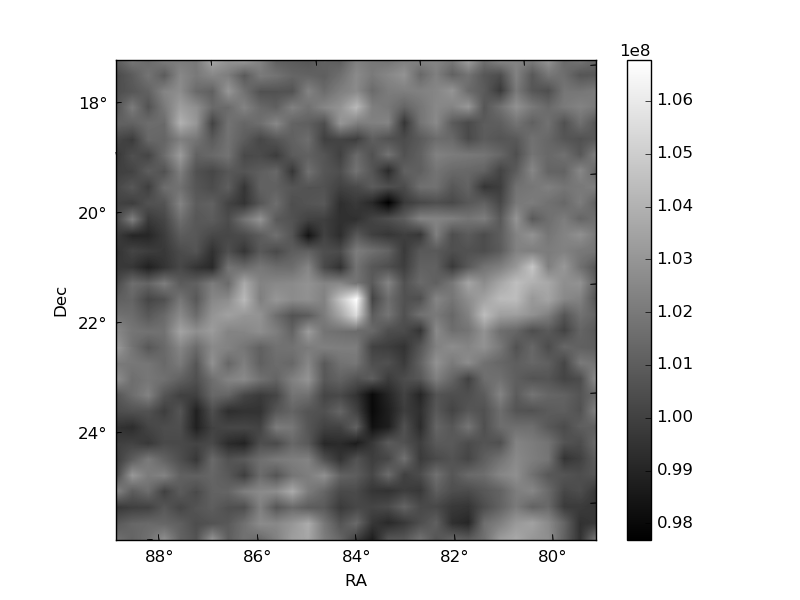
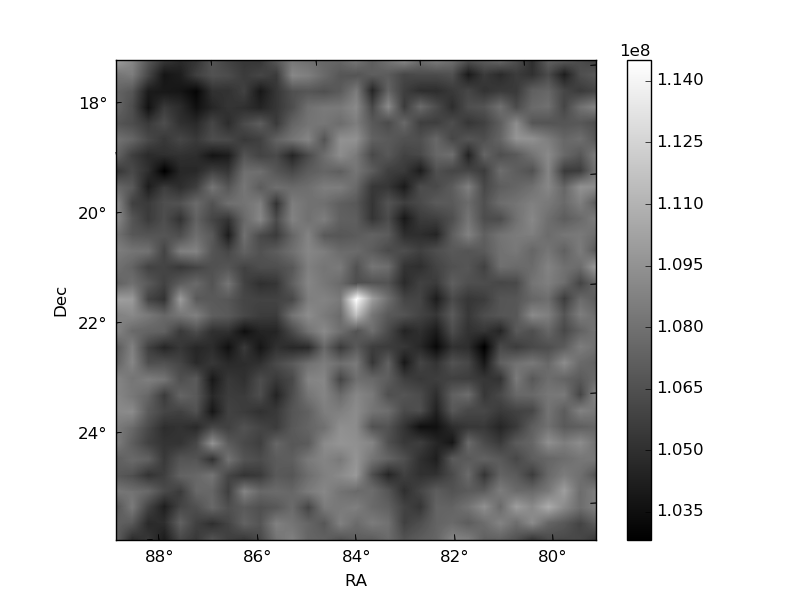
Histogram calculated using DETX and DETY for each event in the final _common_clean file
| Quadrant A | 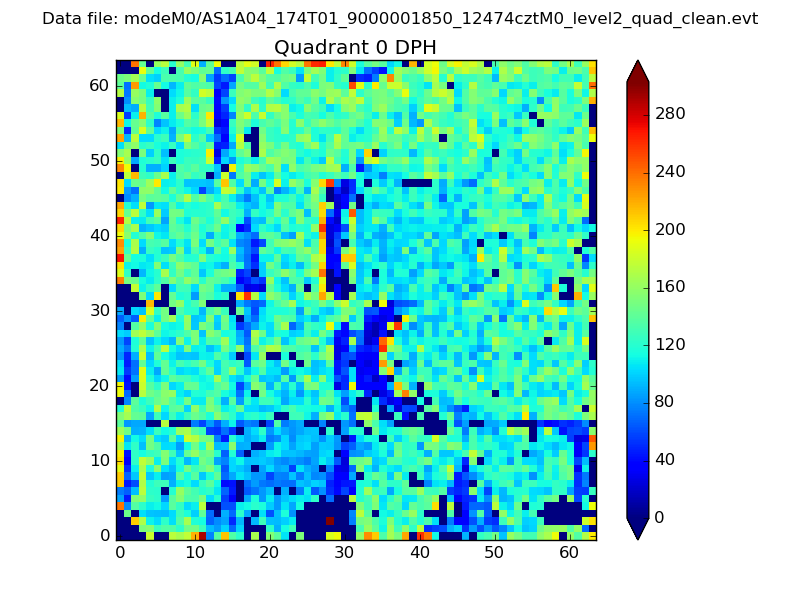 |
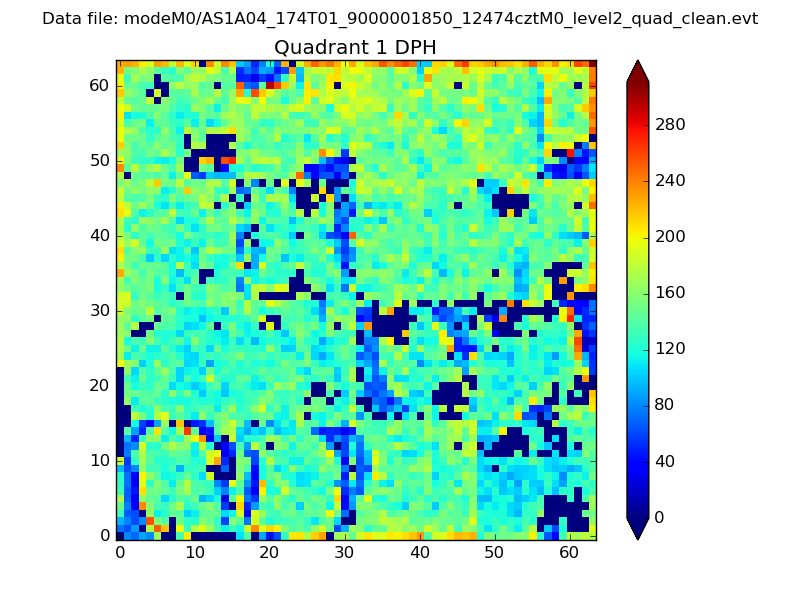 |
Quadrant B |
|---|---|---|---|
| Quadrant D | 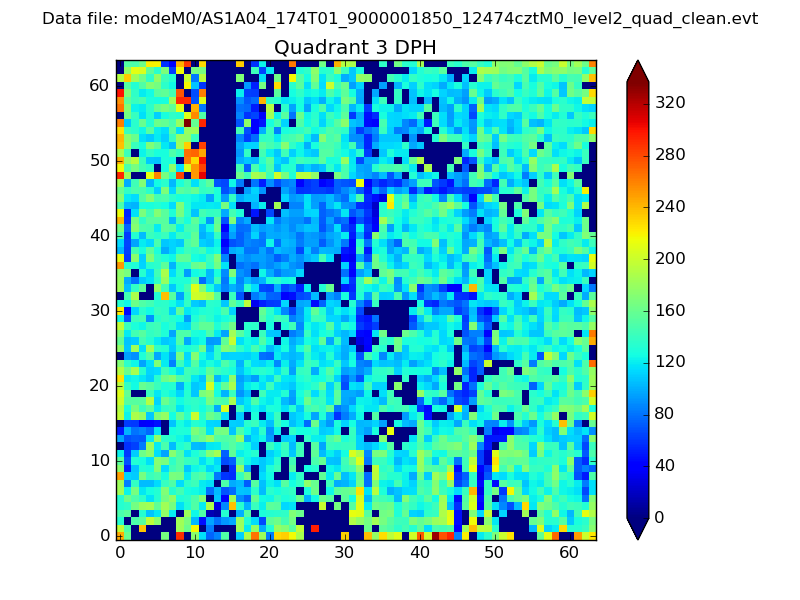 |
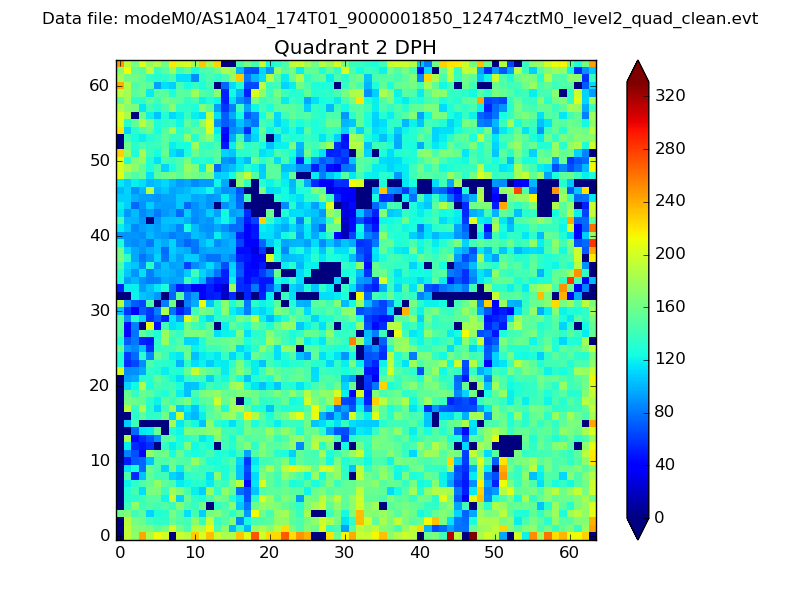 |
Quadrant C |
| Plot type | Count rate plots | Images |
|---|---|---|
| Comparison with Poisson distribution Blue bars denote a histogram of data divided into 1 sec bins. Red curve is a Poisson curve with rate = median count rate of data. |
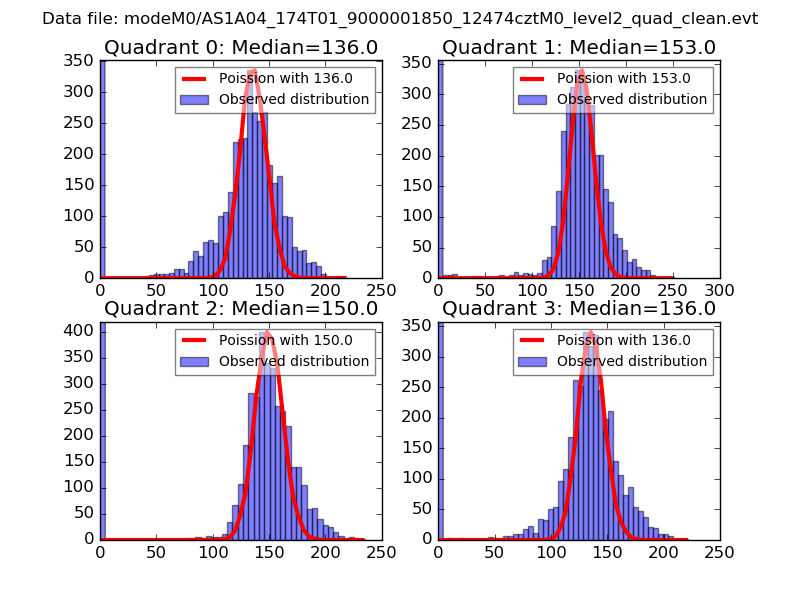 |
 |
| Quadrant-wise count rates Data is divided into 100 sec bins |
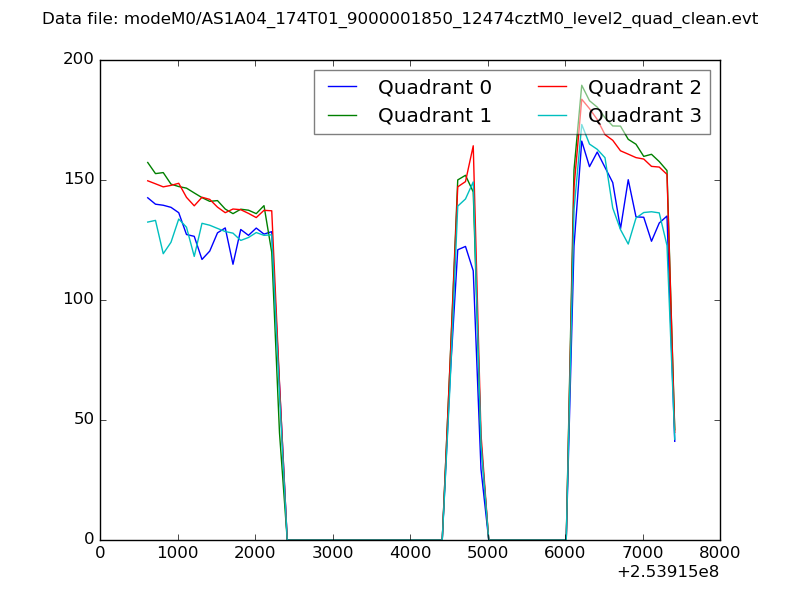 |
|
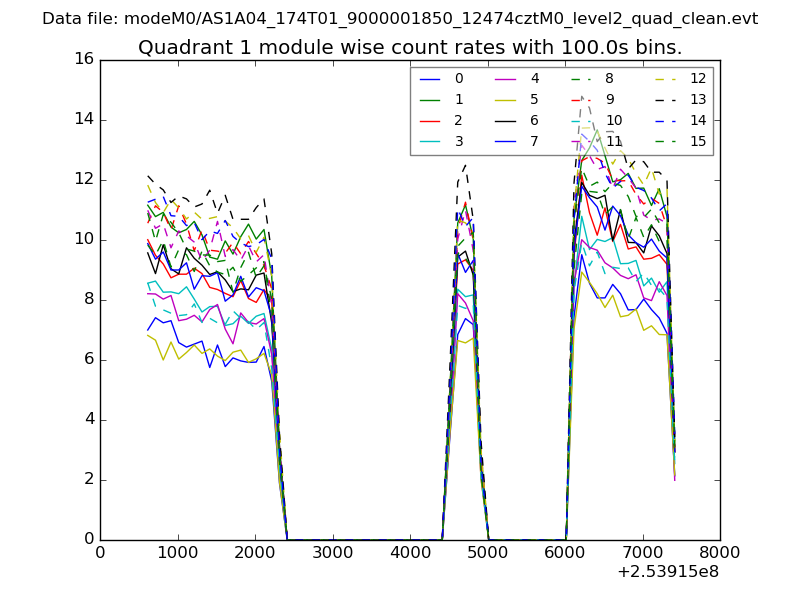
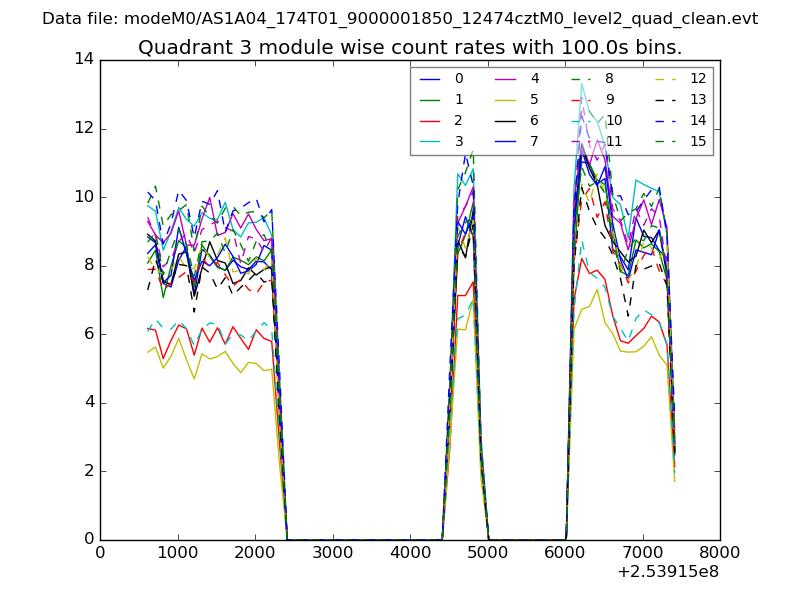
| Module-wise count rates for Quadrant A Data is divided into 100 sec bins |
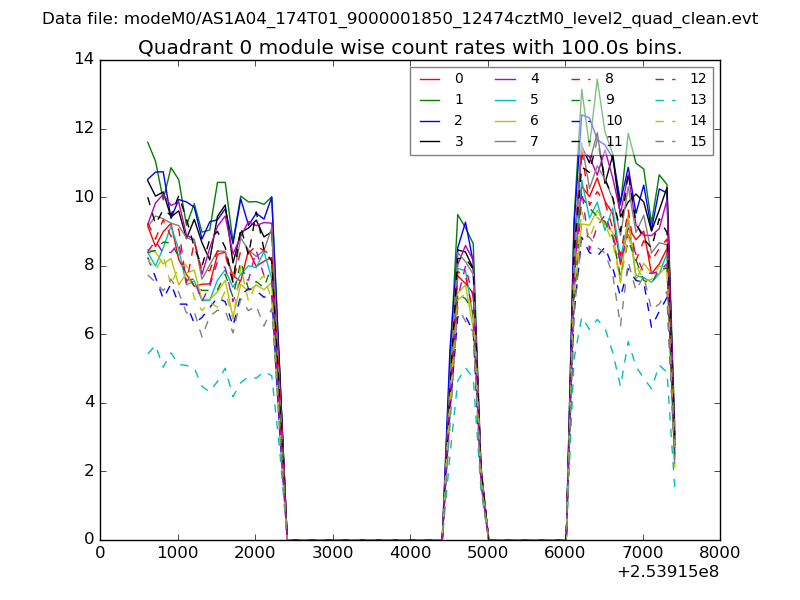 |
 |
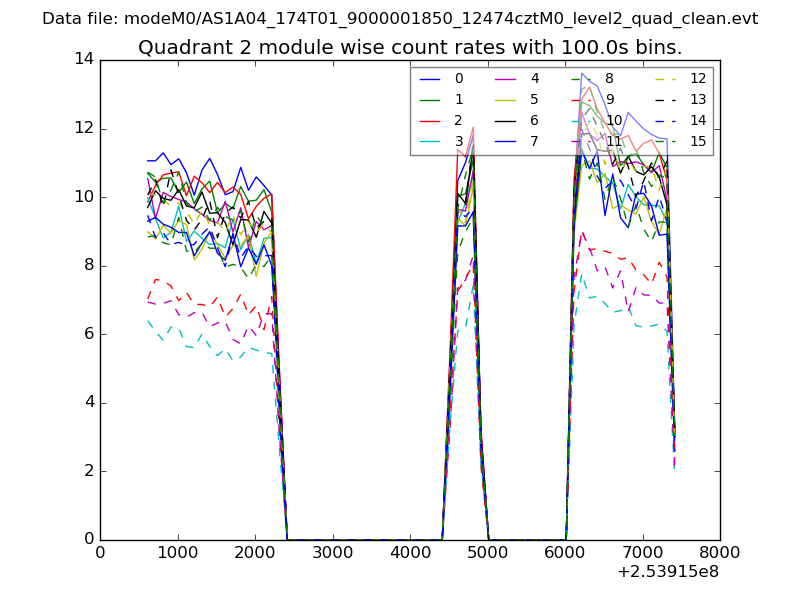
| Module-wise count rates for Quadrant B Data is divided into 100 sec bins |
 |
 |
| Module-wise count rates for Quadrant C Data is divided into 100 sec bins |
 |
 |
| Module-wise count rates for Quadrant D Data is divided into 100 sec bins |
 |
 |
| Parameter | Plot |
|---|---|
| CZT HV Monitor | 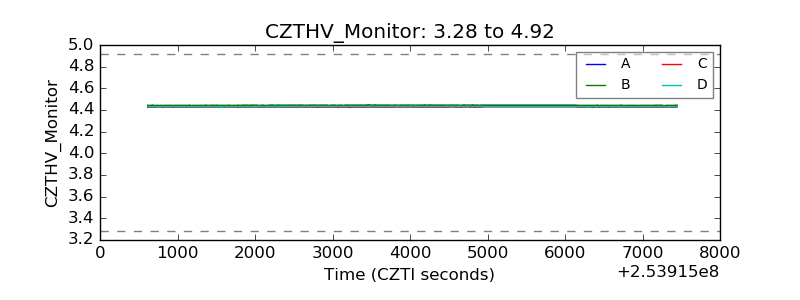 |
| D_VDD | 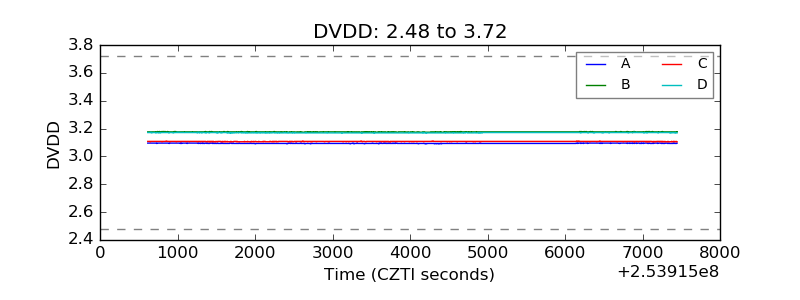 |
| Temperature 1 |  |
| Veto HV Monitor | 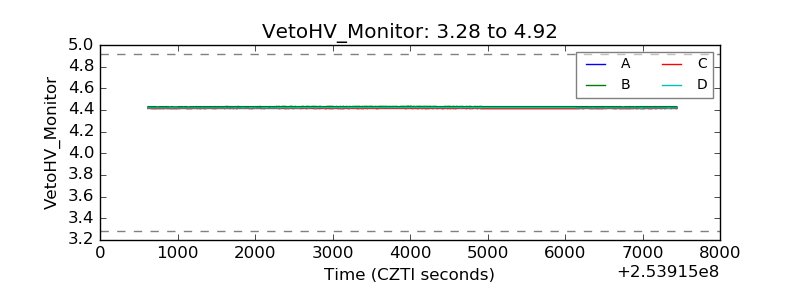 |
| Veto LLD | 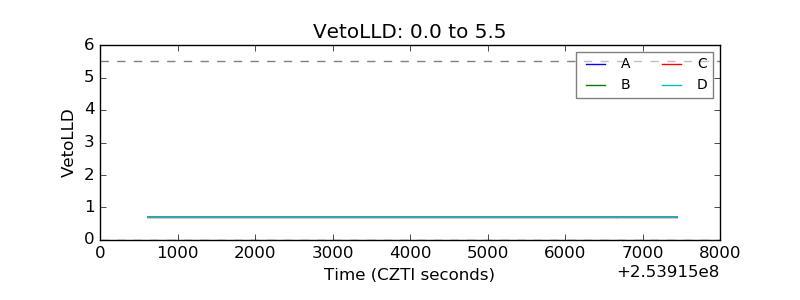 |
| Alpha Counter | 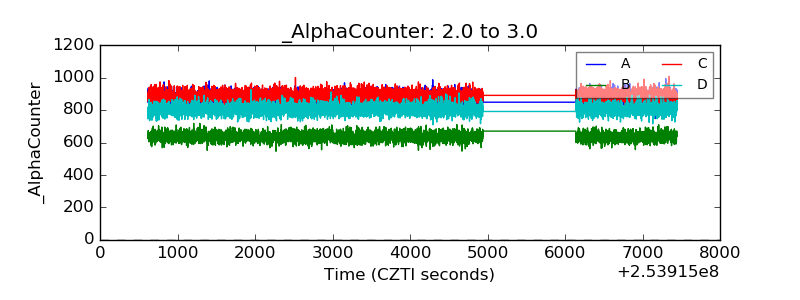 |
| _CPM_Rate | 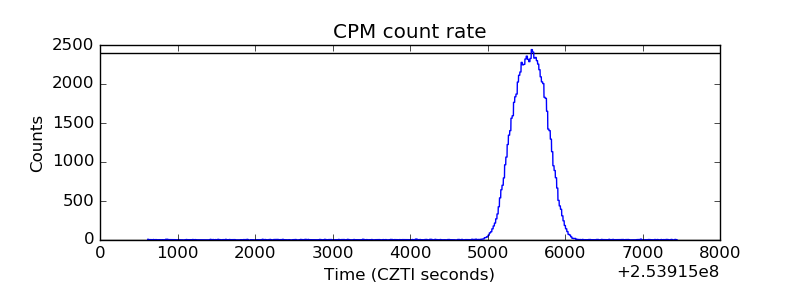 |
| CZT Counter | 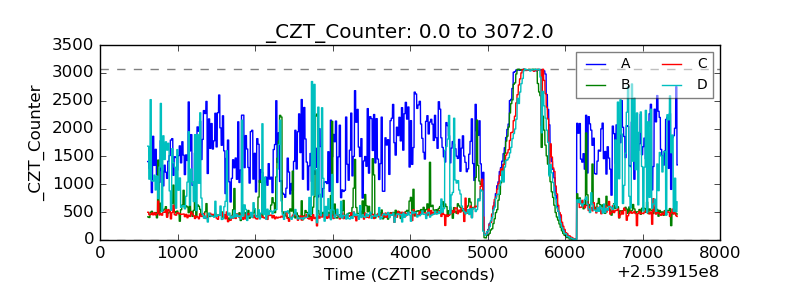 |
| +2.5 Volts monitor |  |
| +5 Volts monitor |  |
| _ROLL_ROT | 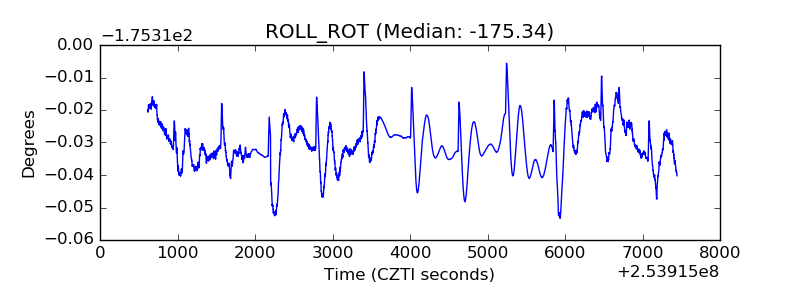 |
| _Roll_DEC | 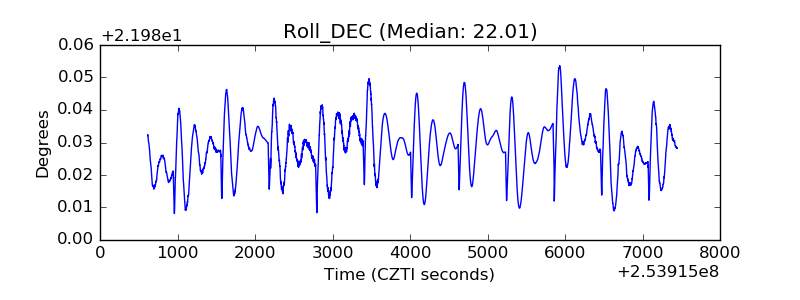 |
| _Roll_RA | 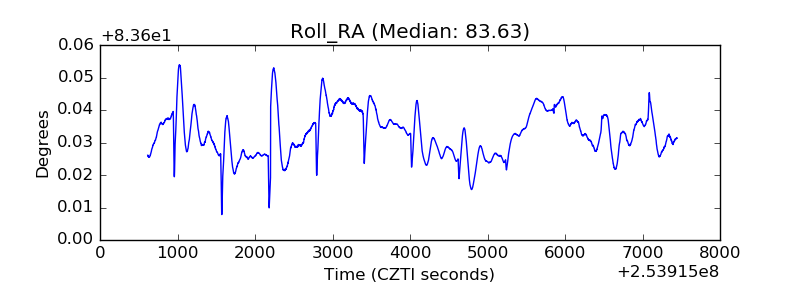 |
| Veto Counter | 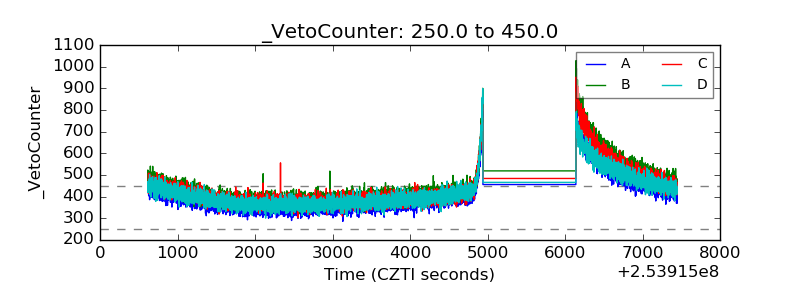 |