| Param | Original file | Final file |
|---|---|---|
| Filename | modeM0/AS1A04_174T01_9000001850_12475cztM0_level2.evt | modeM0/AS1A04_174T01_9000001850_12475cztM0_level2_quad_clean.evt |
| Size (bytes) | 771,079,680 | 91,494,720 |
| Size | 735.4 MB | 87.3 MB |
| Events in quadrant A | 10,041,873 | 507,080 |
| Events in quadrant B | 3,857,719 | 640,864 |
| Events in quadrant C | 2,967,148 | 629,408 |
| Events in quadrant D | 6,072,197 | 564,730 |
| Mode M0 | |||
|---|---|---|---|
| Quadrant | BADHDUFLAG | Total packets | Discarded packets |
| A | 0 | 34090 | 2 |
| B | 0 | 15357 | 1 |
| C | 0 | 12623 | 1 |
| D | 0 | 22048 | 1 |
| Mode M9 | |||
|---|---|---|---|
| Quadrant | BADHDUFLAG | Total packets | Discarded packets |
| A | 0 | 13 | 0 |
| B | 0 | 13 | 0 |
| C | 0 | 13 | 0 |
| D | 0 | 13 | 0 |
| Mode SS | |||
|---|---|---|---|
| Quadrant | BADHDUFLAG | Total packets | Discarded packets |
| A | 0 | 126 | 0 |
| B | 0 | 126 | 0 |
| C | 0 | 126 | 0 |
| D | 0 | 126 | 0 |
| Quadrant | Total seconds | Saturated seconds | Saturation percentage |
|---|---|---|---|
| A | 6123 | 2246 | 36.681365% |
| B | 6123 | 194 | 3.168382% |
| C | 6123 | 7 | 0.114323% |
| D | 6123 | 782 | 12.771517% |
Noise dominated data is calculated using 1-second bins in cleaned event files. If a bin has >2000 counts, and if more than 50% of those come from <1% of pixels, then it is considered to be noise-dominated and hence unusable.
| Quadrant | # 1 sec bins | Bins with >0 counts | Bins with >2000 counts | High rate bins dominated by noise | Noise dominated (total time) | Noise dominated (detector-on time) | Marked lightcurve |
|---|---|---|---|---|---|---|---|
| A | 7434 | 6124 | 1705 | 1705 | 22.94% | 27.84% | 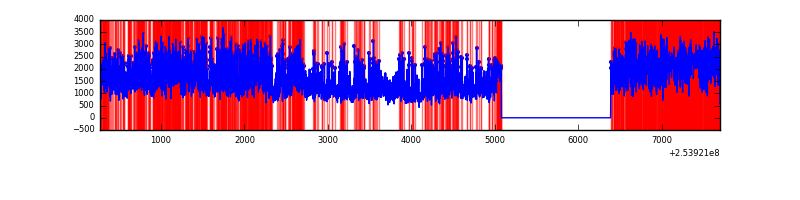 |
| B | 7434 | 6125 | 114 | 114 | 1.53% | 1.86% | 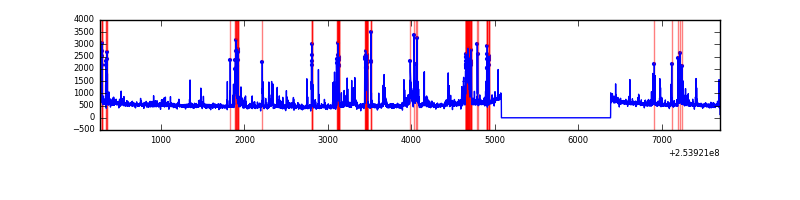 |
| C | 7434 | 6125 | 0 | 0 | 0.00% | 0.00% | 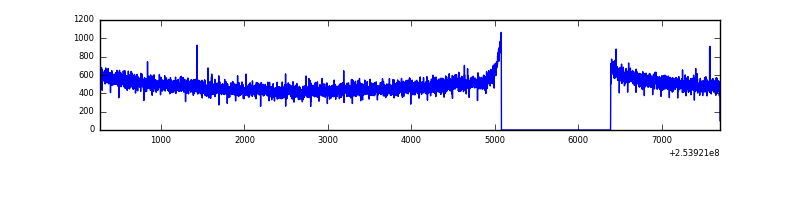 |
| D | 7434 | 6124 | 800 | 800 | 10.76% | 13.06% | 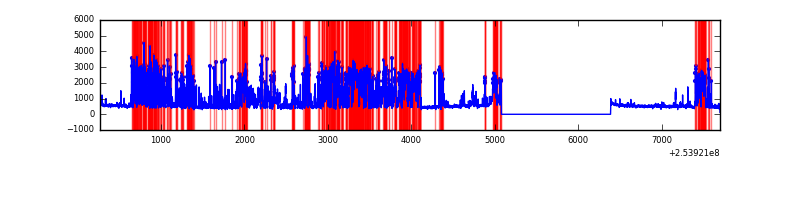 |
Top three noisy pixels from each quadrant. If the there are fewer than three noisy pixels in the level2.evt file, extra rows are filled as -1
| Pixel properties | Quadrant properties | ||||||
|---|---|---|---|---|---|---|---|
| Quadrant | DetID | PixID | Counts | Sigma | Mean | Median | Sigma |
| A | 13 | 251 | 6482361 | 47039.41 | 689 | 678 | 137.8 |
| A | 0 | 23 | 572756 | 4151.73 | 689 | 678 | 137.8 |
| A | 12 | 189 | 86015 | 619.31 | 689 | 678 | 137.8 |
| B | 4 | 239 | 562511 | 3861.52 | 779 | 762 | 145.5 |
| B | 0 | 197 | 70500 | 479.39 | 779 | 762 | 145.5 |
| B | 3 | 64 | 55115 | 373.63 | 779 | 762 | 145.5 |
| C | 13 | 61 | 5517 | 27.02 | 760 | 767 | 175.8 |
| C | 3 | 233 | 3083 | 13.17 | 760 | 767 | 175.8 |
| C | 14 | 234 | 2698 | 10.98 | 760 | 767 | 175.8 |
| D | 1 | 52 | 3282003 | 18784.53 | 722 | 705 | 174.7 |
| D | 7 | 71 | 31622 | 176.99 | 722 | 705 | 174.7 |
| D | 2 | 234 | 22990 | 127.58 | 722 | 705 | 174.7 |
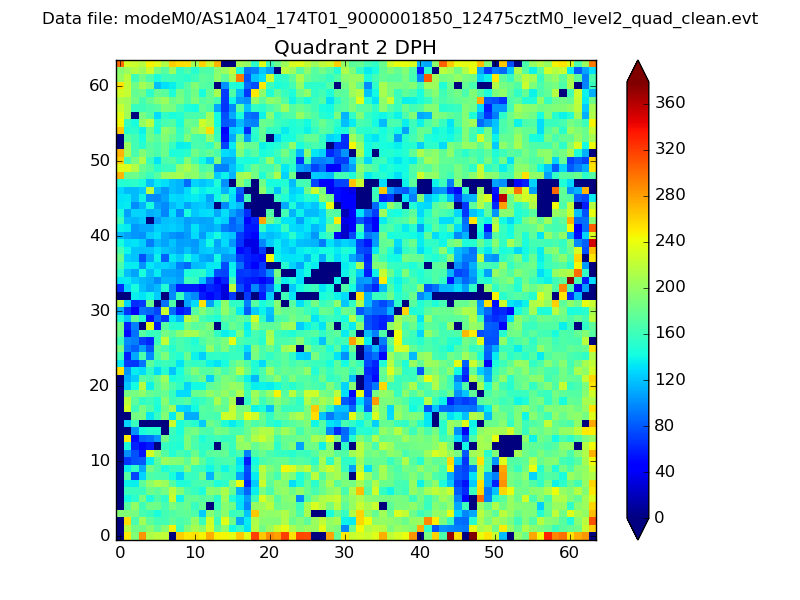
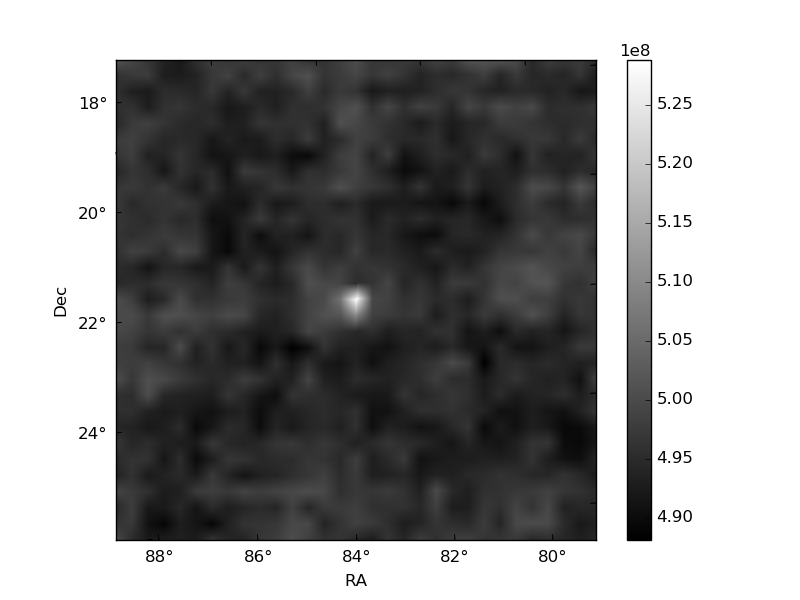
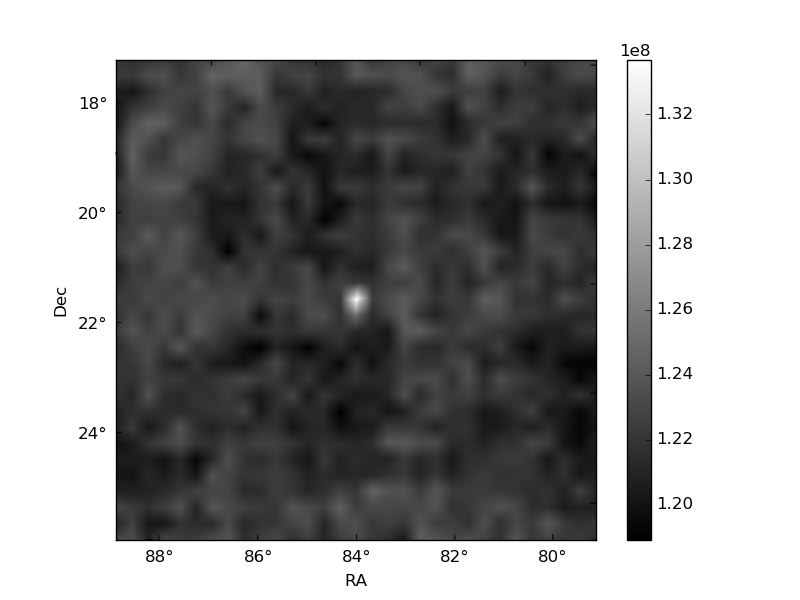
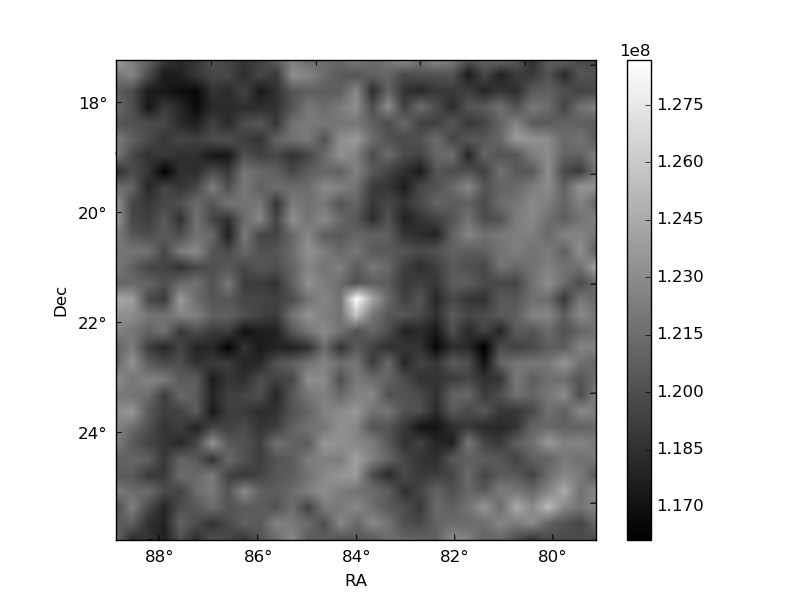
Histogram calculated using DETX and DETY for each event in the final _common_clean file
| Quadrant A | 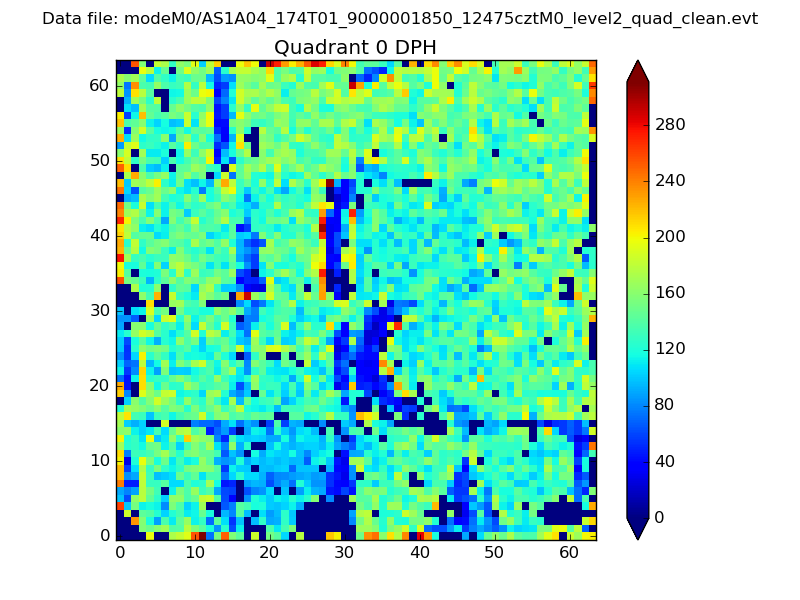 |
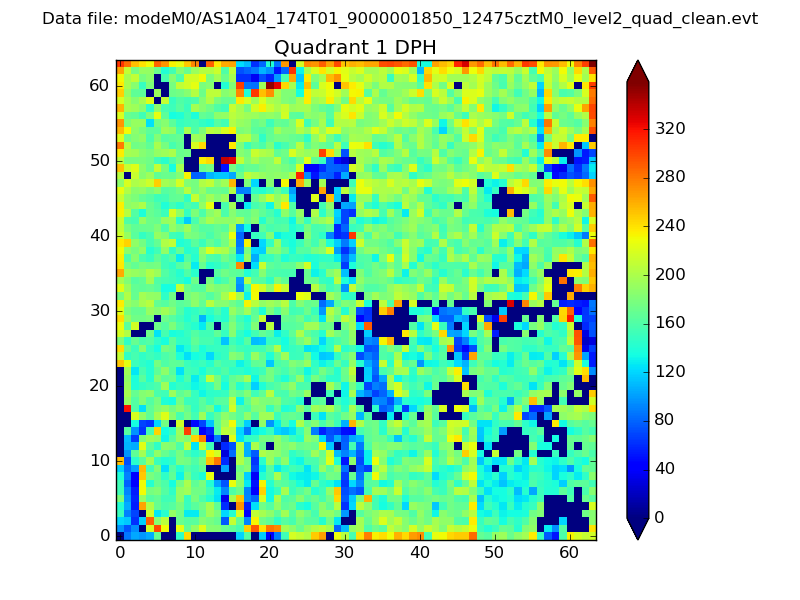 |
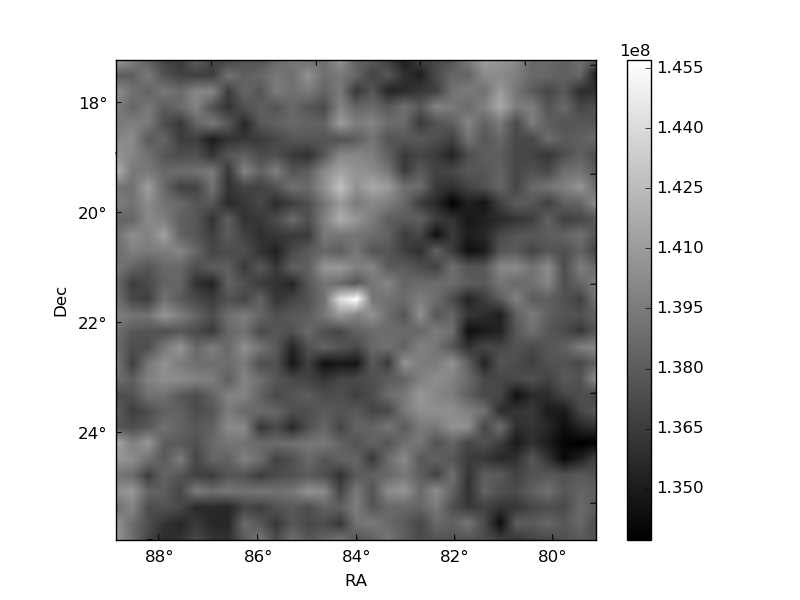
Quadrant B |
|---|---|---|---|
| Quadrant D | 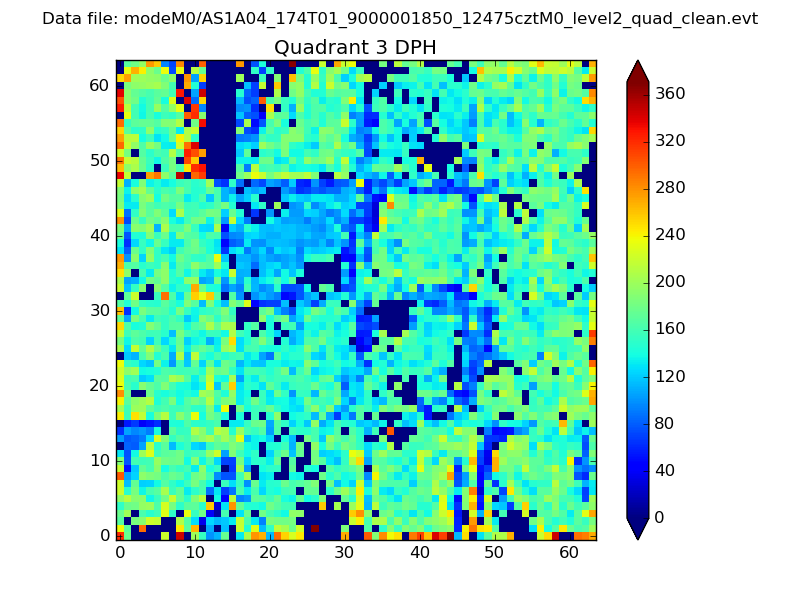 |
 |
Quadrant C |
| Plot type | Count rate plots | Images |
|---|---|---|
| Comparison with Poisson distribution Blue bars denote a histogram of data divided into 1 sec bins. Red curve is a Poisson curve with rate = median count rate of data. |
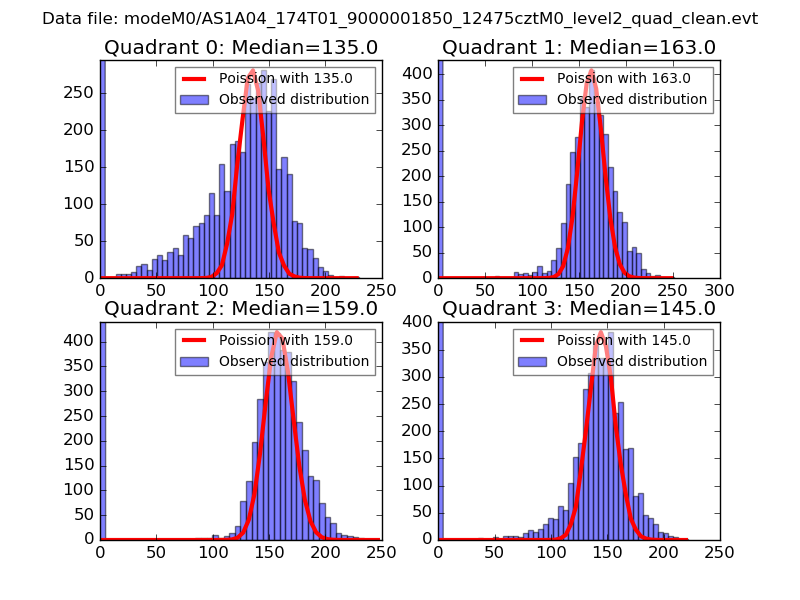 |
 |
| Quadrant-wise count rates Data is divided into 100 sec bins |
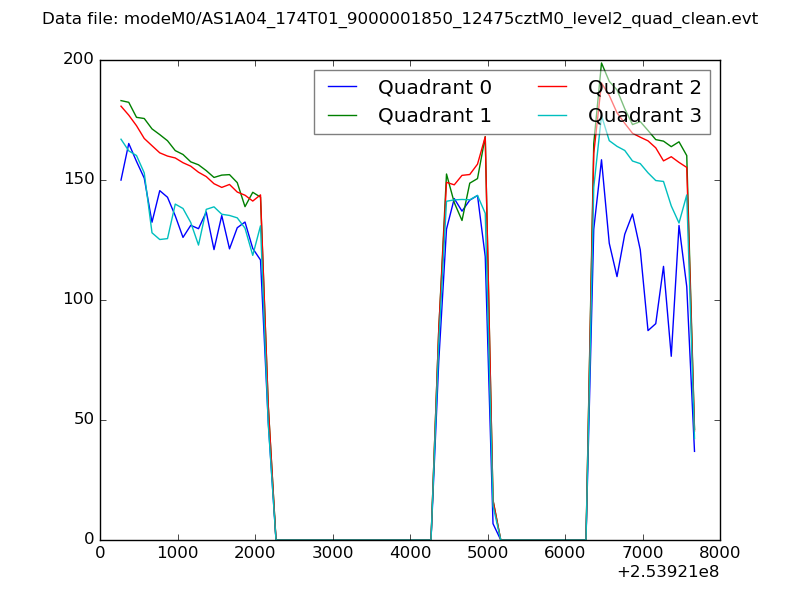 |
|
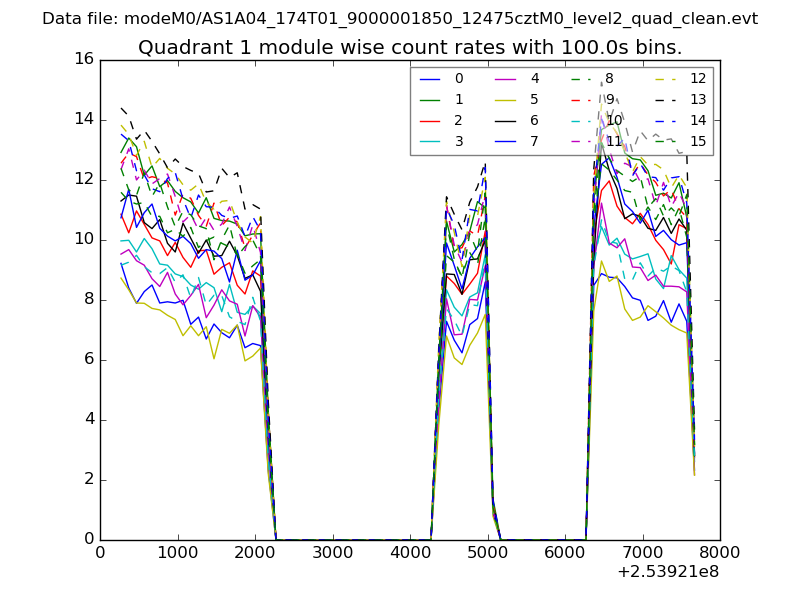
| Module-wise count rates for Quadrant A Data is divided into 100 sec bins |
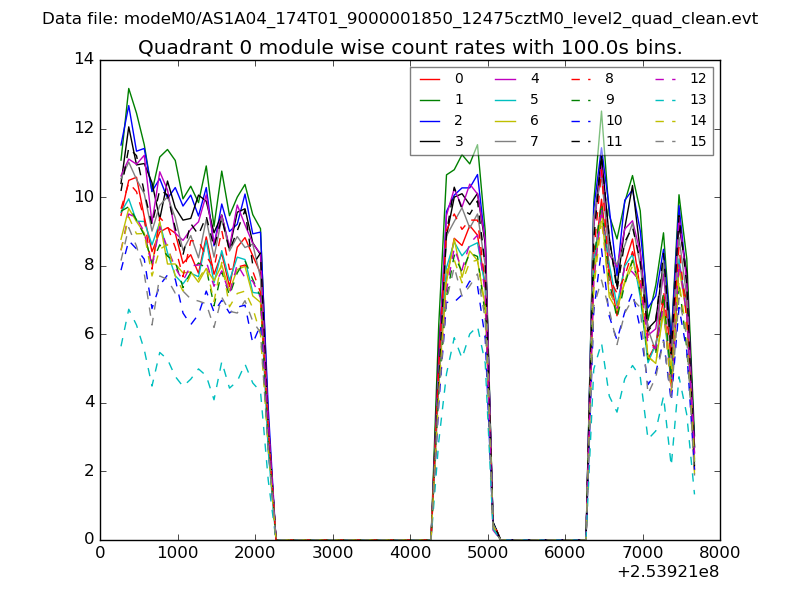 |
 |
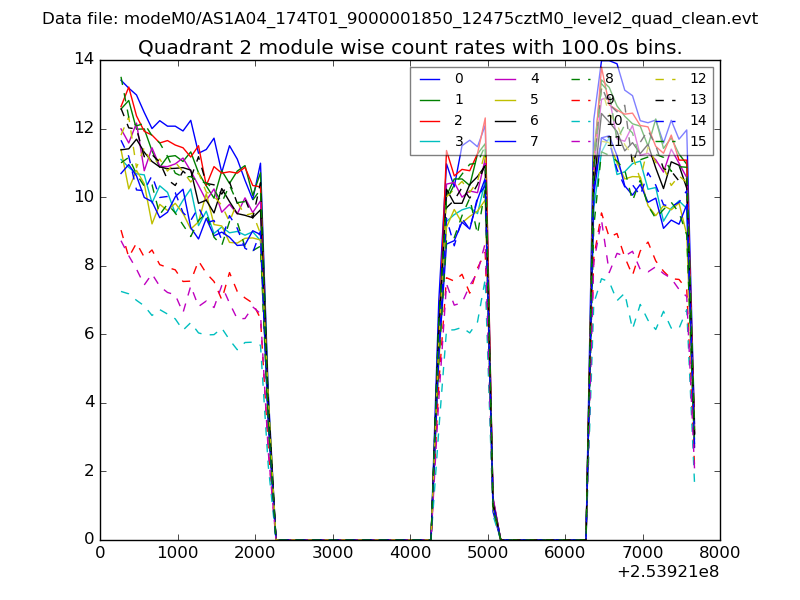
| Module-wise count rates for Quadrant B Data is divided into 100 sec bins |
 |
 |
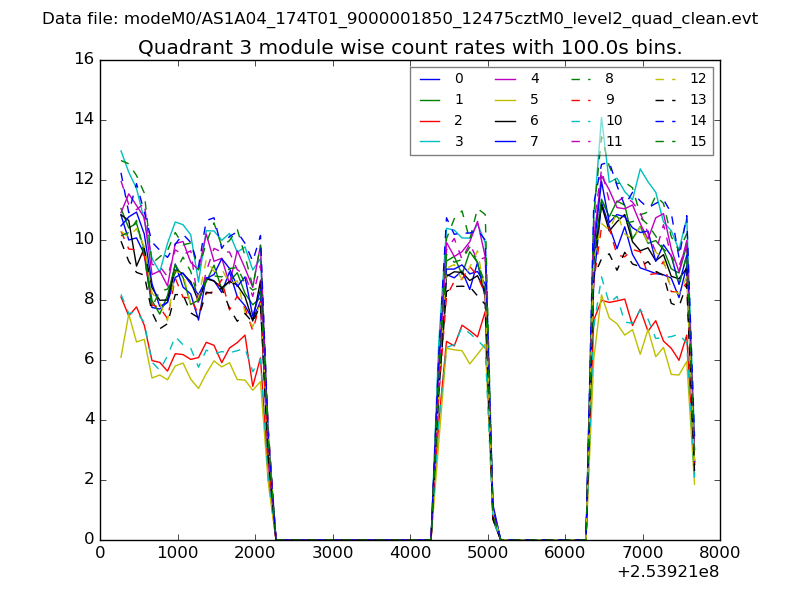
| Module-wise count rates for Quadrant C Data is divided into 100 sec bins |
 |
 |
| Module-wise count rates for Quadrant D Data is divided into 100 sec bins |
 |
 |
| Parameter | Plot |
|---|---|
| CZT HV Monitor | 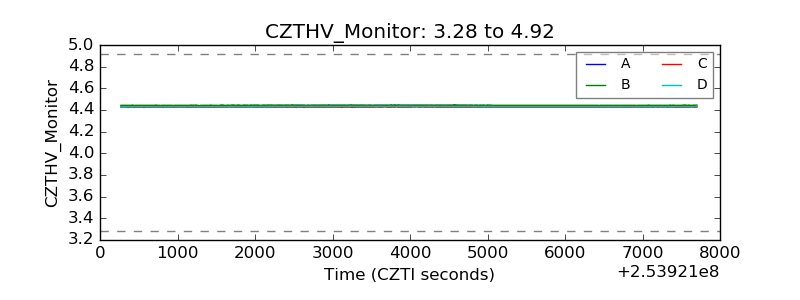 |
| D_VDD | 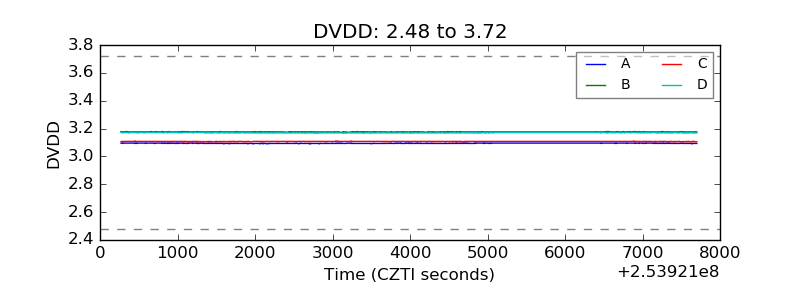 |
| Temperature 1 | 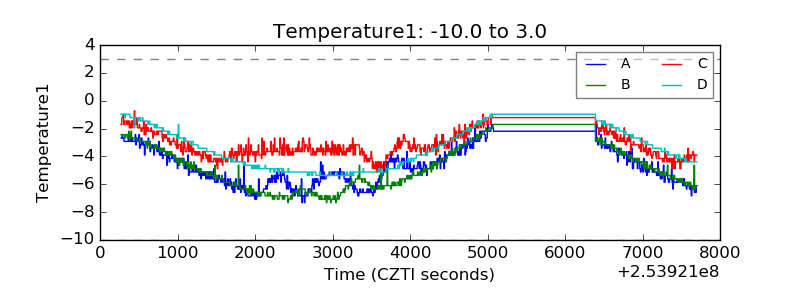 |
| Veto HV Monitor | 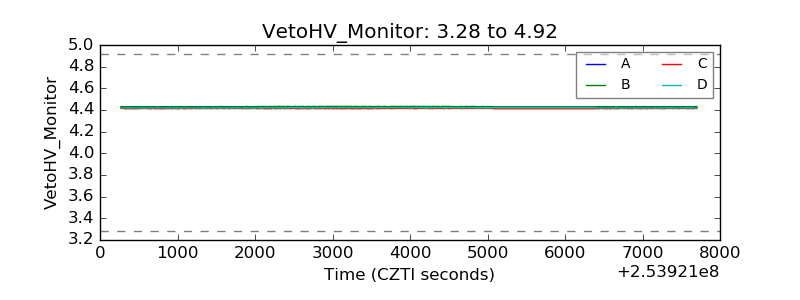 |
| Veto LLD | 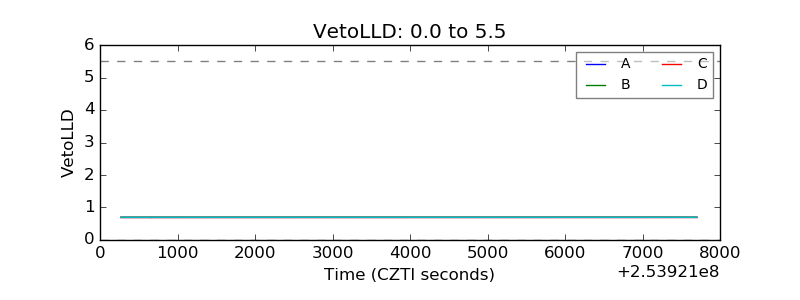 |
| Alpha Counter | 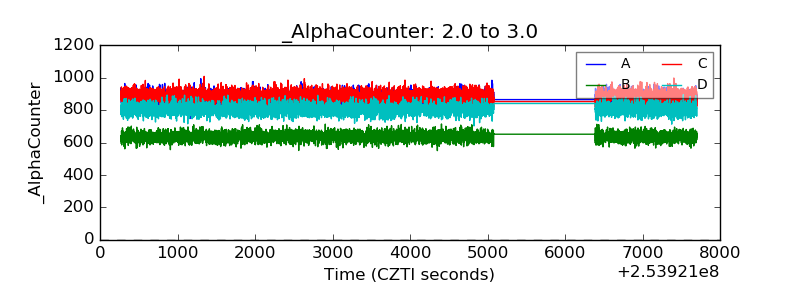 |
| _CPM_Rate | 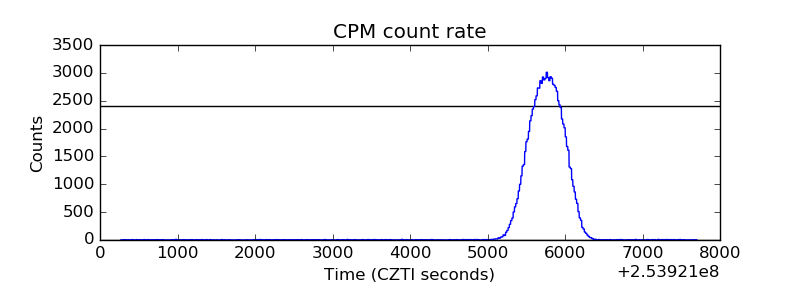 |
| CZT Counter | 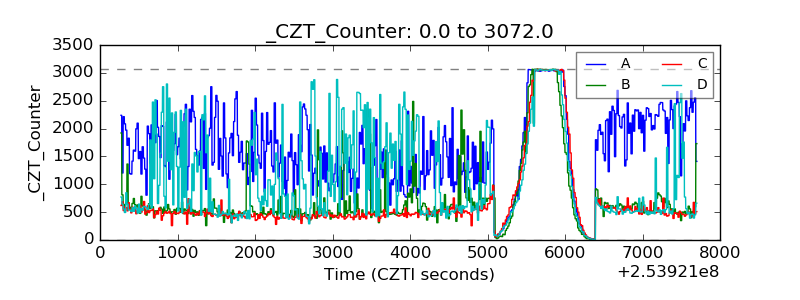 |
| +2.5 Volts monitor |  |
| +5 Volts monitor |  |
| _ROLL_ROT | 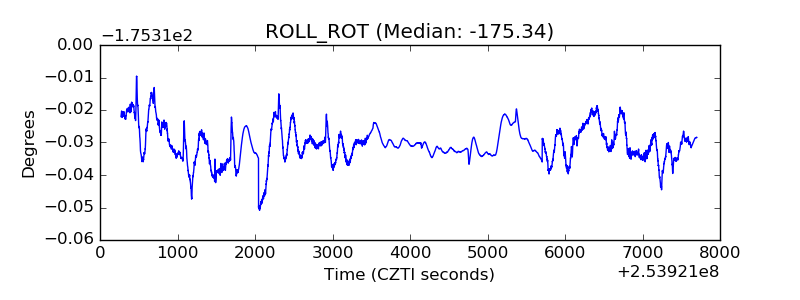 |
| _Roll_DEC | 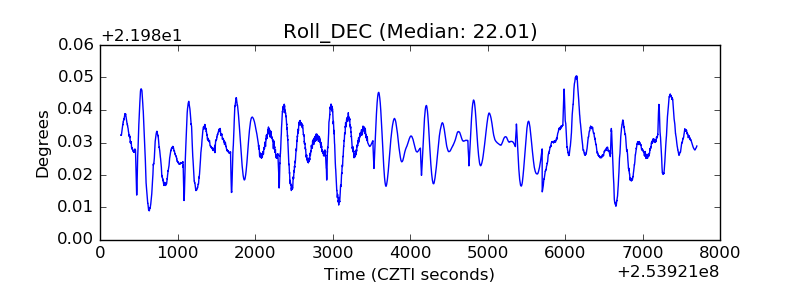 |
| _Roll_RA | 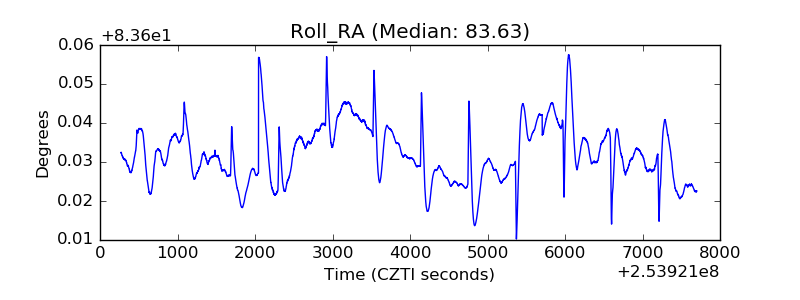 |
| Veto Counter | 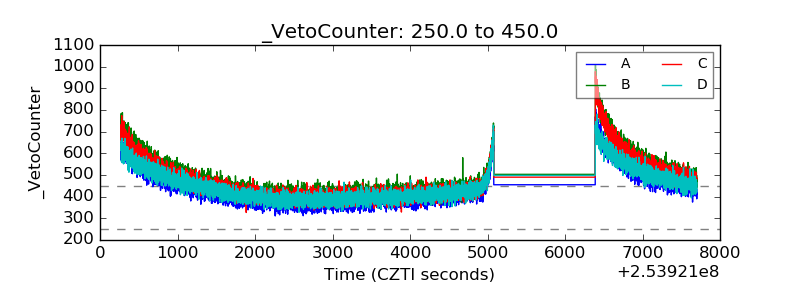 |