| Param | Original file | Final file |
|---|---|---|
| Filename | modeM0/AS1A04_174T01_9000001850_12476cztM0_level2.evt | modeM0/AS1A04_174T01_9000001850_12476cztM0_level2_quad_clean.evt |
| Size (bytes) | 760,026,240 | 88,761,600 |
| Size | 724.8 MB | 84.6 MB |
| Events in quadrant A | 11,950,088 | 439,213 |
| Events in quadrant B | 4,403,220 | 622,918 |
| Events in quadrant C | 3,003,823 | 623,771 |
| Events in quadrant D | 3,250,680 | 577,808 |
| Mode M0 | |||
|---|---|---|---|
| Quadrant | BADHDUFLAG | Total packets | Discarded packets |
| A | 0 | 39670 | 2 |
| B | 0 | 17082 | 1 |
| C | 0 | 12616 | 1 |
| D | 0 | 13558 | 1 |
| Mode M9 | |||
|---|---|---|---|
| Quadrant | BADHDUFLAG | Total packets | Discarded packets |
| A | 0 | 14 | 0 |
| B | 0 | 14 | 0 |
| C | 0 | 14 | 0 |
| D | 0 | 14 | 0 |
| Mode SS | |||
|---|---|---|---|
| Quadrant | BADHDUFLAG | Total packets | Discarded packets |
| A | 0 | 122 | 0 |
| B | 0 | 122 | 0 |
| C | 0 | 122 | 0 |
| D | 0 | 122 | 0 |
| Quadrant | Total seconds | Saturated seconds | Saturation percentage |
|---|---|---|---|
| A | 6062 | 3912 | 64.533157% |
| B | 6062 | 359 | 5.922138% |
| C | 6062 | 14 | 0.230947% |
| D | 6062 | 53 | 0.874299% |
Noise dominated data is calculated using 1-second bins in cleaned event files. If a bin has >2000 counts, and if more than 50% of those come from <1% of pixels, then it is considered to be noise-dominated and hence unusable.
| Quadrant | # 1 sec bins | Bins with >0 counts | Bins with >2000 counts | High rate bins dominated by noise | Noise dominated (total time) | Noise dominated (detector-on time) | Marked lightcurve |
|---|---|---|---|---|---|---|---|
| A | 7413 | 6063 | 3142 | 3142 | 42.38% | 51.82% |  |
| B | 7413 | 6064 | 246 | 246 | 3.32% | 4.06% |  |
| C | 7413 | 6064 | 2 | 2 | 0.03% | 0.03% | 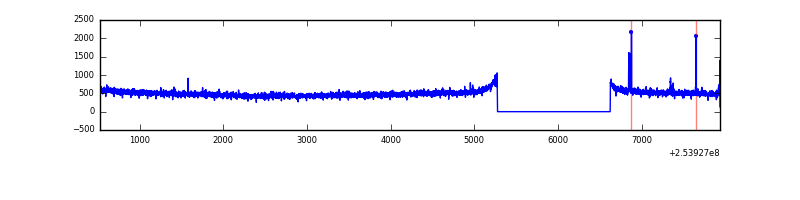 |
| D | 7413 | 6064 | 68 | 68 | 0.92% | 1.12% |  |
Top three noisy pixels from each quadrant. If the there are fewer than three noisy pixels in the level2.evt file, extra rows are filled as -1
| Pixel properties | Quadrant properties | ||||||
|---|---|---|---|---|---|---|---|
| Quadrant | DetID | PixID | Counts | Sigma | Mean | Median | Sigma |
| A | 13 | 251 | 8895201 | 73125.2 | 601 | 592 | 121.6 |
| A | 0 | 23 | 436403 | 3582.93 | 601 | 592 | 121.6 |
| A | 12 | 189 | 95713 | 782.02 | 601 | 592 | 121.6 |
| B | 4 | 239 | 815311 | 5618.89 | 778 | 761 | 145.0 |
| B | 0 | 85 | 352134 | 2423.83 | 778 | 761 | 145.0 |
| B | 0 | 197 | 88012 | 601.87 | 778 | 761 | 145.0 |
| C | 15 | 208 | 12680 | 66.9 | 765 | 773 | 178.0 |
| C | 14 | 234 | 6422 | 31.74 | 765 | 773 | 178.0 |
| C | 13 | 61 | 5659 | 27.45 | 765 | 773 | 178.0 |
| D | 1 | 52 | 315890 | 1735.66 | 749 | 727 | 181.6 |
| D | 13 | 104 | 38736 | 209.32 | 749 | 727 | 181.6 |
| D | 7 | 71 | 34860 | 187.97 | 749 | 727 | 181.6 |
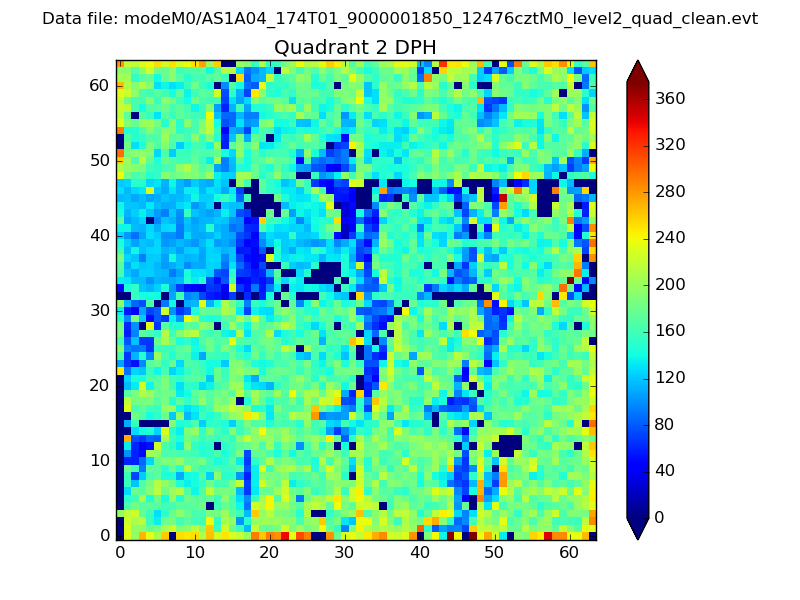
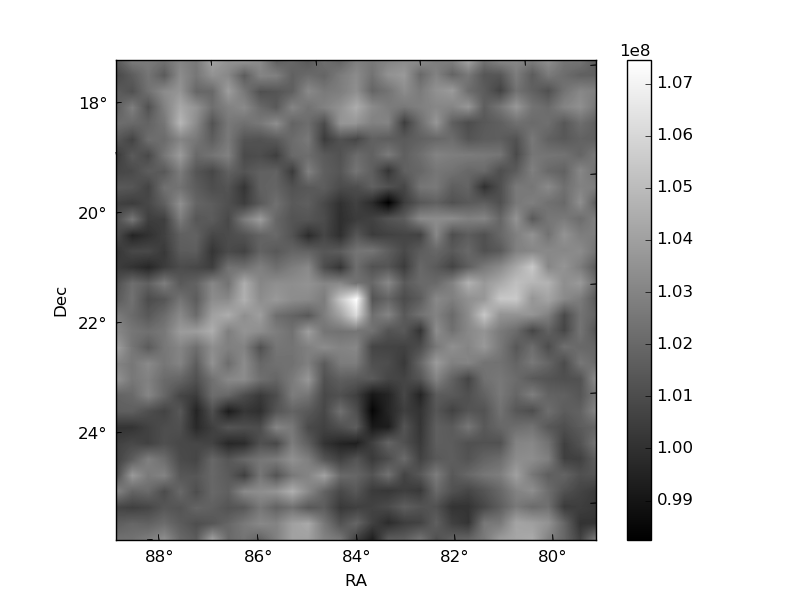
Histogram calculated using DETX and DETY for each event in the final _common_clean file
| Quadrant A | 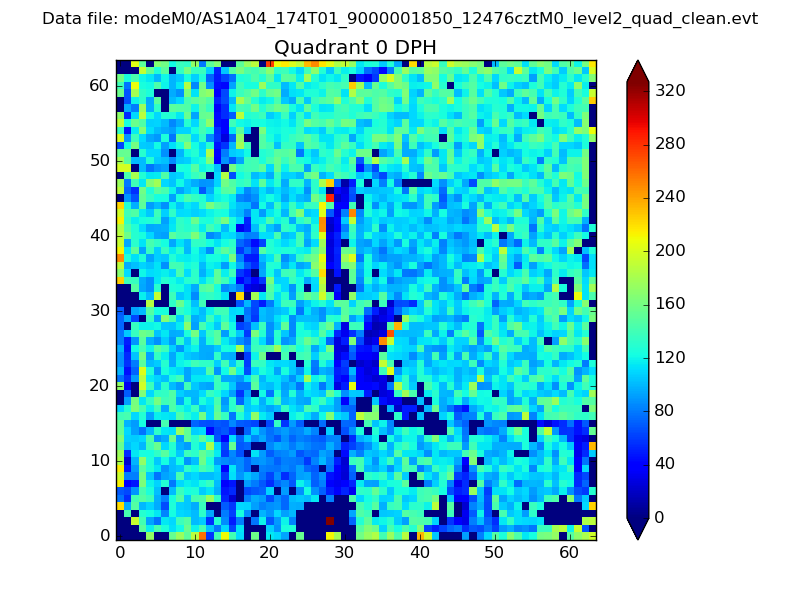 |
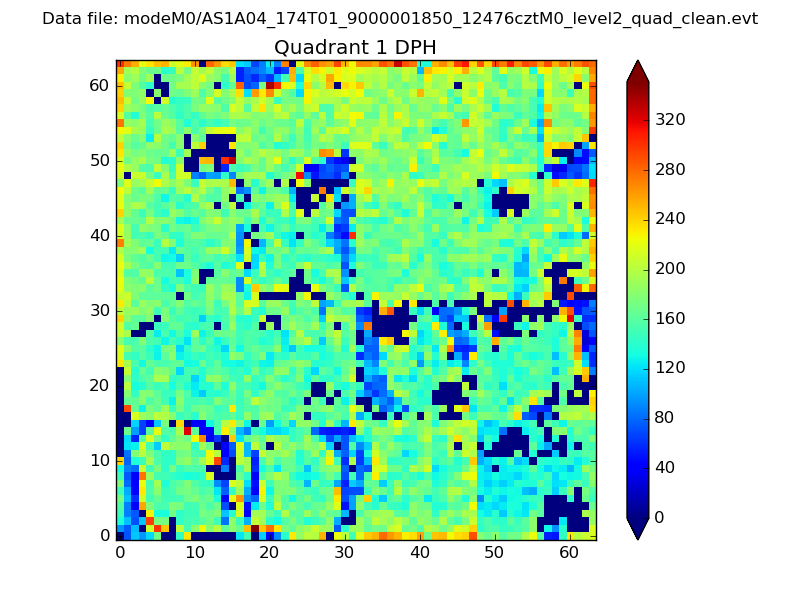 |
Quadrant B |
|---|---|---|---|
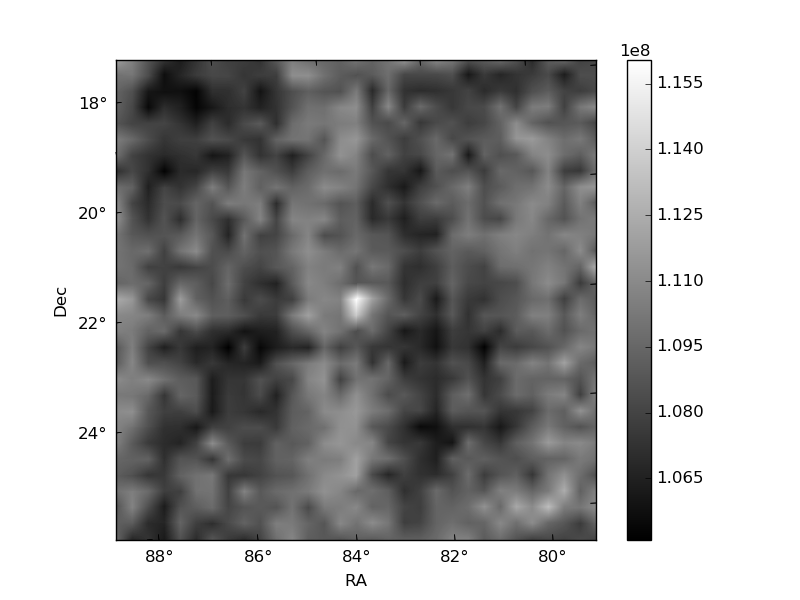
| Quadrant D | 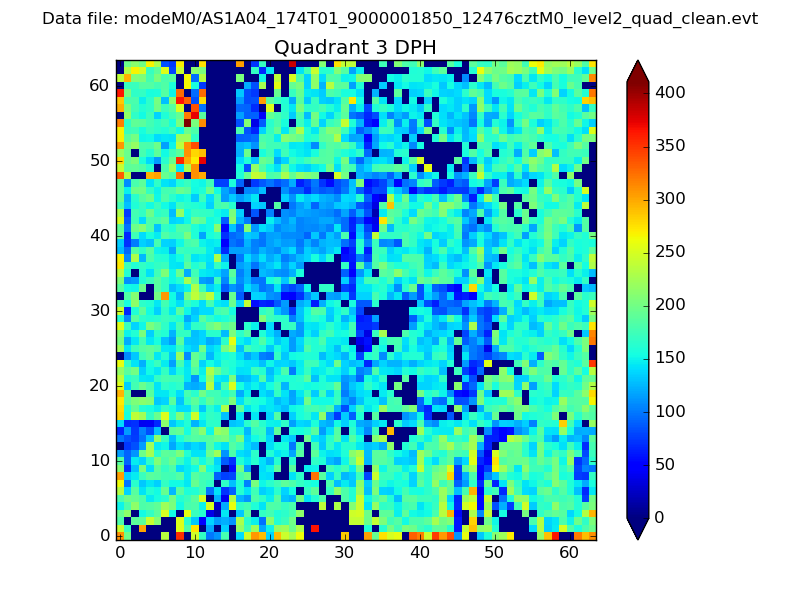 |
 |
Quadrant C |
| Plot type | Count rate plots | Images |
|---|---|---|
| Comparison with Poisson distribution Blue bars denote a histogram of data divided into 1 sec bins. Red curve is a Poisson curve with rate = median count rate of data. |
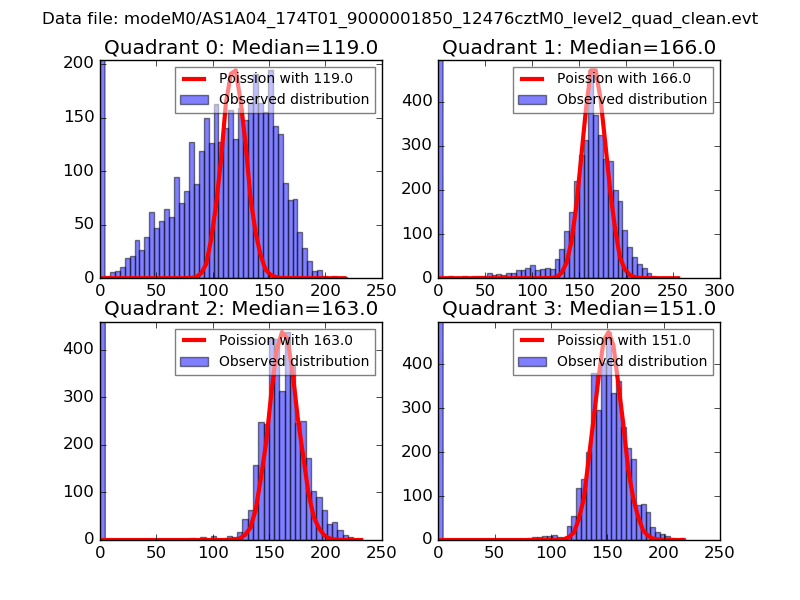 |
 |
| Quadrant-wise count rates Data is divided into 100 sec bins |
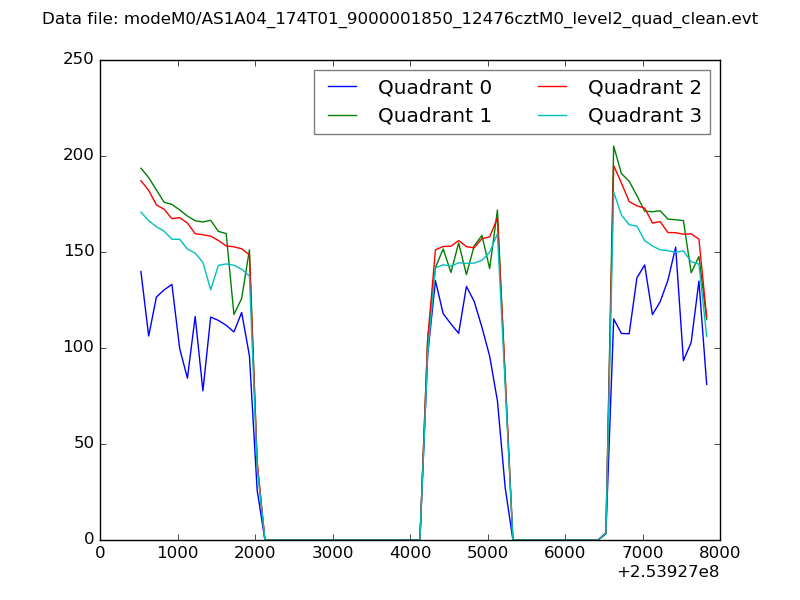 |
|
| Module-wise count rates for Quadrant A Data is divided into 100 sec bins |
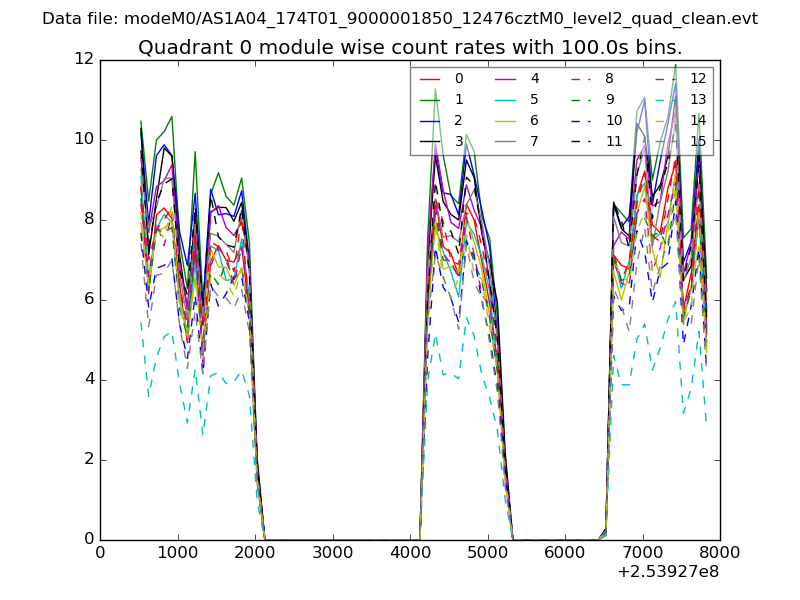 |
 |
| Module-wise count rates for Quadrant B Data is divided into 100 sec bins |
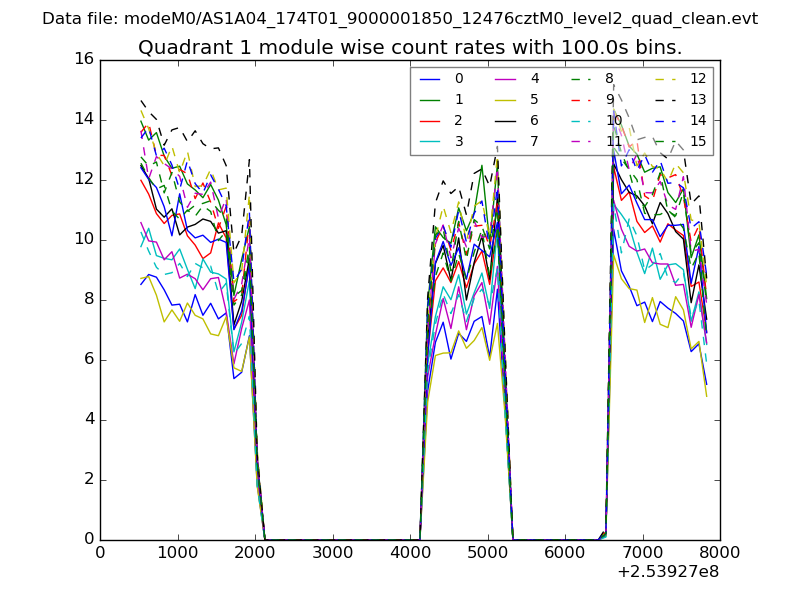 |
 |
| Module-wise count rates for Quadrant C Data is divided into 100 sec bins |
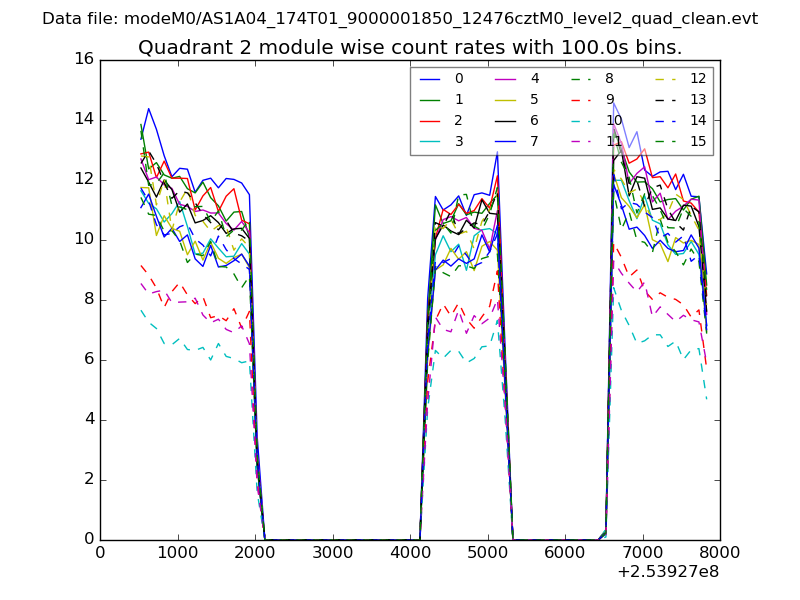 |
 |
| Module-wise count rates for Quadrant D Data is divided into 100 sec bins |
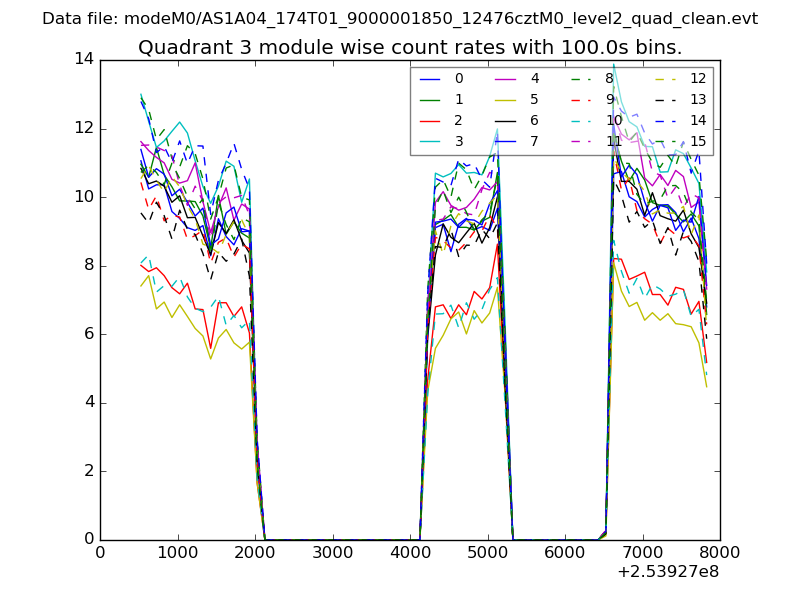 |
 |
| Parameter | Plot |
|---|---|
| CZT HV Monitor | 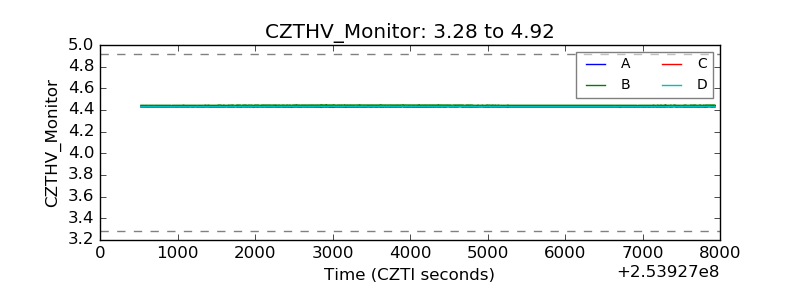 |
| D_VDD | 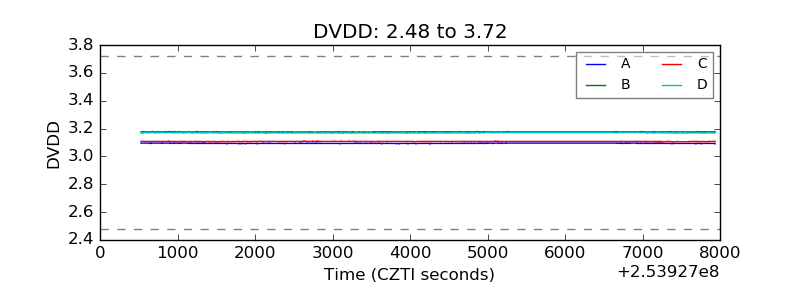 |
| Temperature 1 | 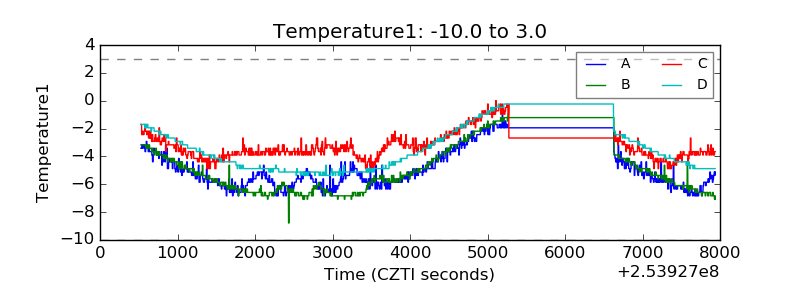 |
| Veto HV Monitor | 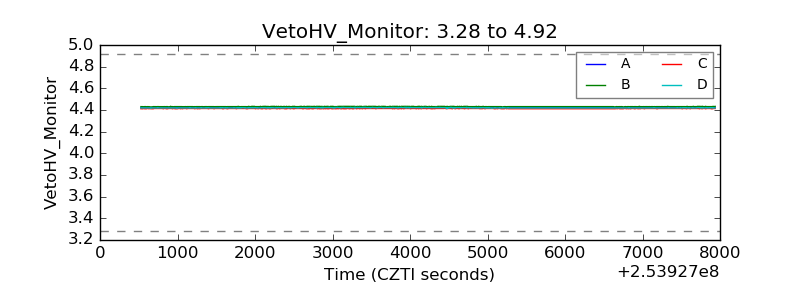 |
| Veto LLD | 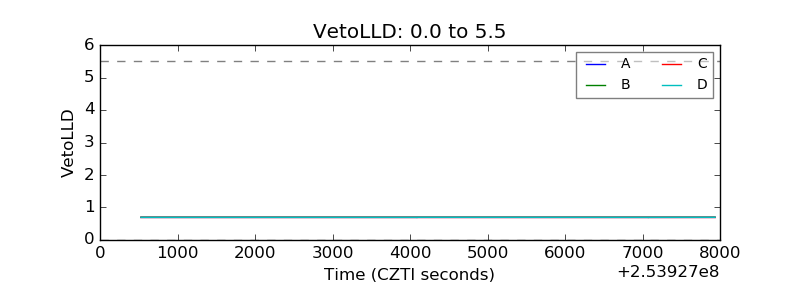 |
| Alpha Counter | 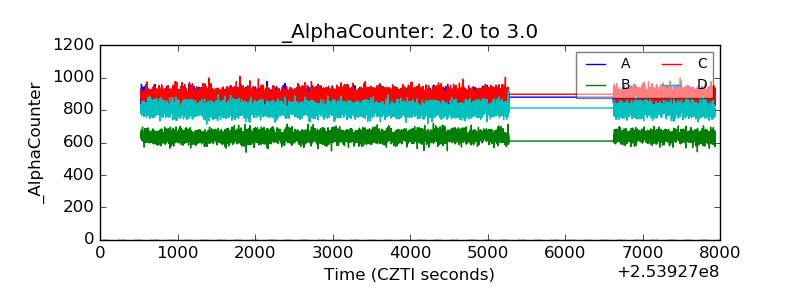 |
| _CPM_Rate | 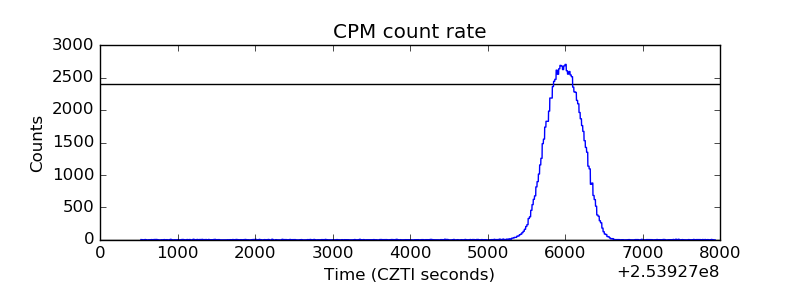 |
| CZT Counter | 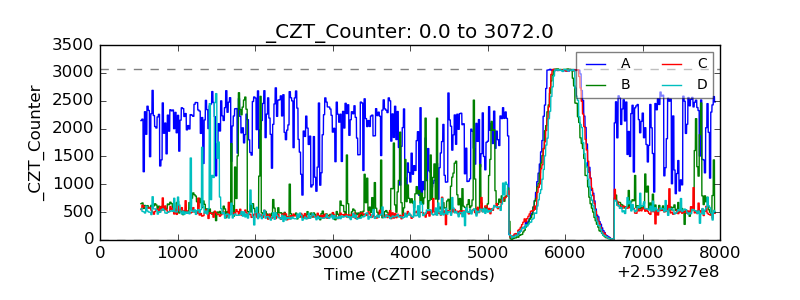 |
| +2.5 Volts monitor |  |
| +5 Volts monitor |  |
| _ROLL_ROT | 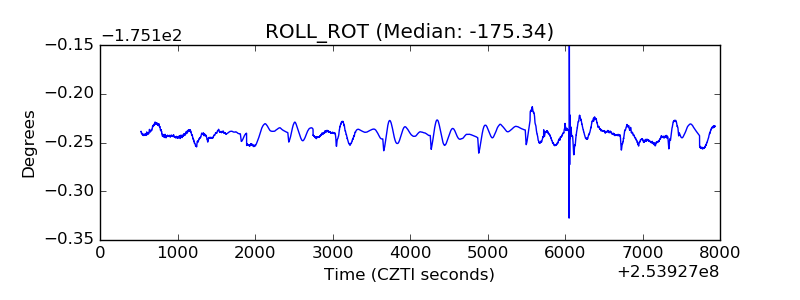 |
| _Roll_DEC | 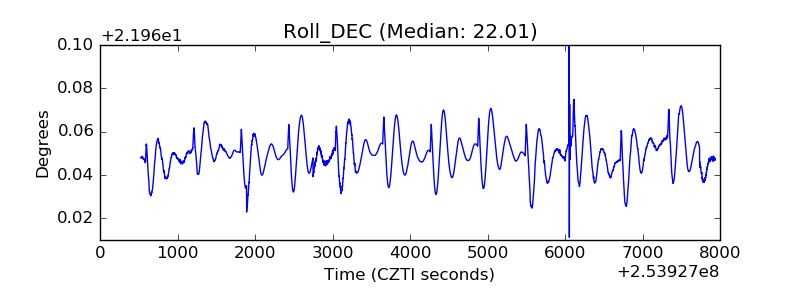 |
| _Roll_RA | 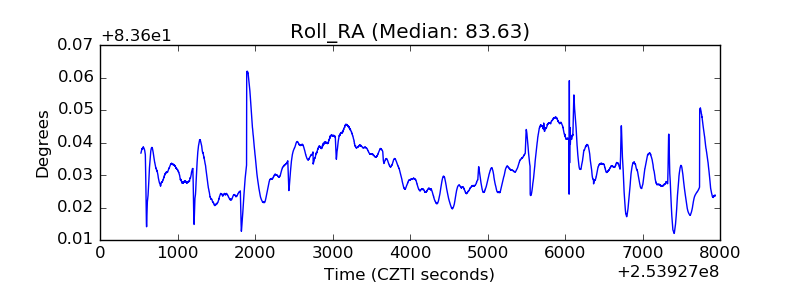 |
| Veto Counter | 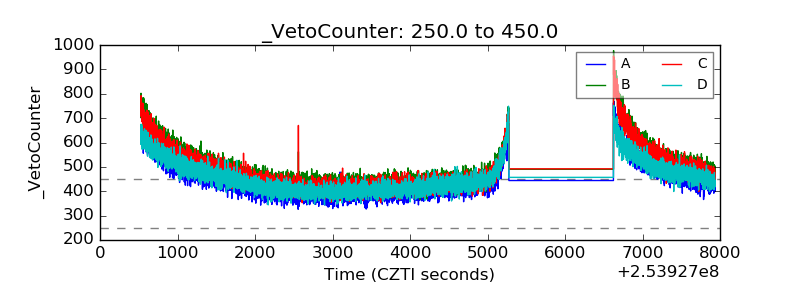 |