| Param | Original file | Final file |
|---|---|---|
| Filename | modeM0/AS1A04_174T01_9000001850_12477cztM0_level2.evt | modeM0/AS1A04_174T01_9000001850_12477cztM0_level2_quad_clean.evt |
| Size (bytes) | 671,022,720 | 80,392,320 |
| Size | 639.9 MB | 76.7 MB |
| Events in quadrant A | 9,838,454 | 447,768 |
| Events in quadrant B | 3,818,800 | 536,323 |
| Events in quadrant C | 3,087,209 | 534,895 |
| Events in quadrant D | 3,175,923 | 499,652 |
| Mode M0 | |||
|---|---|---|---|
| Quadrant | BADHDUFLAG | Total packets | Discarded packets |
| A | 0 | 33368 | 2 |
| B | 0 | 15072 | 1 |
| C | 0 | 12801 | 1 |
| D | 0 | 13079 | 1 |
| Mode M9 | |||
|---|---|---|---|
| Quadrant | BADHDUFLAG | Total packets | Discarded packets |
| A | 0 | 13 | 0 |
| B | 0 | 13 | 0 |
| C | 0 | 13 | 0 |
| D | 0 | 13 | 0 |
| Mode SS | |||
|---|---|---|---|
| Quadrant | BADHDUFLAG | Total packets | Discarded packets |
| A | 0 | 122 | 0 |
| B | 0 | 122 | 0 |
| C | 0 | 122 | 0 |
| D | 0 | 122 | 0 |
| Quadrant | Total seconds | Saturated seconds | Saturation percentage |
|---|---|---|---|
| A | 5935 | 2350 | 39.595619% |
| B | 5935 | 256 | 4.313395% |
| C | 5935 | 35 | 0.589722% |
| D | 5935 | 29 | 0.488627% |
Noise dominated data is calculated using 1-second bins in cleaned event files. If a bin has >2000 counts, and if more than 50% of those come from <1% of pixels, then it is considered to be noise-dominated and hence unusable.
| Quadrant | # 1 sec bins | Bins with >0 counts | Bins with >2000 counts | High rate bins dominated by noise | Noise dominated (total time) | Noise dominated (detector-on time) | Marked lightcurve |
|---|---|---|---|---|---|---|---|
| A | 7286 | 5936 | 1709 | 1709 | 23.46% | 28.79% | 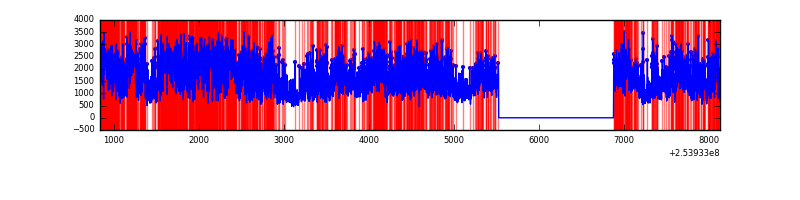 |
| B | 7286 | 5937 | 167 | 167 | 2.29% | 2.81% | 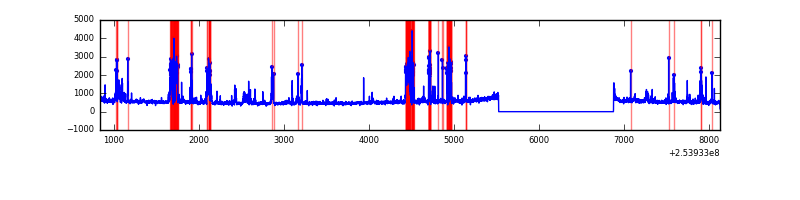 |
| C | 7286 | 5937 | 29 | 29 | 0.40% | 0.49% |  |
| D | 7286 | 5937 | 24 | 24 | 0.33% | 0.40% | 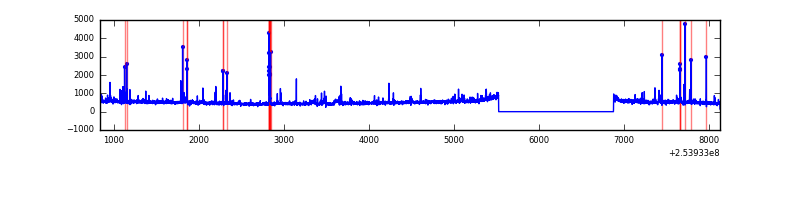 |
Top three noisy pixels from each quadrant. If the there are fewer than three noisy pixels in the level2.evt file, extra rows are filled as -1
| Pixel properties | Quadrant properties | ||||||
|---|---|---|---|---|---|---|---|
| Quadrant | DetID | PixID | Counts | Sigma | Mean | Median | Sigma |
| A | 13 | 251 | 6958255 | 51501.4 | 668 | 656 | 135.1 |
| A | 12 | 189 | 74438 | 546.15 | 668 | 656 | 135.1 |
| A | 1 | 162 | 66853 | 490.0 | 668 | 656 | 135.1 |
| B | 4 | 239 | 555305 | 3923.69 | 755 | 741 | 141.3 |
| B | 0 | 85 | 163729 | 1153.18 | 755 | 741 | 141.3 |
| B | 3 | 64 | 46239 | 321.91 | 755 | 741 | 141.3 |
| C | 15 | 208 | 194192 | 1137.33 | 739 | 747 | 170.1 |
| C | 13 | 61 | 5452 | 27.66 | 739 | 747 | 170.1 |
| C | 14 | 234 | 5451 | 27.65 | 739 | 747 | 170.1 |
| D | 1 | 52 | 256251 | 1465.65 | 725 | 706 | 174.4 |
| D | 13 | 104 | 39917 | 224.89 | 725 | 706 | 174.4 |
| D | 9 | 85 | 36252 | 203.87 | 725 | 706 | 174.4 |
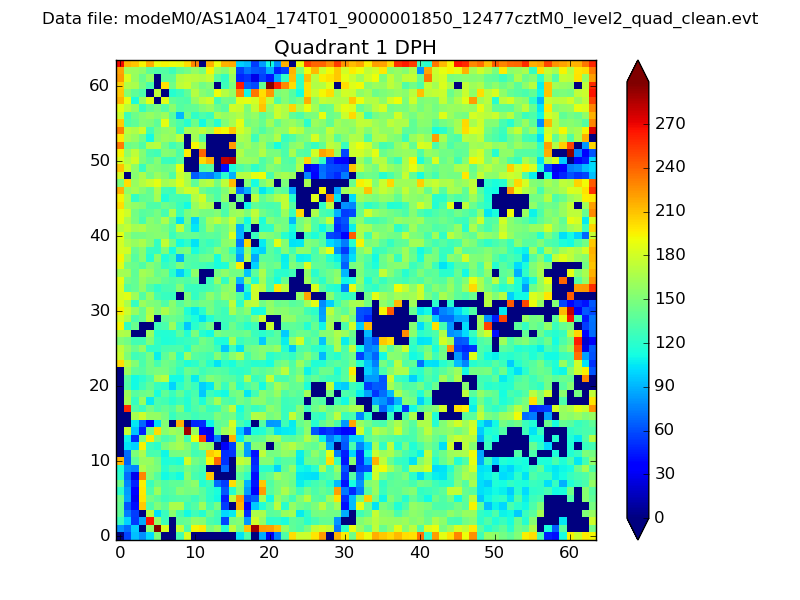
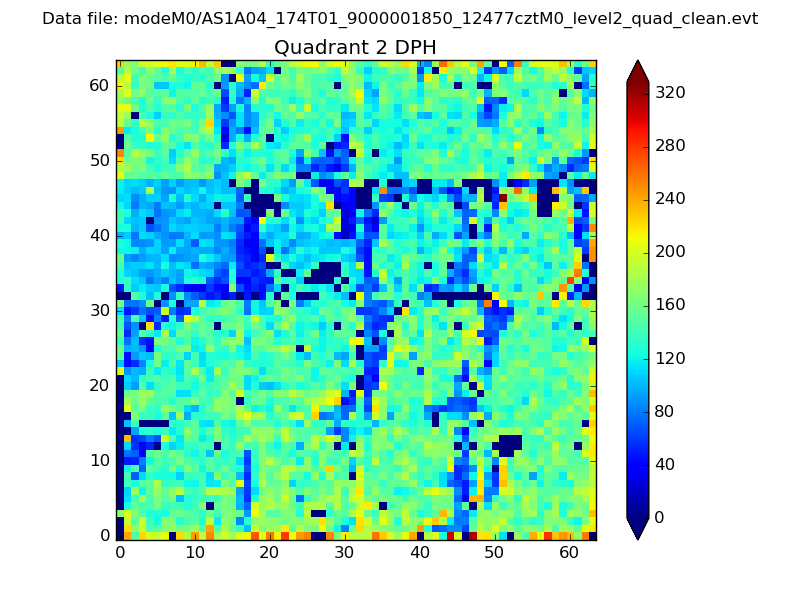
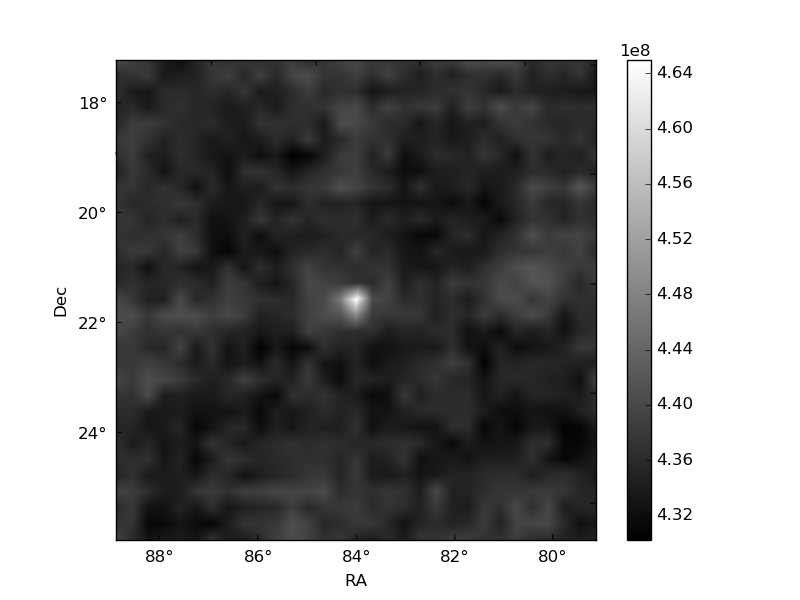
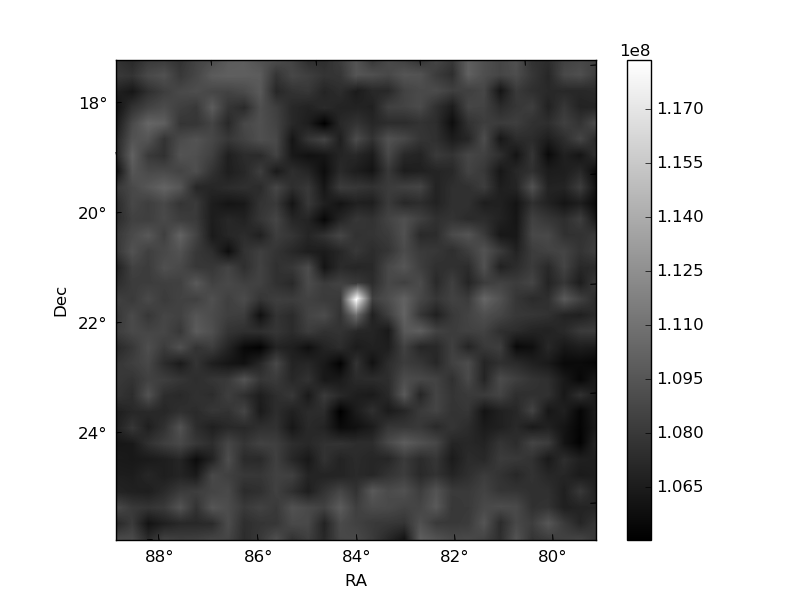
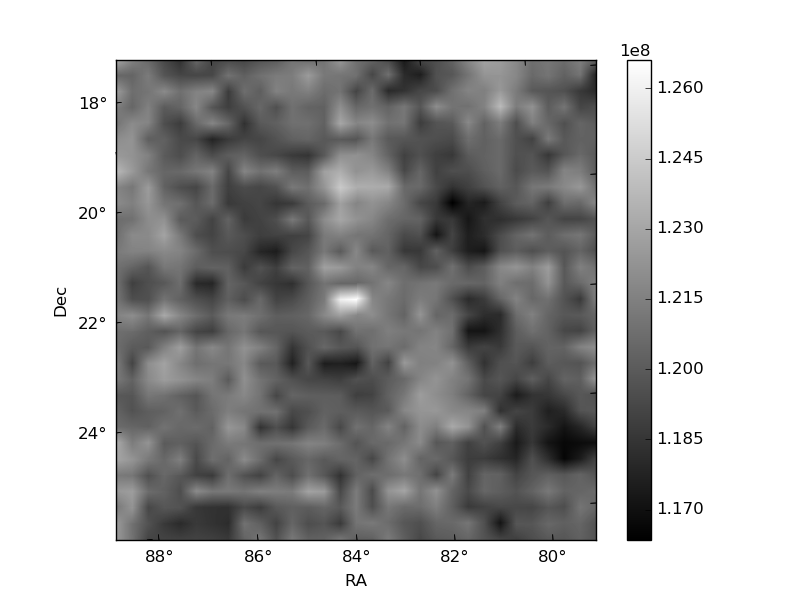
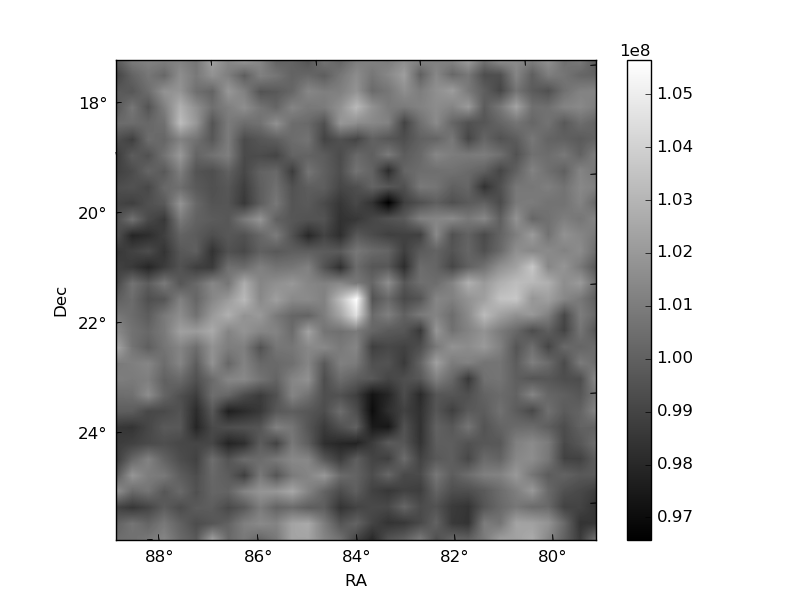
Histogram calculated using DETX and DETY for each event in the final _common_clean file
| Quadrant A | 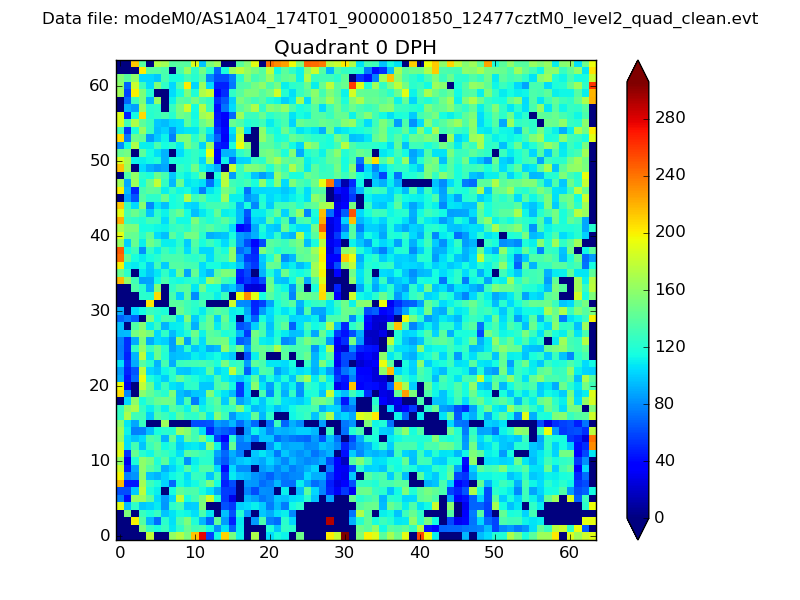 |
 |
Quadrant B |
|---|---|---|---|
| Quadrant D | 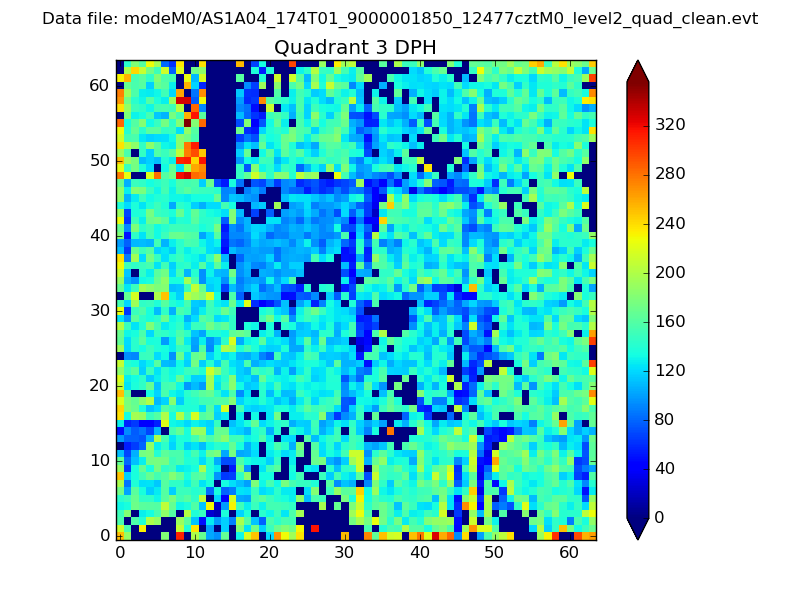 |
 |
Quadrant C |
| Plot type | Count rate plots | Images |
|---|---|---|
| Comparison with Poisson distribution Blue bars denote a histogram of data divided into 1 sec bins. Red curve is a Poisson curve with rate = median count rate of data. |
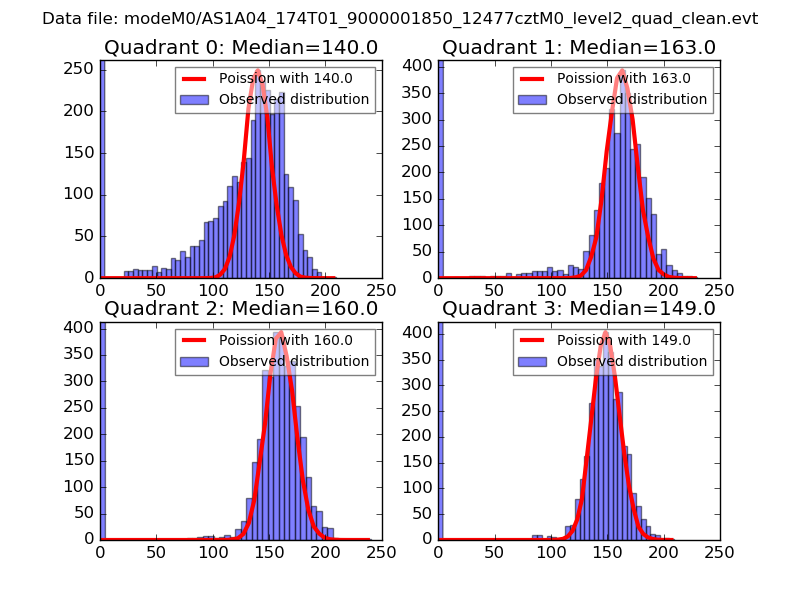 |
 |
| Quadrant-wise count rates Data is divided into 100 sec bins |
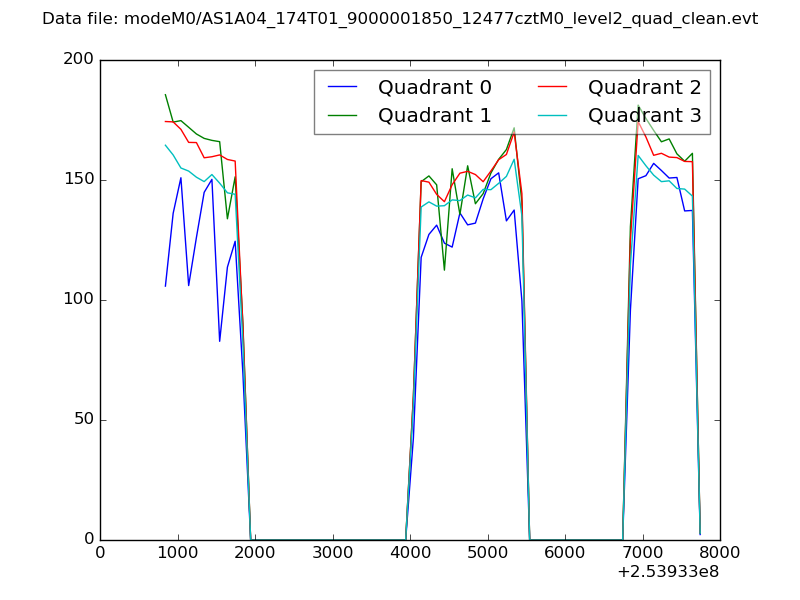 |
|
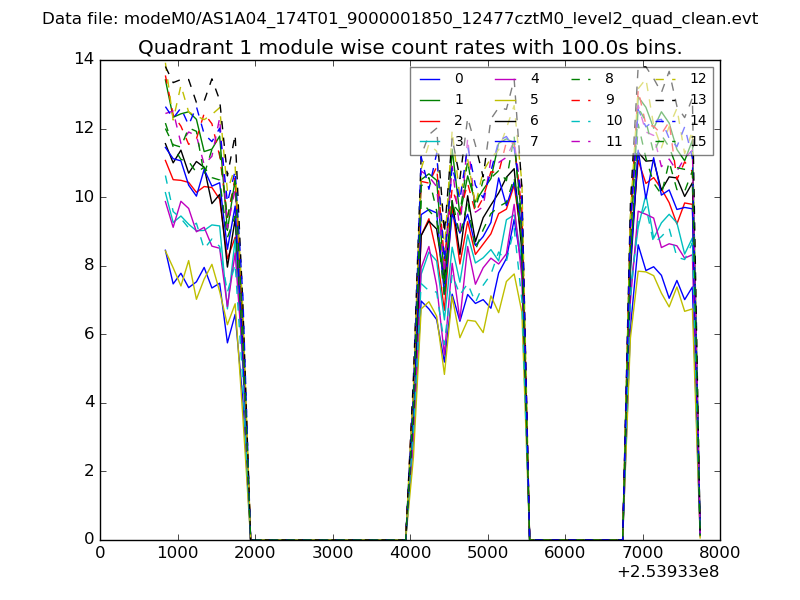
| Module-wise count rates for Quadrant A Data is divided into 100 sec bins |
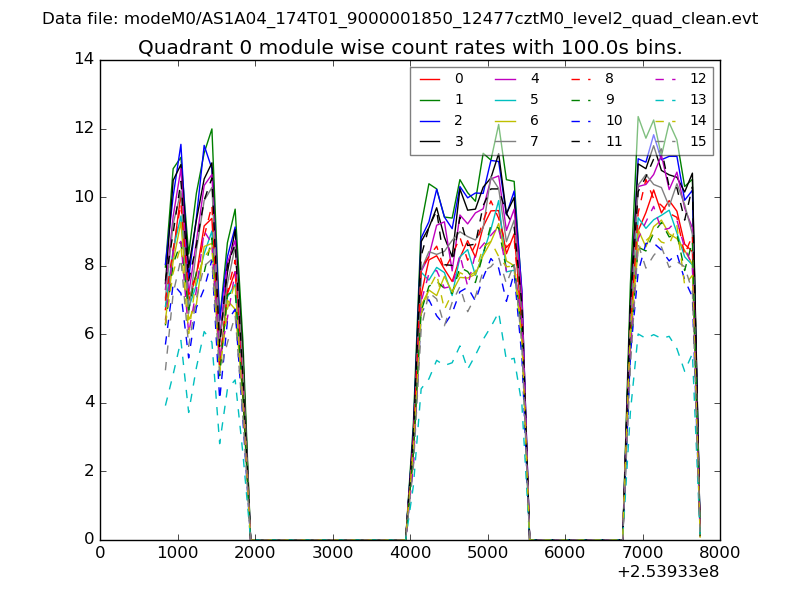 |
 |
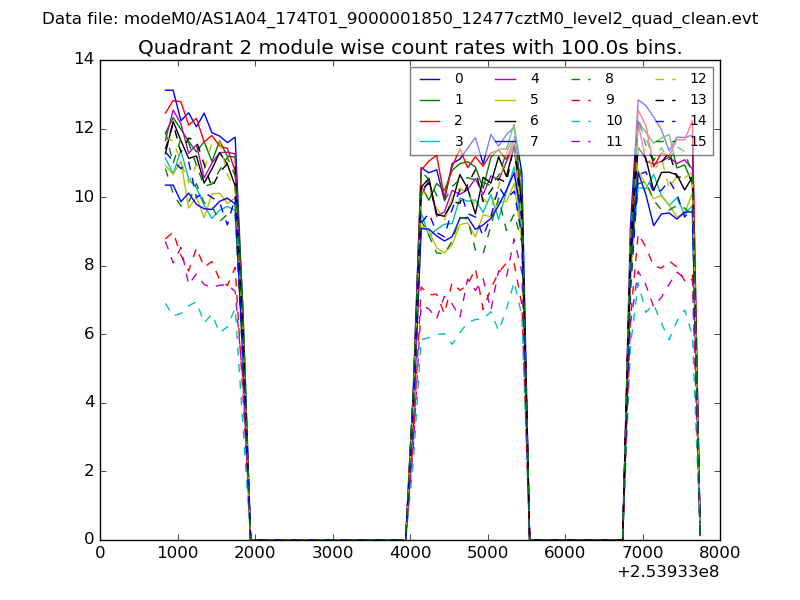
| Module-wise count rates for Quadrant B Data is divided into 100 sec bins |
 |
 |
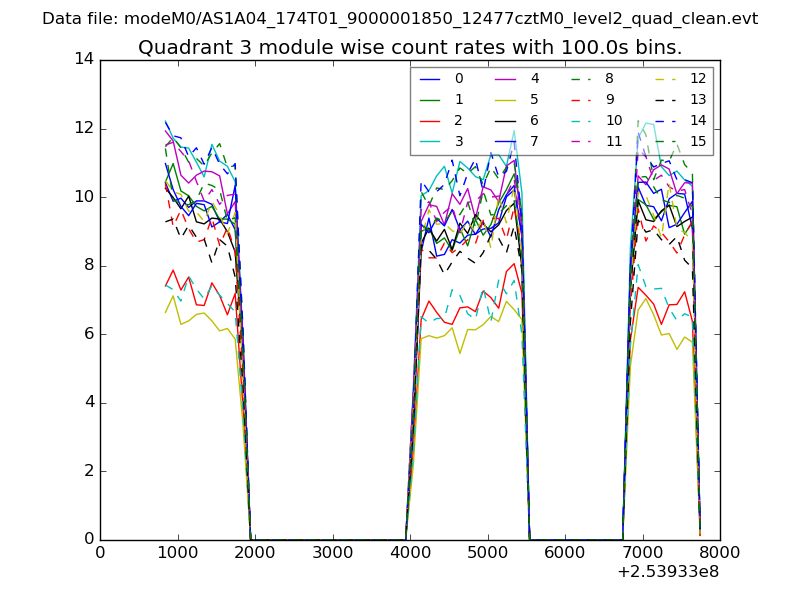
| Module-wise count rates for Quadrant C Data is divided into 100 sec bins |
 |
 |
| Module-wise count rates for Quadrant D Data is divided into 100 sec bins |
 |
 |
| Parameter | Plot |
|---|---|
| CZT HV Monitor | 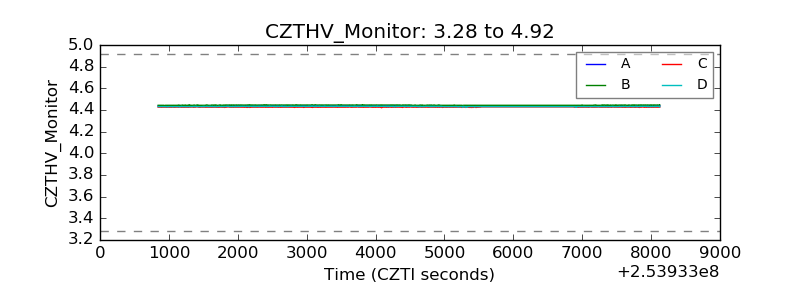 |
| D_VDD | 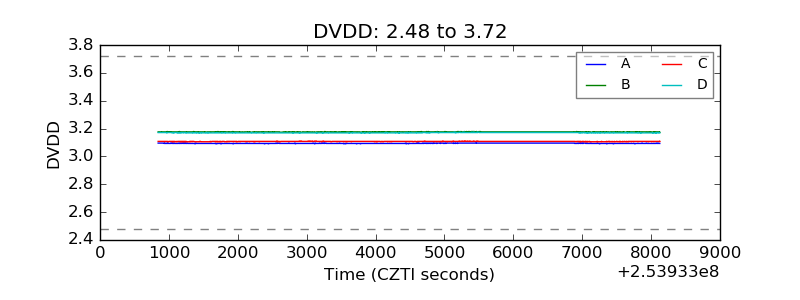 |
| Temperature 1 | 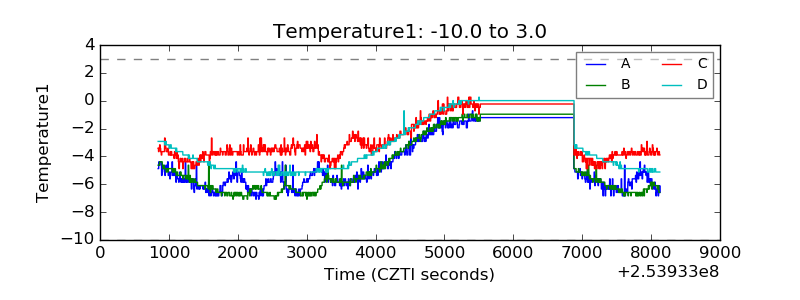 |
| Veto HV Monitor | 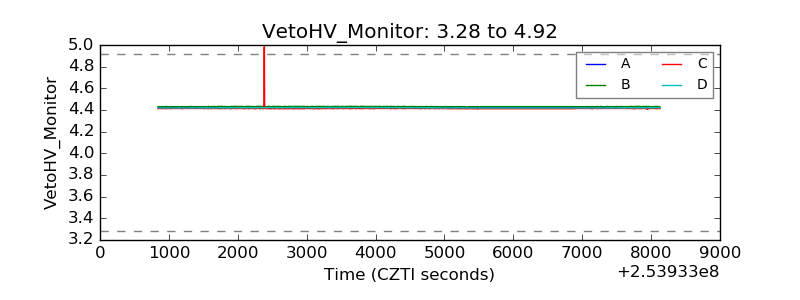 |
| Veto LLD | 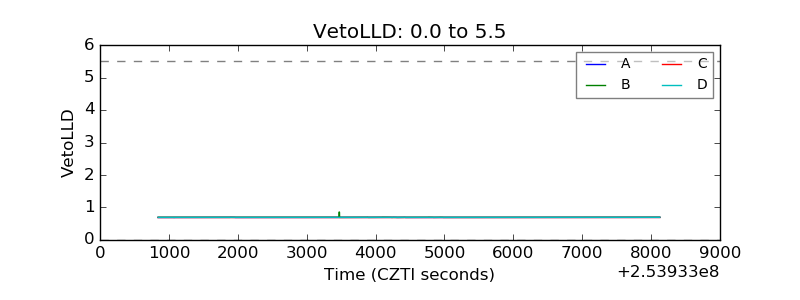 |
| Alpha Counter | 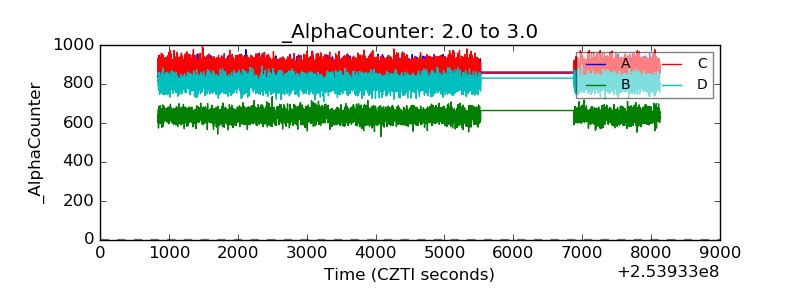 |
| _CPM_Rate | 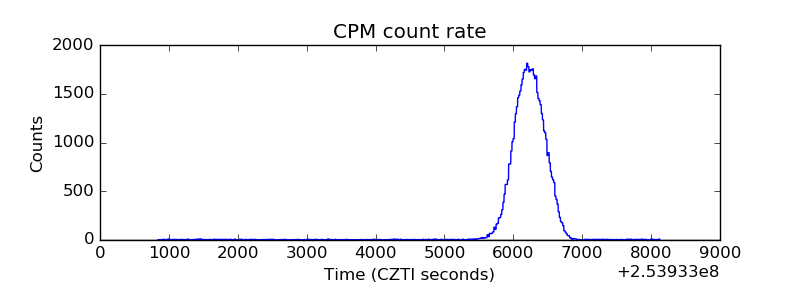 |
| CZT Counter | 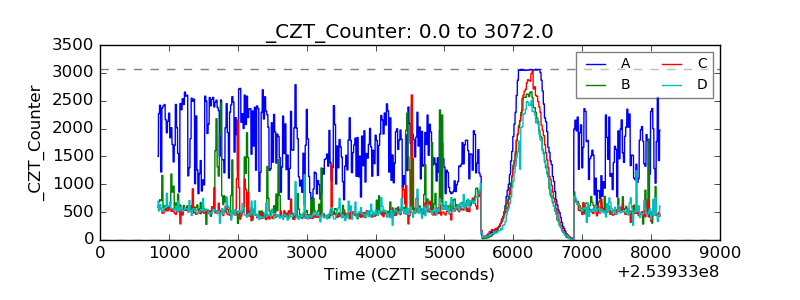 |
| +2.5 Volts monitor | 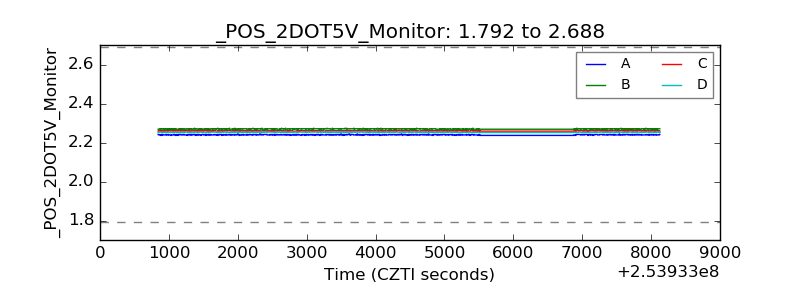 |
| +5 Volts monitor |  |
| _ROLL_ROT | 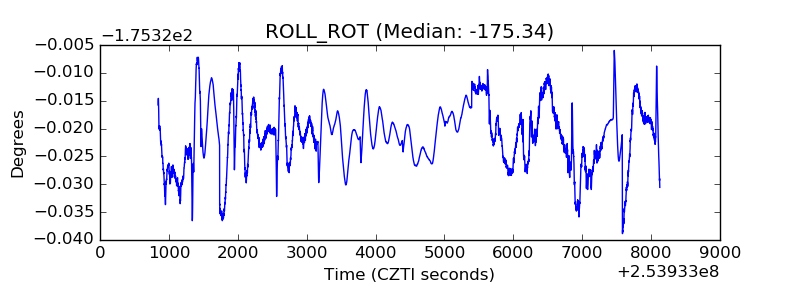 |
| _Roll_DEC | 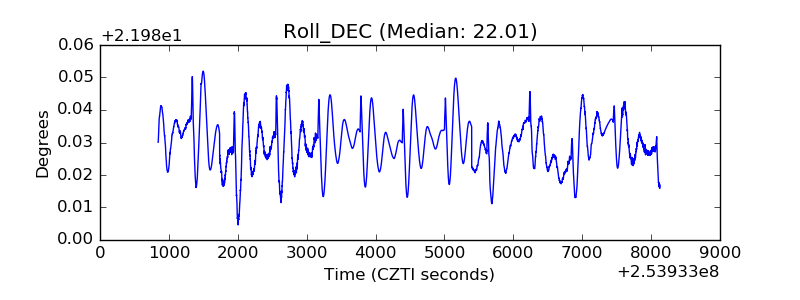 |
| _Roll_RA | 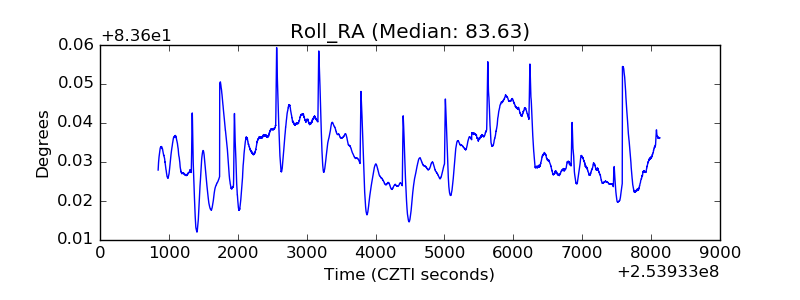 |
| Veto Counter | 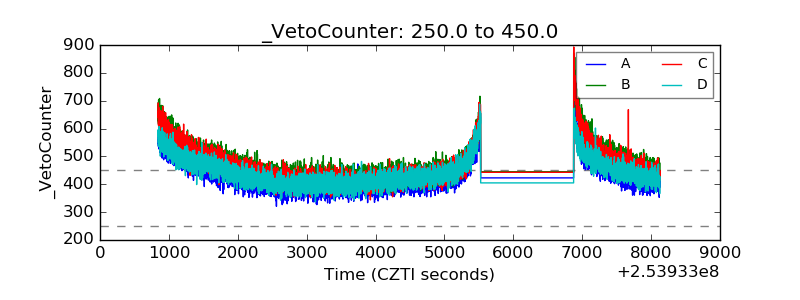 |