| Param | Original file | Final file |
|---|---|---|
| Filename | modeM0/AS1A04_174T01_9000001850_12478cztM0_level2.evt | modeM0/AS1A04_174T01_9000001850_12478cztM0_level2_quad_clean.evt |
| Size (bytes) | 687,384,000 | 80,424,000 |
| Size | 655.5 MB | 76.7 MB |
| Events in quadrant A | 8,733,450 | 469,364 |
| Events in quadrant B | 3,826,949 | 522,827 |
| Events in quadrant C | 3,212,196 | 513,895 |
| Events in quadrant D | 4,599,542 | 469,214 |
| Mode M0 | |||
|---|---|---|---|
| Quadrant | BADHDUFLAG | Total packets | Discarded packets |
| A | 0 | 30627 | 3 |
| B | 0 | 15488 | 2 |
| C | 0 | 13728 | 2 |
| D | 0 | 17869 | 2 |
| Mode M9 | |||
|---|---|---|---|
| Quadrant | BADHDUFLAG | Total packets | Discarded packets |
| A | 0 | 16 | 0 |
| B | 0 | 16 | 0 |
| C | 0 | 16 | 0 |
| D | 0 | 17 | 0 |
| Mode SS | |||
|---|---|---|---|
| Quadrant | BADHDUFLAG | Total packets | Discarded packets |
| A | 0 | 134 | 0 |
| B | 0 | 134 | 0 |
| C | 0 | 134 | 0 |
| D | 0 | 134 | 0 |
| Quadrant | Total seconds | Saturated seconds | Saturation percentage |
|---|---|---|---|
| A | 6569 | 1285 | 19.561577% |
| B | 6593 | 120 | 1.820112% |
| C | 6593 | 27 | 0.409525% |
| D | 6593 | 372 | 5.642348% |
Noise dominated data is calculated using 1-second bins in cleaned event files. If a bin has >2000 counts, and if more than 50% of those come from <1% of pixels, then it is considered to be noise-dominated and hence unusable.
| Quadrant | # 1 sec bins | Bins with >0 counts | Bins with >2000 counts | High rate bins dominated by noise | Noise dominated (total time) | Noise dominated (detector-on time) | Marked lightcurve |
|---|---|---|---|---|---|---|---|
| A | 7789 | 6572 | 737 | 737 | 9.46% | 11.21% | 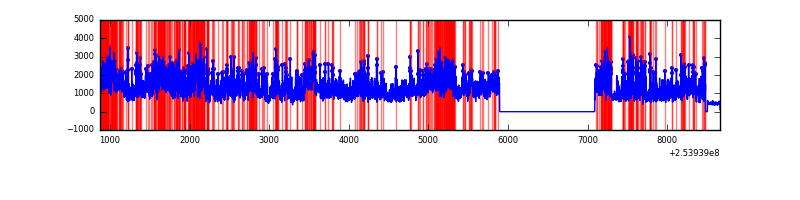 |
| B | 7789 | 6595 | 59 | 59 | 0.76% | 0.89% | 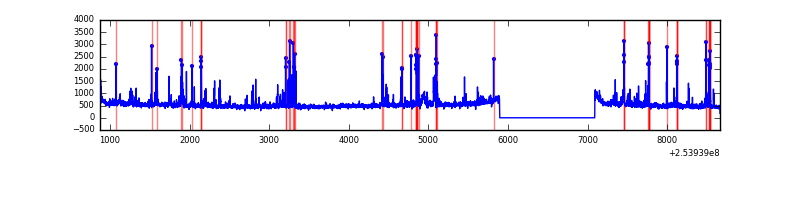 |
| C | 7789 | 6595 | 10 | 10 | 0.13% | 0.15% | 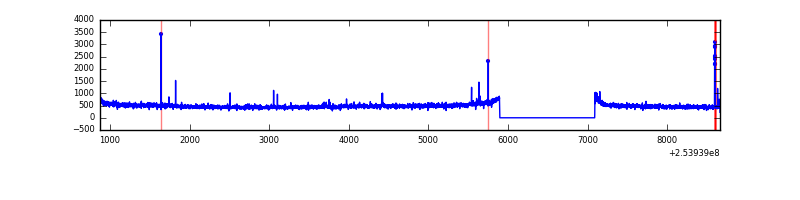 |
| D | 7789 | 6595 | 372 | 372 | 4.78% | 5.64% | 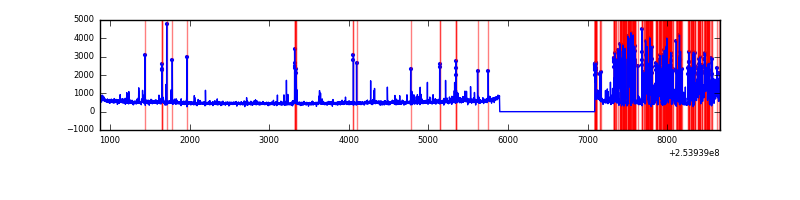 |
Top three noisy pixels from each quadrant. If the there are fewer than three noisy pixels in the level2.evt file, extra rows are filled as -1
| Pixel properties | Quadrant properties | ||||||
|---|---|---|---|---|---|---|---|
| Quadrant | DetID | PixID | Counts | Sigma | Mean | Median | Sigma |
| A | 13 | 251 | 5301000 | 33149.25 | 783 | 769 | 159.9 |
| A | 0 | 23 | 154299 | 960.22 | 783 | 769 | 159.9 |
| A | 1 | 162 | 74609 | 461.82 | 783 | 769 | 159.9 |
| B | 4 | 239 | 368292 | 2314.39 | 834 | 815 | 158.8 |
| B | 0 | 85 | 98494 | 615.19 | 834 | 815 | 158.8 |
| B | 0 | 187 | 33879 | 208.24 | 834 | 815 | 158.8 |
| C | 15 | 208 | 28952 | 149.74 | 810 | 819 | 187.9 |
| C | 7 | 238 | 24012 | 123.45 | 810 | 819 | 187.9 |
| C | 13 | 61 | 5803 | 26.53 | 810 | 819 | 187.9 |
| D | 1 | 52 | 1471370 | 7840.34 | 776 | 756 | 187.6 |
| D | 13 | 104 | 66932 | 352.81 | 776 | 756 | 187.6 |
| D | 13 | 249 | 29923 | 155.5 | 776 | 756 | 187.6 |
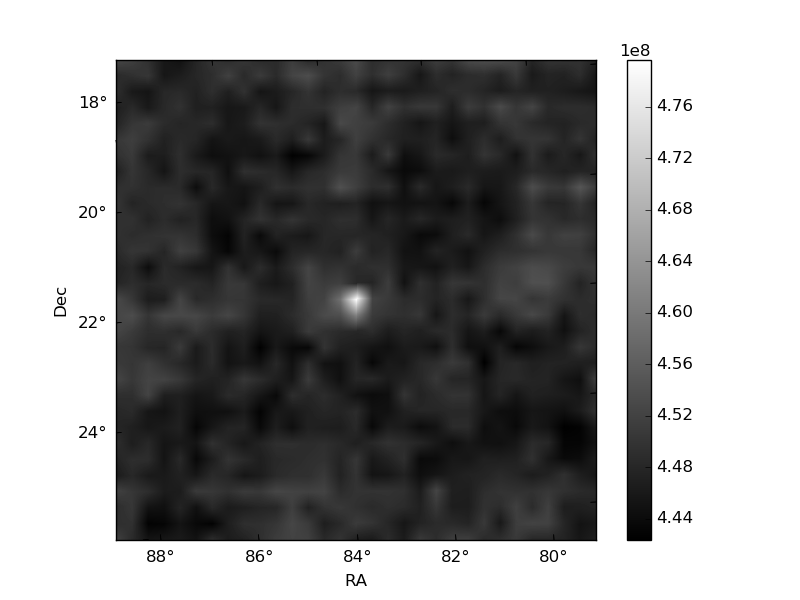
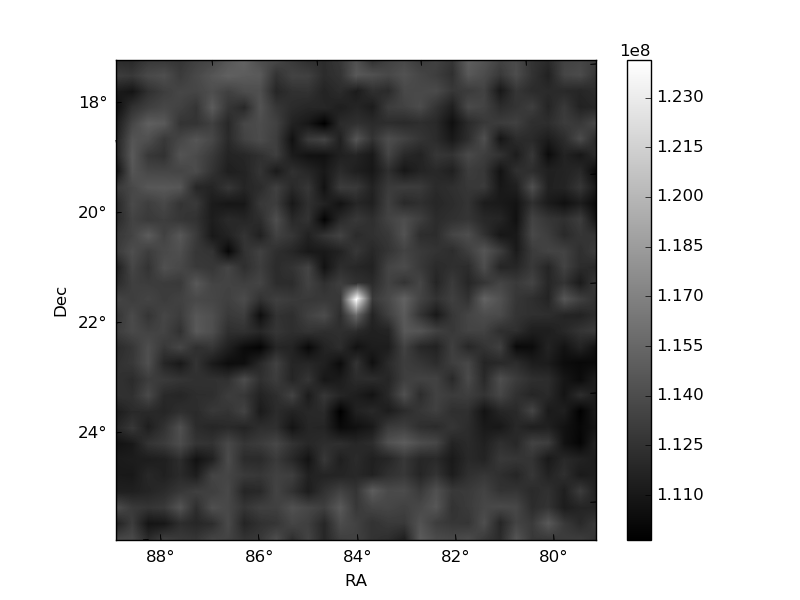
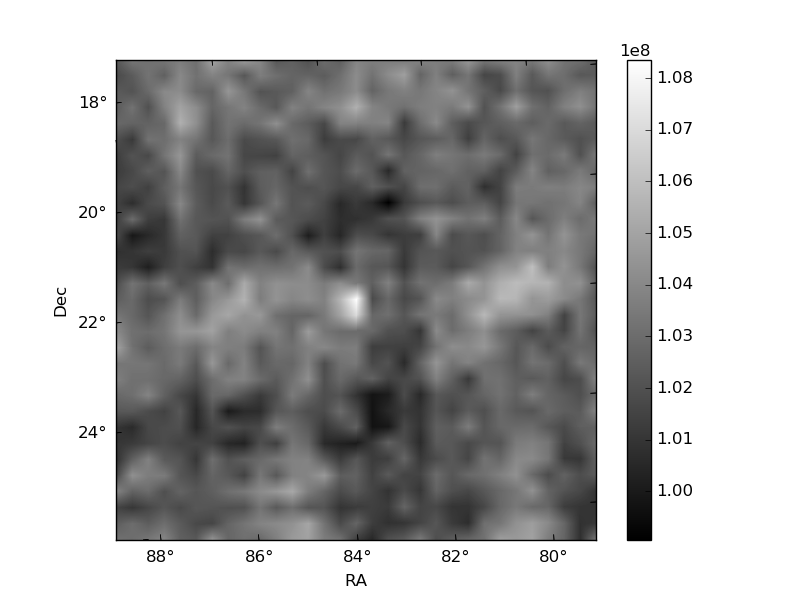
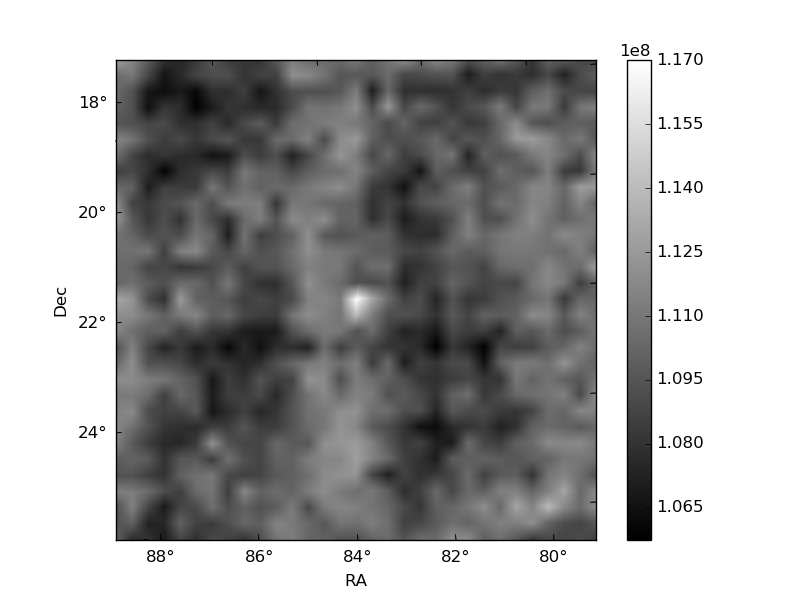
Histogram calculated using DETX and DETY for each event in the final _common_clean file
| Quadrant A | 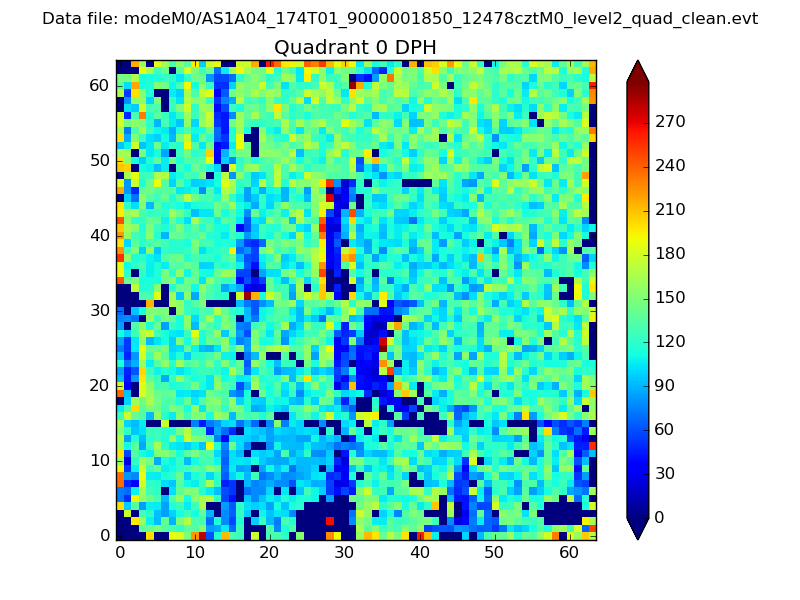 |
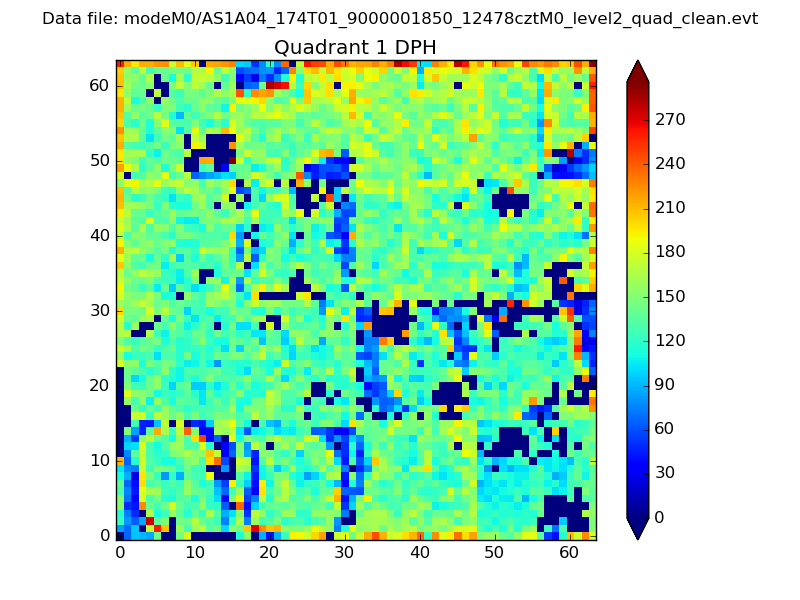 |
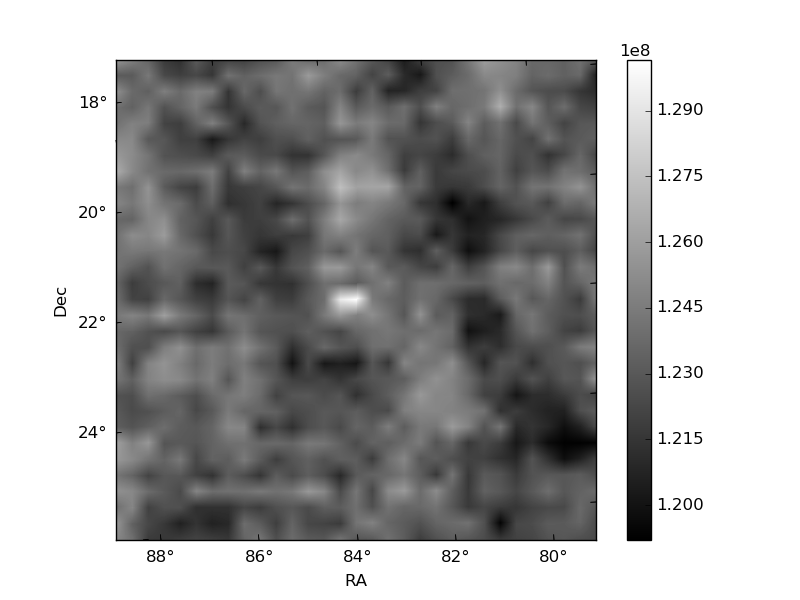
Quadrant B |
|---|---|---|---|
| Quadrant D | 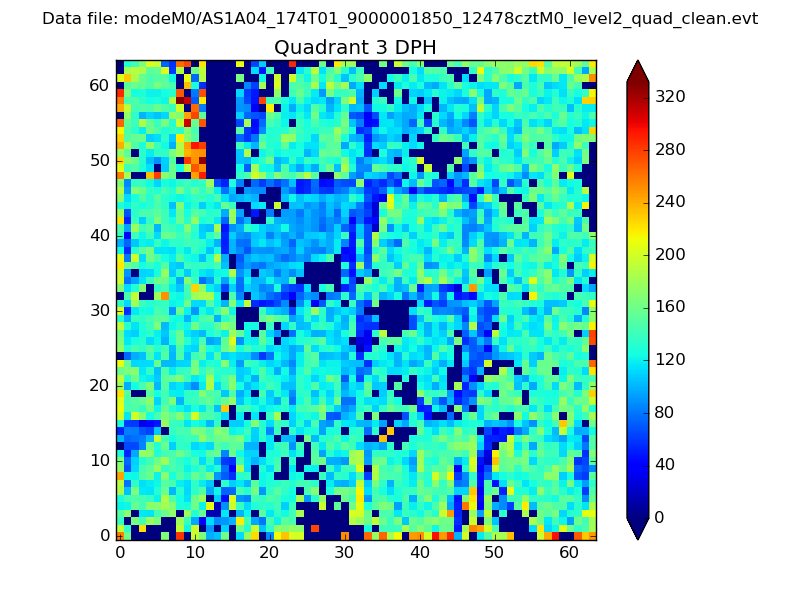 |
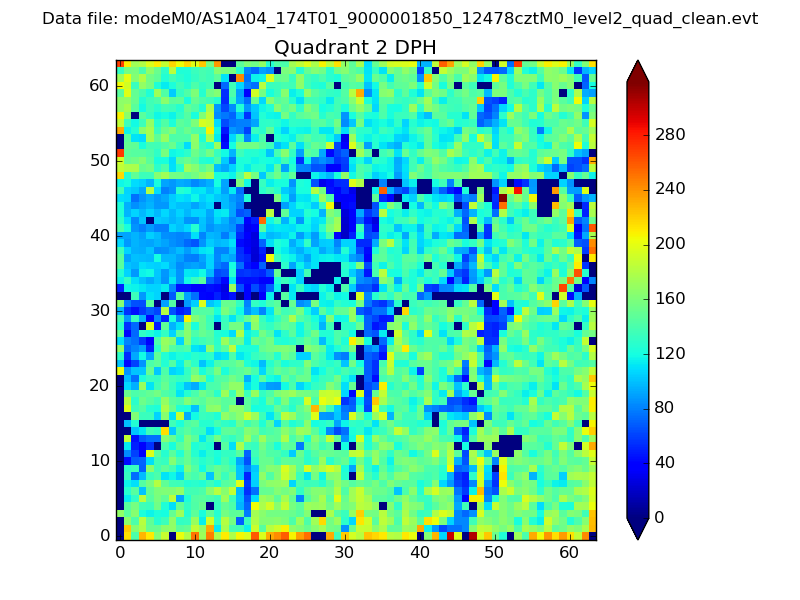 |
Quadrant C |
| Plot type | Count rate plots | Images |
|---|---|---|
| Comparison with Poisson distribution Blue bars denote a histogram of data divided into 1 sec bins. Red curve is a Poisson curve with rate = median count rate of data. |
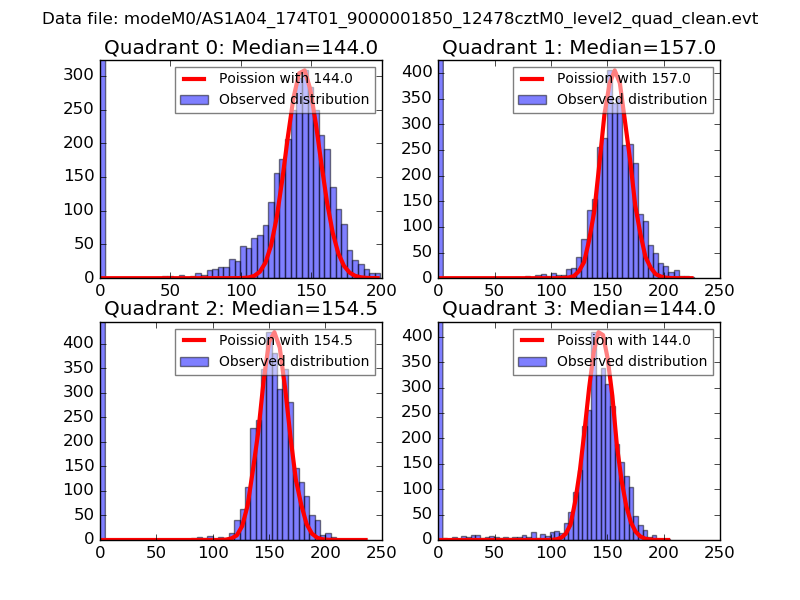 |
 |
| Quadrant-wise count rates Data is divided into 100 sec bins |
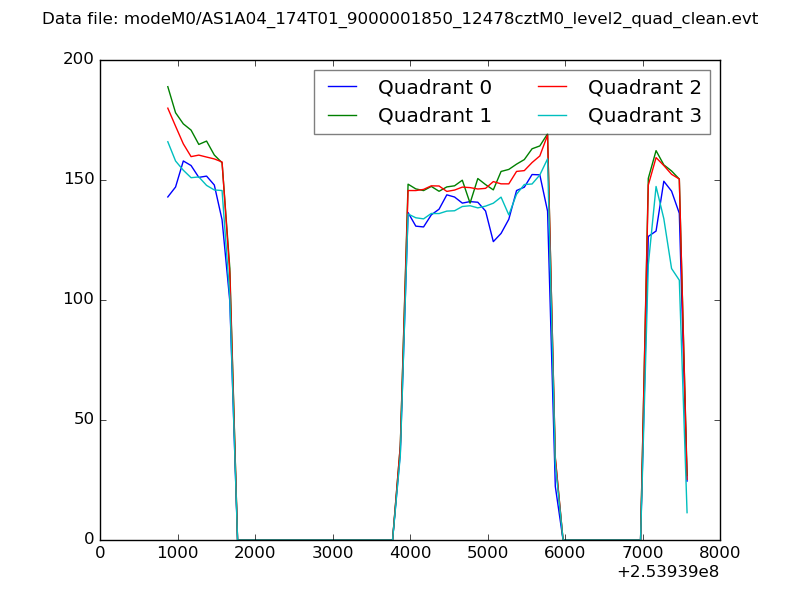 |
|
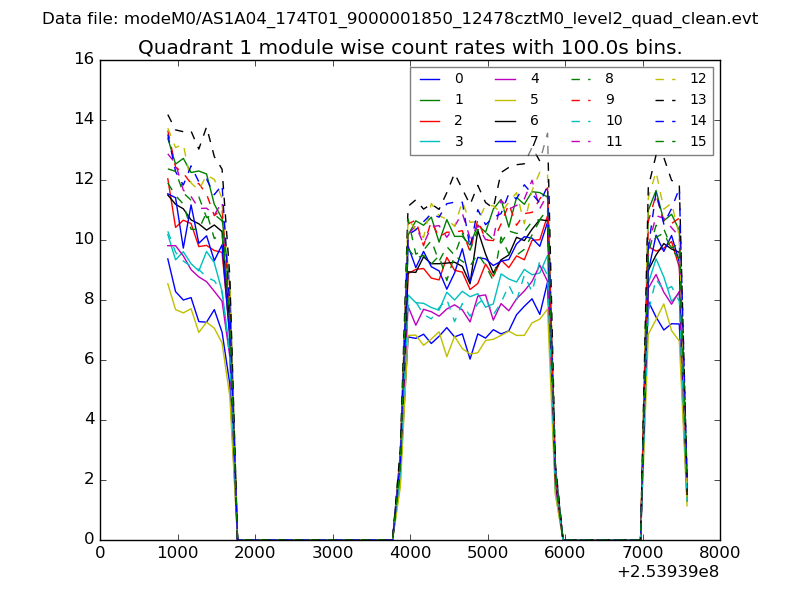
| Module-wise count rates for Quadrant A Data is divided into 100 sec bins |
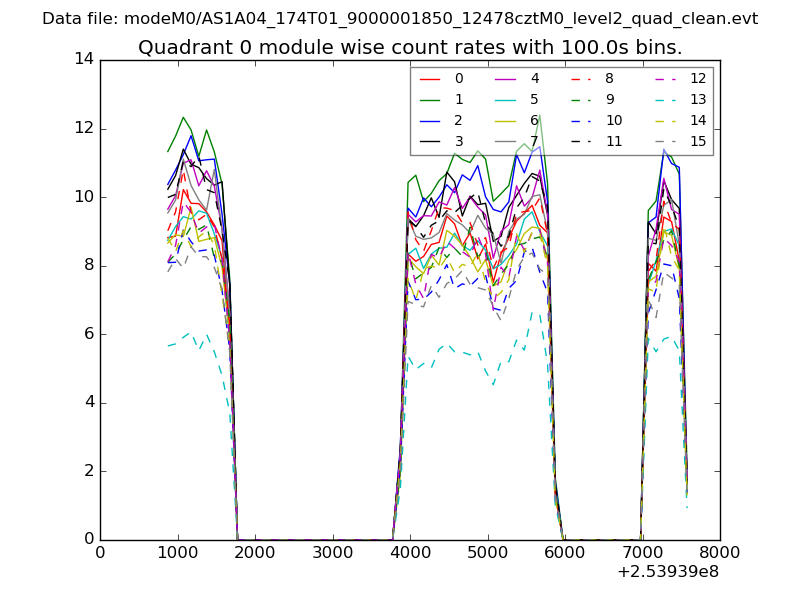 |
 |
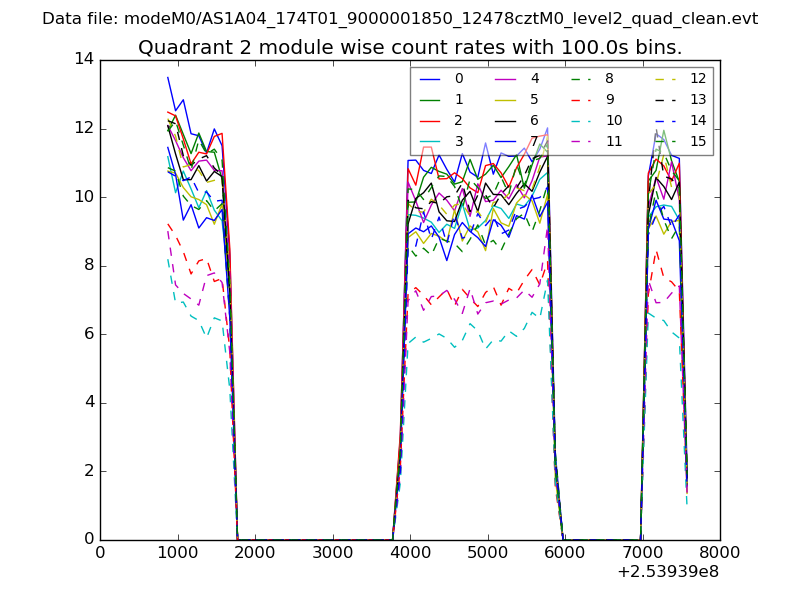
| Module-wise count rates for Quadrant B Data is divided into 100 sec bins |
 |
 |
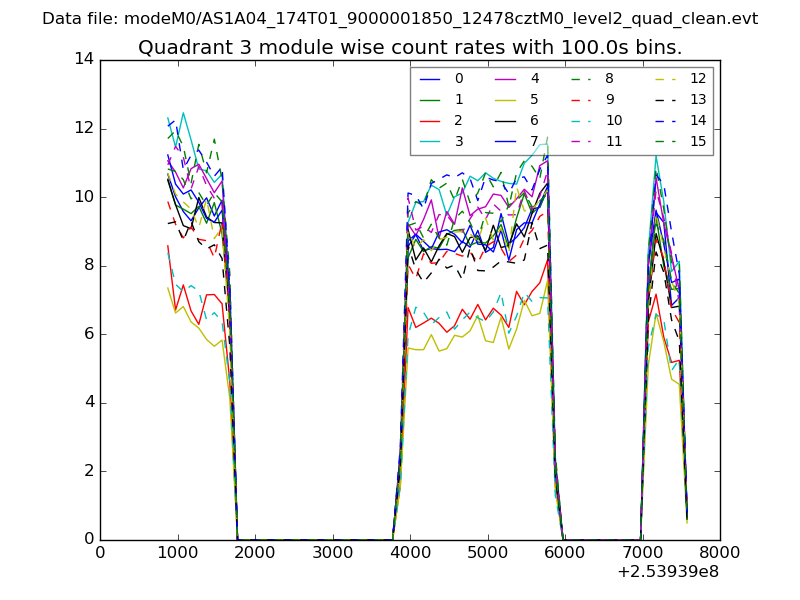
| Module-wise count rates for Quadrant C Data is divided into 100 sec bins |
 |
 |
| Module-wise count rates for Quadrant D Data is divided into 100 sec bins |
 |
 |
| Parameter | Plot |
|---|---|
| CZT HV Monitor | 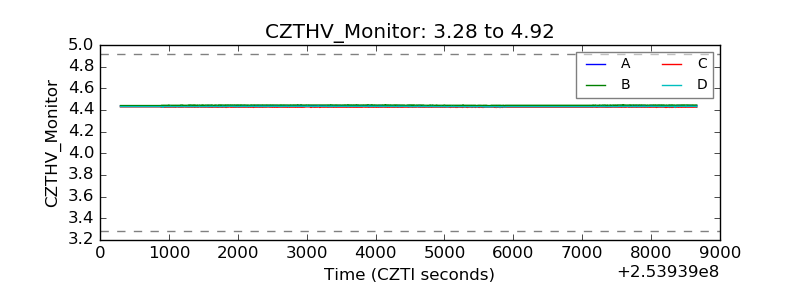 |
| D_VDD | 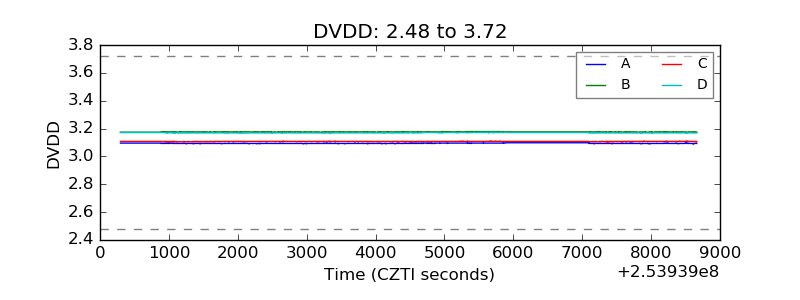 |
| Temperature 1 |  |
| Veto HV Monitor | 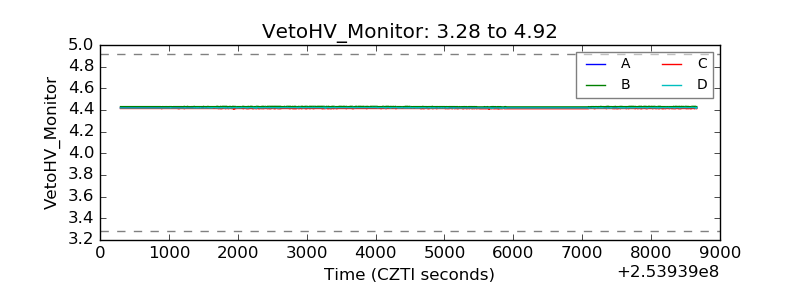 |
| Veto LLD | 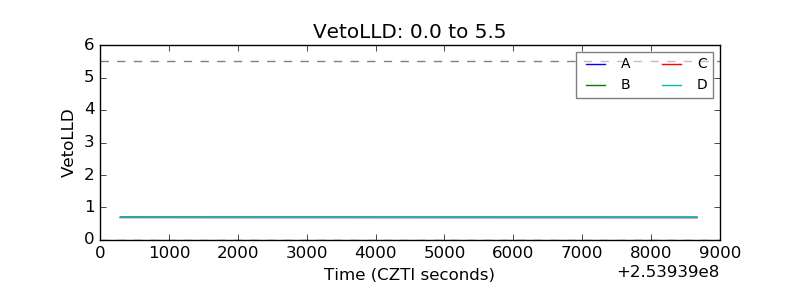 |
| Alpha Counter | 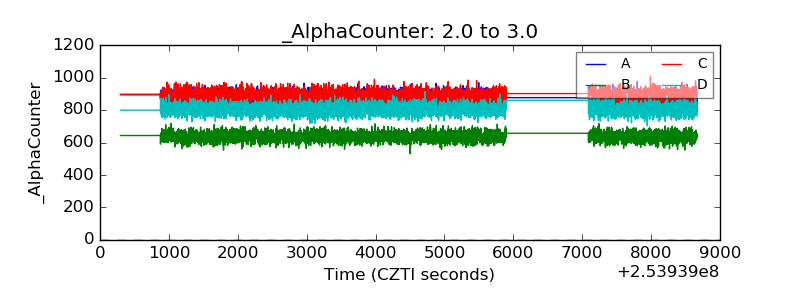 |
| _CPM_Rate | 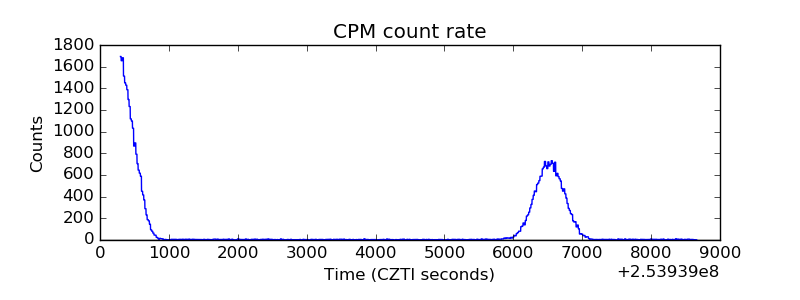 |
| CZT Counter | 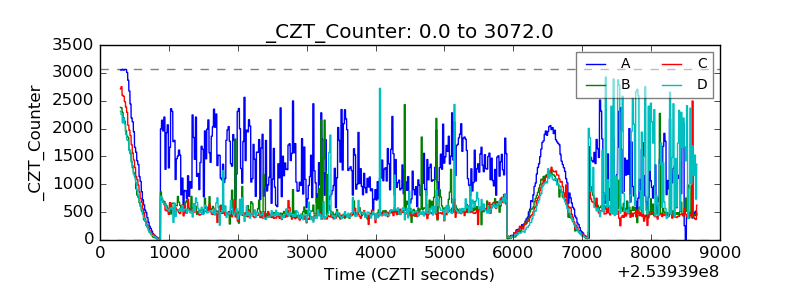 |
| +2.5 Volts monitor |  |
| +5 Volts monitor |  |
| _ROLL_ROT | 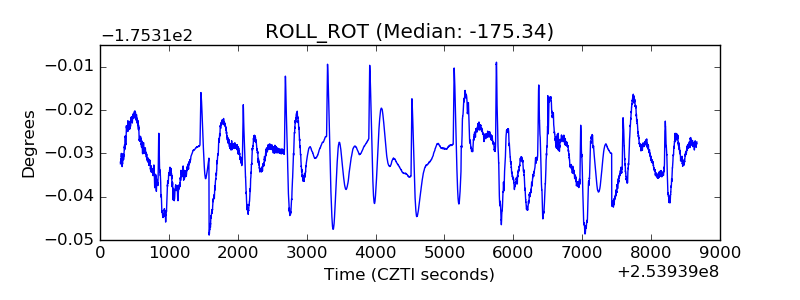 |
| _Roll_DEC | 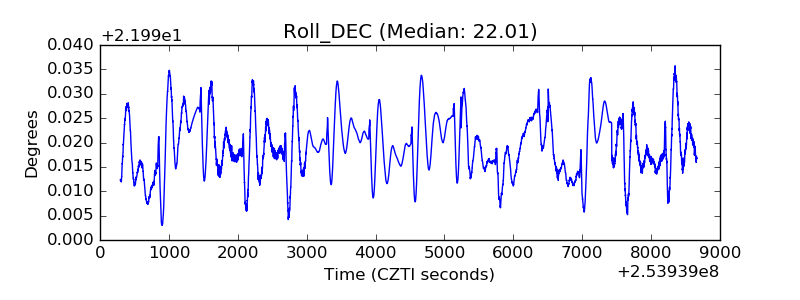 |
| _Roll_RA | 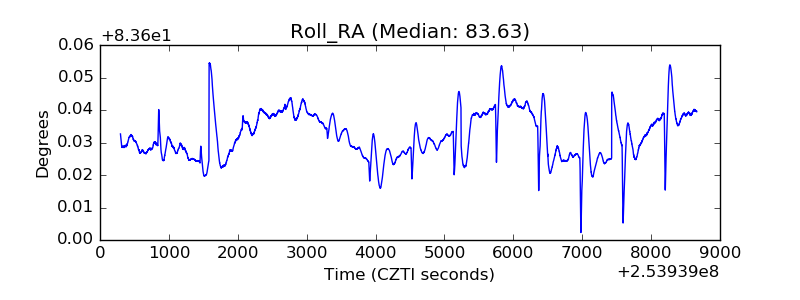 |
| Veto Counter | 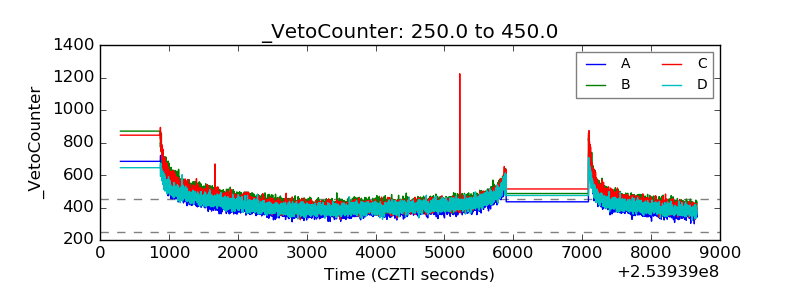 |