| Param | Original file | Final file |
|---|---|---|
| Filename | modeM0/AS1A04_174T01_9000001850_12479cztM0_level2.evt | modeM0/AS1A04_174T01_9000001850_12479cztM0_level2_quad_clean.evt |
| Size (bytes) | 662,788,800 | 68,097,600 |
| Size | 632.1 MB | 64.9 MB |
| Events in quadrant A | 4,271,439 | 414,765 |
| Events in quadrant B | 3,711,038 | 423,322 |
| Events in quadrant C | 3,071,125 | 421,824 |
| Events in quadrant D | 8,577,533 | 346,307 |
| Mode M0 | |||
|---|---|---|---|
| Quadrant | BADHDUFLAG | Total packets | Discarded packets |
| A | 0 | 16877 | 2 |
| B | 0 | 15132 | 1 |
| C | 0 | 13454 | 1 |
| D | 0 | 29958 | 1 |
| Mode M9 | |||
|---|---|---|---|
| Quadrant | BADHDUFLAG | Total packets | Discarded packets |
| A | 0 | 9 | 0 |
| B | 0 | 9 | 0 |
| C | 0 | 9 | 0 |
| D | 0 | 9 | 0 |
| Mode SS | |||
|---|---|---|---|
| Quadrant | BADHDUFLAG | Total packets | Discarded packets |
| A | 0 | 132 | 0 |
| B | 0 | 132 | 0 |
| C | 0 | 132 | 0 |
| D | 0 | 132 | 0 |
| Quadrant | Total seconds | Saturated seconds | Saturation percentage |
|---|---|---|---|
| A | 6513 | 190 | 2.917242% |
| B | 6537 | 161 | 2.462903% |
| C | 6537 | 39 | 0.596604% |
| D | 6537 | 1662 | 25.424507% |
Noise dominated data is calculated using 1-second bins in cleaned event files. If a bin has >2000 counts, and if more than 50% of those come from <1% of pixels, then it is considered to be noise-dominated and hence unusable.
| Quadrant | # 1 sec bins | Bins with >0 counts | Bins with >2000 counts | High rate bins dominated by noise | Noise dominated (total time) | Noise dominated (detector-on time) | Marked lightcurve |
|---|---|---|---|---|---|---|---|
| A | 7403 | 6516 | 92 | 92 | 1.24% | 1.41% | 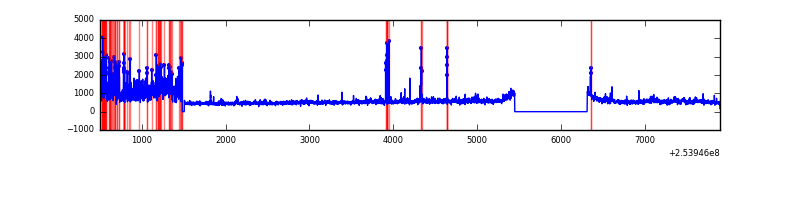 |
| B | 7403 | 6539 | 53 | 53 | 0.72% | 0.81% |  |
| C | 7403 | 6539 | 8 | 8 | 0.11% | 0.12% | 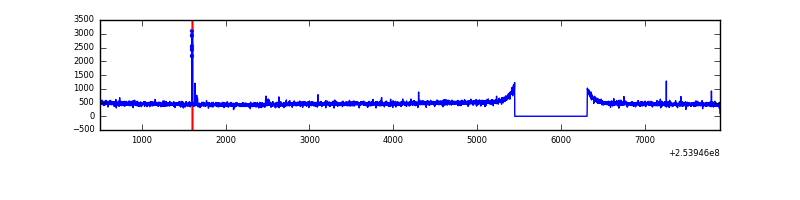 |
| D | 7403 | 6539 | 1585 | 1585 | 21.41% | 24.24% | 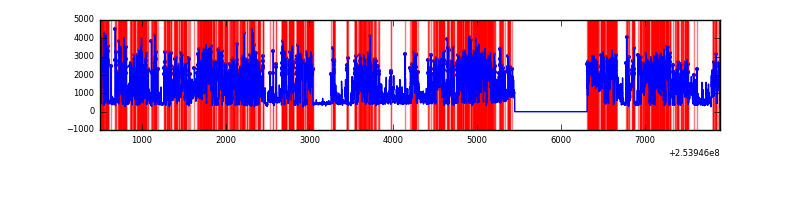 |
Top three noisy pixels from each quadrant. If the there are fewer than three noisy pixels in the level2.evt file, extra rows are filled as -1
| Pixel properties | Quadrant properties | ||||||
|---|---|---|---|---|---|---|---|
| Quadrant | DetID | PixID | Counts | Sigma | Mean | Median | Sigma |
| A | 13 | 251 | 735290 | 4553.78 | 790 | 775 | 161.3 |
| A | 0 | 23 | 121712 | 749.77 | 790 | 775 | 161.3 |
| A | 1 | 162 | 88923 | 546.49 | 790 | 775 | 161.3 |
| B | 4 | 239 | 345804 | 2219.93 | 801 | 781 | 155.4 |
| B | 0 | 85 | 165659 | 1060.85 | 801 | 781 | 155.4 |
| B | 0 | 214 | 35024 | 220.32 | 801 | 781 | 155.4 |
| C | 7 | 238 | 27777 | 147.77 | 781 | 788 | 182.6 |
| C | 13 | 61 | 5710 | 26.95 | 781 | 788 | 182.6 |
| C | 3 | 202 | 1897 | 6.07 | 781 | 788 | 182.6 |
| D | 1 | 52 | 5839347 | 34512.36 | 703 | 685 | 169.2 |
| D | 13 | 249 | 26241 | 151.06 | 703 | 685 | 169.2 |
| D | 2 | 234 | 21488 | 122.97 | 703 | 685 | 169.2 |
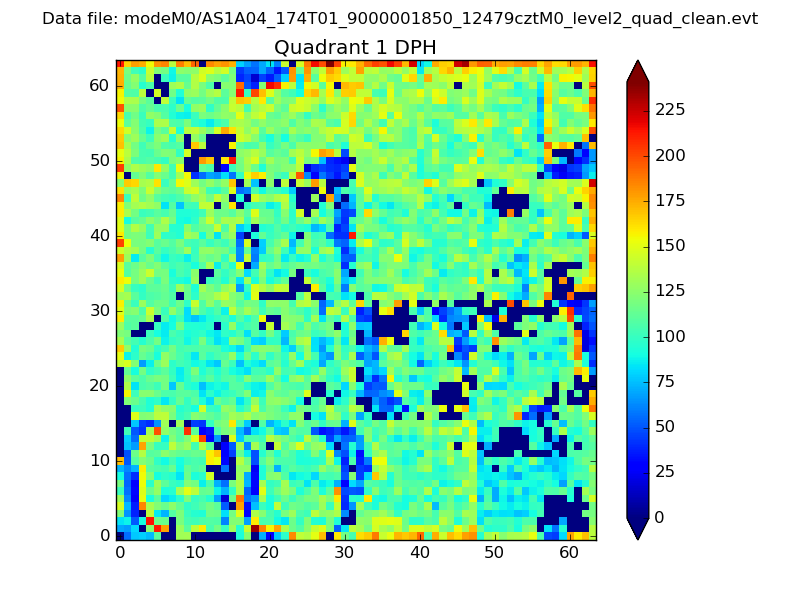
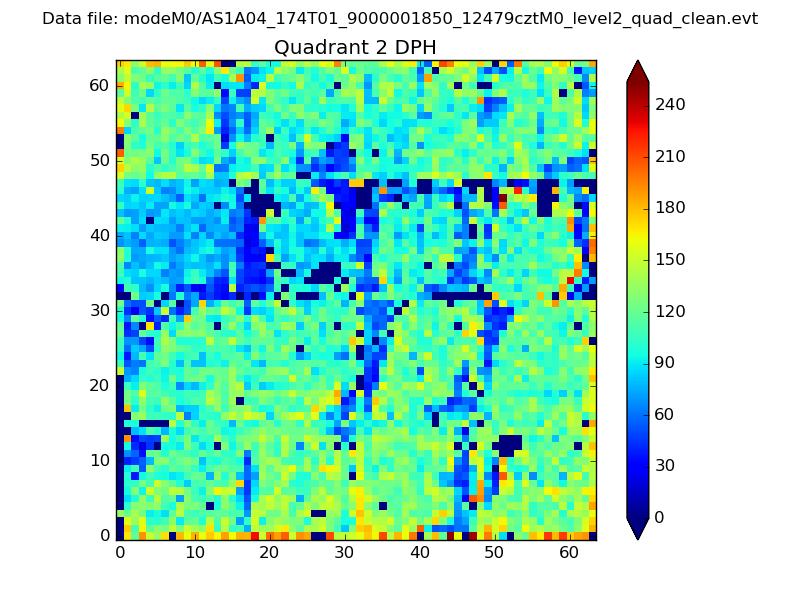
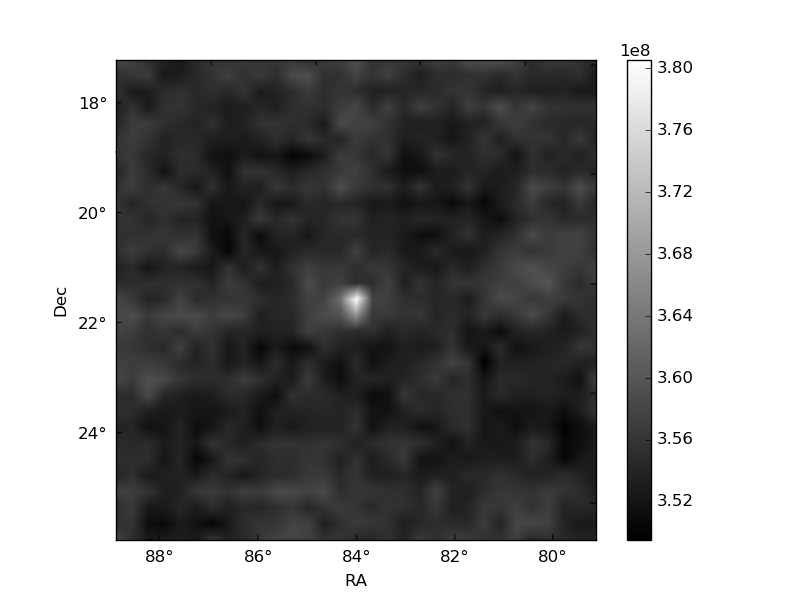
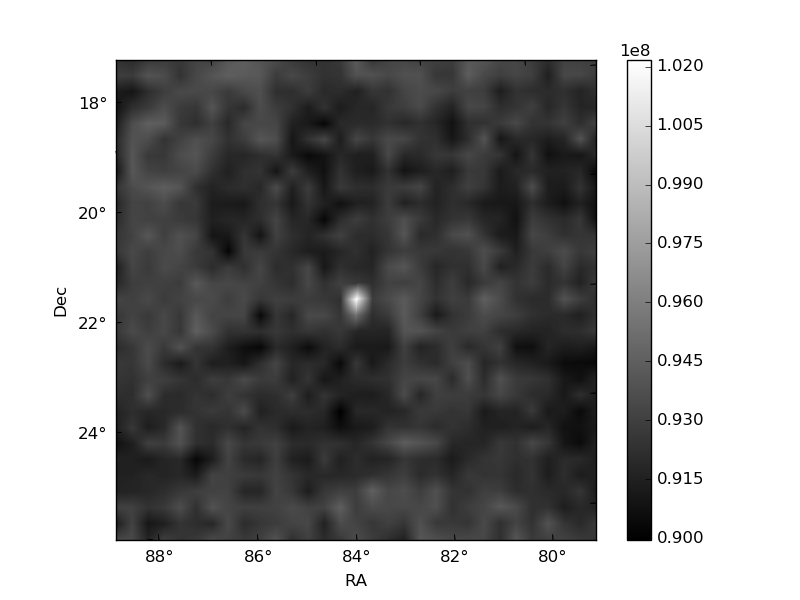
Histogram calculated using DETX and DETY for each event in the final _common_clean file
| Quadrant A | 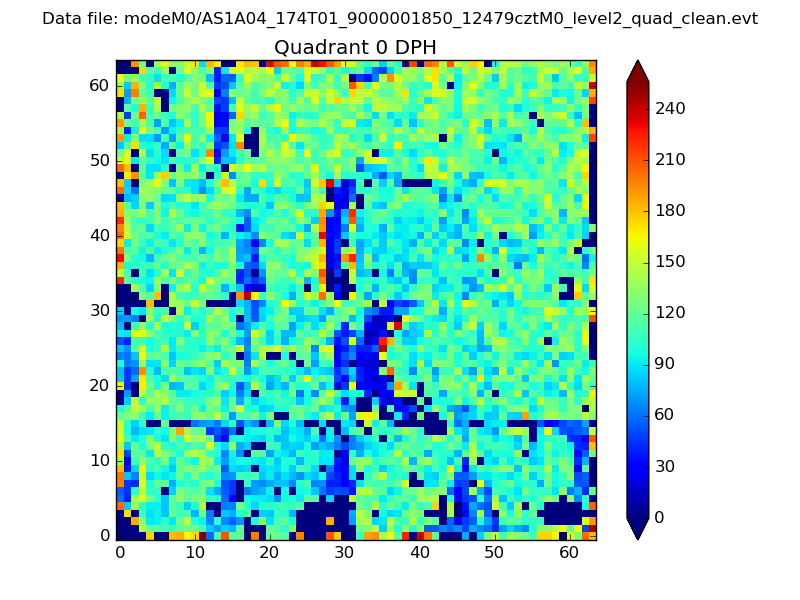 |
 |
Quadrant B |
|---|---|---|---|
| Quadrant D | 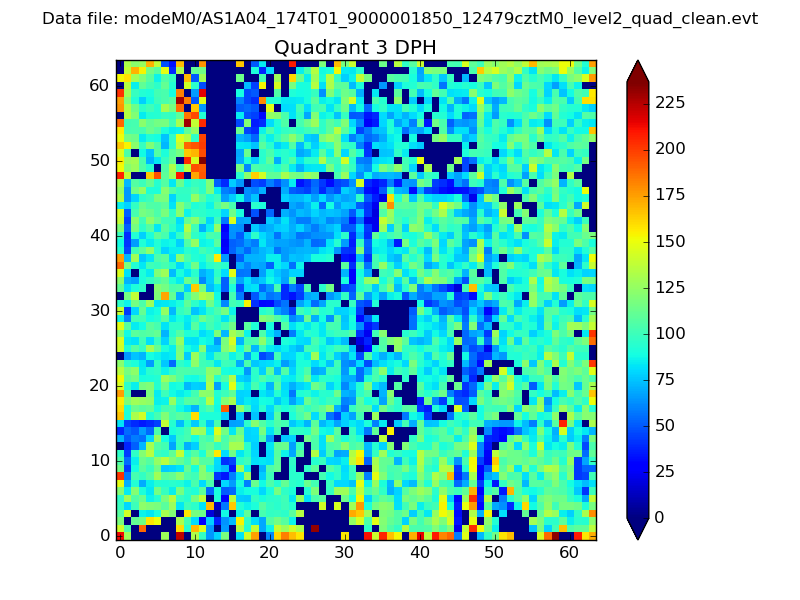 |
 |
Quadrant C |
| Plot type | Count rate plots | Images |
|---|---|---|
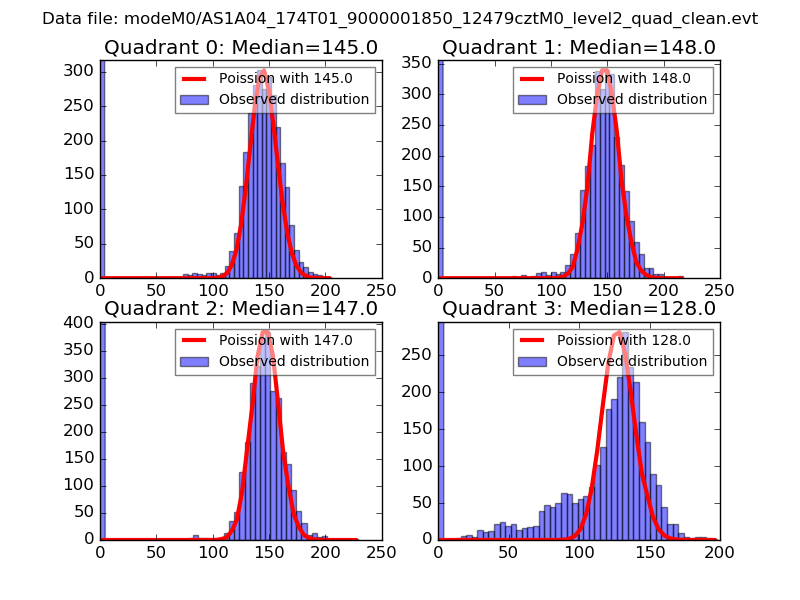
| Comparison with Poisson distribution Blue bars denote a histogram of data divided into 1 sec bins. Red curve is a Poisson curve with rate = median count rate of data. |
 |
 |
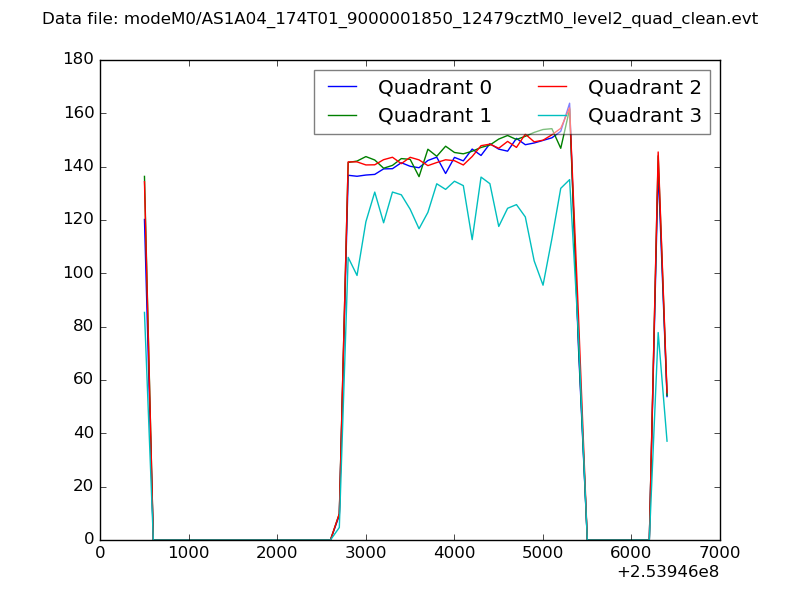
| Quadrant-wise count rates Data is divided into 100 sec bins |
 |
|
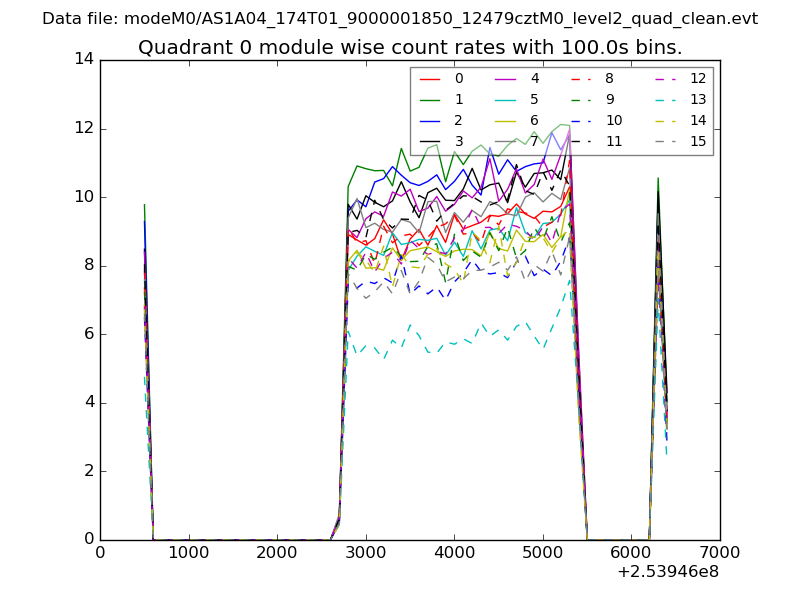
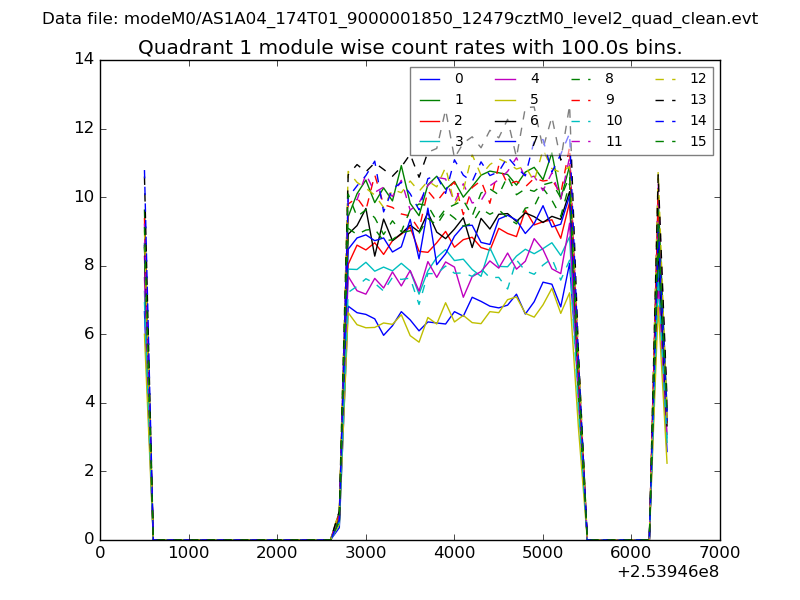
| Module-wise count rates for Quadrant A Data is divided into 100 sec bins |
 |
 |
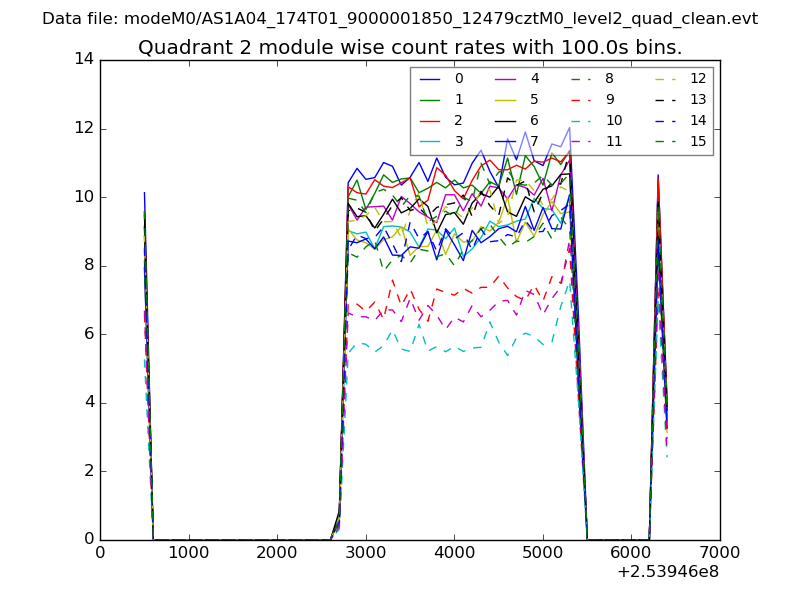
| Module-wise count rates for Quadrant B Data is divided into 100 sec bins |
 |
 |
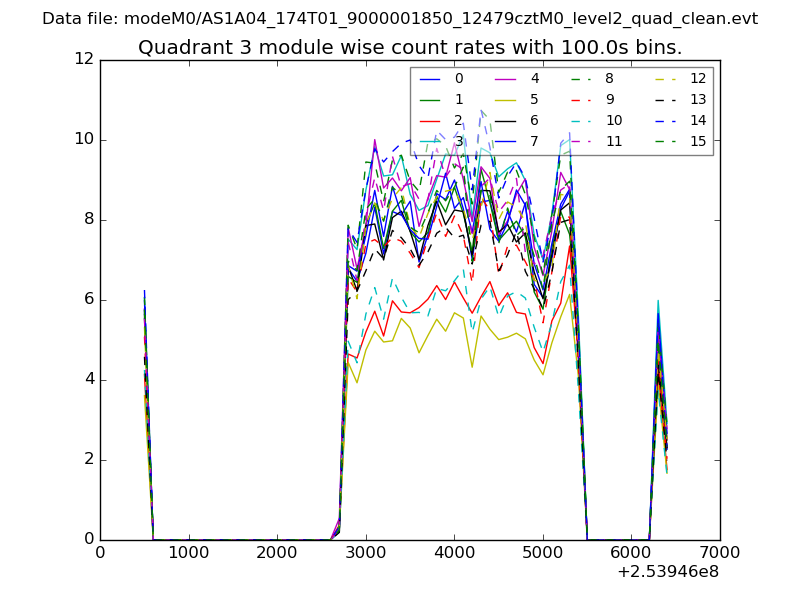
| Module-wise count rates for Quadrant C Data is divided into 100 sec bins |
 |
 |
| Module-wise count rates for Quadrant D Data is divided into 100 sec bins |
 |
 |
| Parameter | Plot |
|---|---|
| CZT HV Monitor | 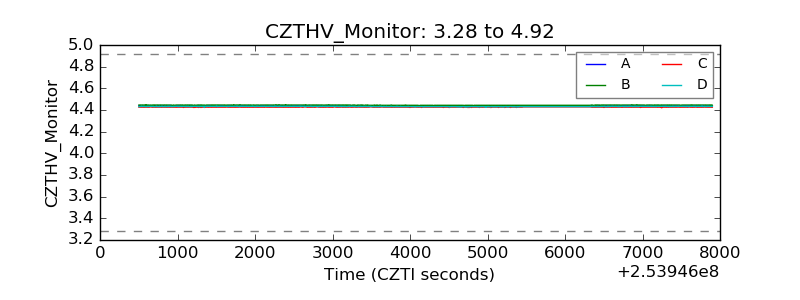 |
| D_VDD | 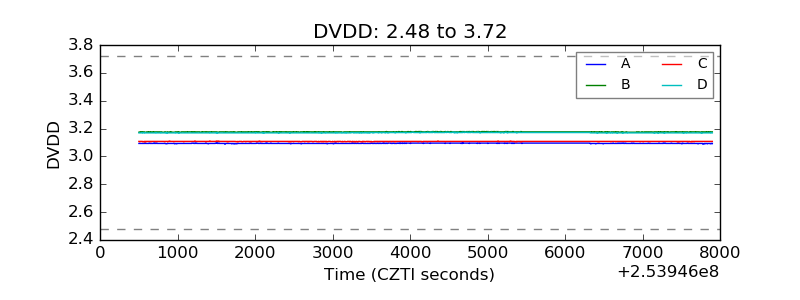 |
| Temperature 1 | 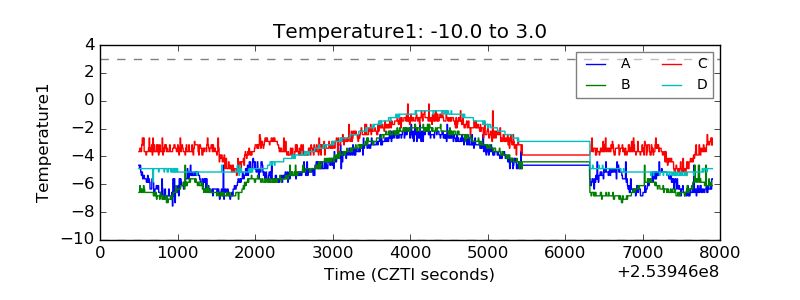 |
| Veto HV Monitor | 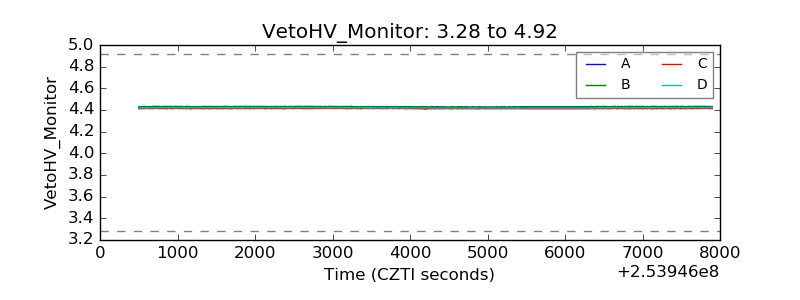 |
| Veto LLD |  |
| Alpha Counter | 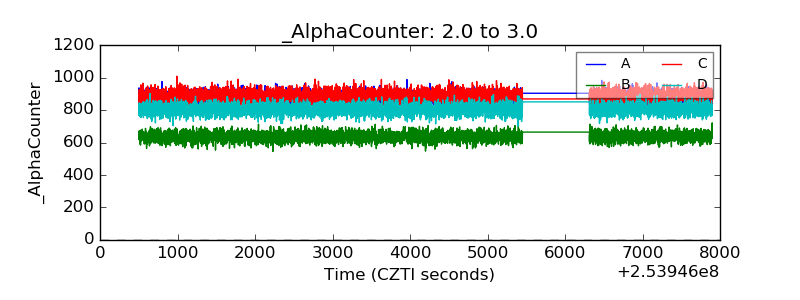 |
| _CPM_Rate | 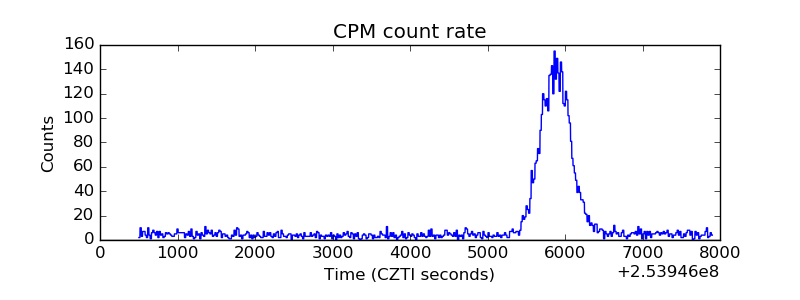 |
| CZT Counter |  |
| +2.5 Volts monitor |  |
| +5 Volts monitor |  |
| _ROLL_ROT | 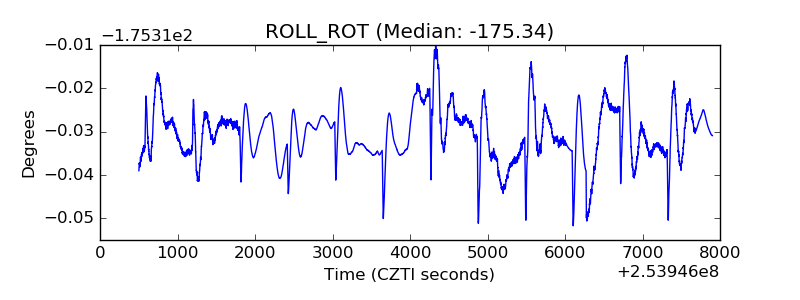 |
| _Roll_DEC | 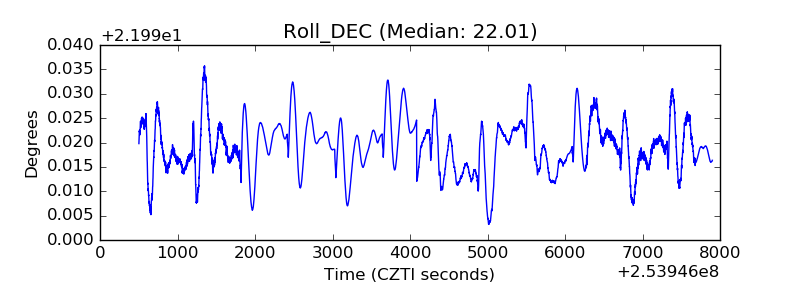 |
| _Roll_RA | 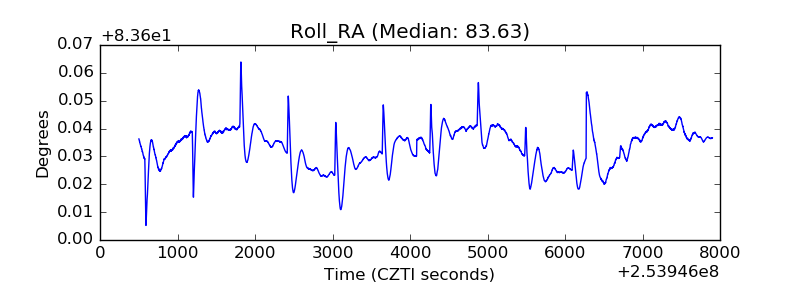 |
| Veto Counter | 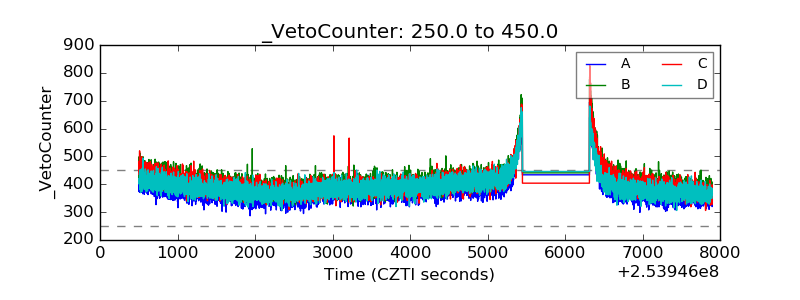 |