| Param | Original file | Final file |
|---|---|---|
| Filename | modeM0/AS1A04_174T01_9000001850_12482cztM0_level2.evt | modeM0/AS1A04_174T01_9000001850_12482cztM0_level2_quad_clean.evt |
| Size (bytes) | 651,749,760 | 99,627,840 |
| Size | 621.6 MB | 95.0 MB |
| Events in quadrant A | 5,559,289 | 604,433 |
| Events in quadrant B | 4,868,420 | 616,686 |
| Events in quadrant C | 4,185,066 | 616,604 |
| Events in quadrant D | 4,538,580 | 578,441 |
| Mode M0 | |||
|---|---|---|---|
| Quadrant | BADHDUFLAG | Total packets | Discarded packets |
| A | 0 | 21999 | 2 |
| B | 0 | 19890 | 1 |
| C | 0 | 18078 | 1 |
| D | 0 | 19252 | 1 |
| Mode M9 | |||
|---|---|---|---|
| Quadrant | BADHDUFLAG | Total packets | Discarded packets |
| A | 0 | 3 | 0 |
| B | 0 | 3 | 0 |
| C | 0 | 3 | 0 |
| D | 0 | 3 | 0 |
| Mode SS | |||
|---|---|---|---|
| Quadrant | BADHDUFLAG | Total packets | Discarded packets |
| A | 0 | 176 | 0 |
| B | 0 | 176 | 0 |
| C | 0 | 176 | 0 |
| D | 0 | 176 | 0 |
| Quadrant | Total seconds | Saturated seconds | Saturation percentage |
|---|---|---|---|
| A | 8658 | 536 | 6.190806% |
| B | 8658 | 585 | 6.756757% |
| C | 8658 | 266 | 3.072303% |
| D | 8658 | 374 | 4.319704% |
Noise dominated data is calculated using 1-second bins in cleaned event files. If a bin has >2000 counts, and if more than 50% of those come from <1% of pixels, then it is considered to be noise-dominated and hence unusable.
| Quadrant | # 1 sec bins | Bins with >0 counts | Bins with >2000 counts | High rate bins dominated by noise | Noise dominated (total time) | Noise dominated (detector-on time) | Marked lightcurve |
|---|---|---|---|---|---|---|---|
| A | 8899 | 8659 | 41 | 41 | 0.46% | 0.47% | 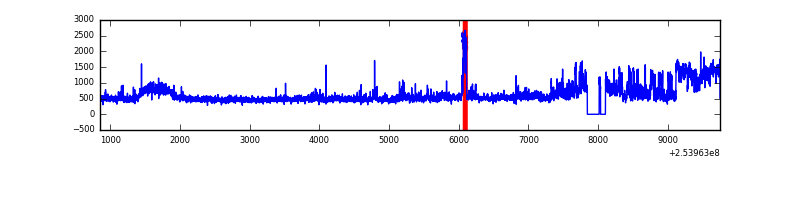 |
| B | 8899 | 8660 | 47 | 47 | 0.53% | 0.54% |  |
| C | 8899 | 8661 | 0 | 0 | 0.00% | 0.00% | 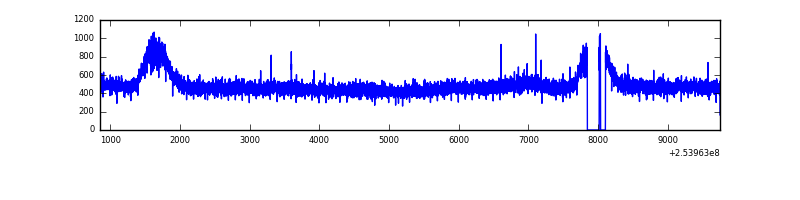 |
| D | 8899 | 8659 | 77 | 77 | 0.87% | 0.89% | 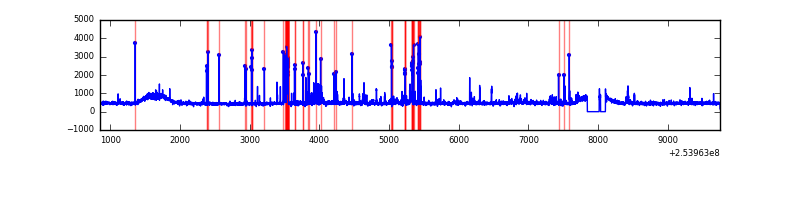 |
Top three noisy pixels from each quadrant. If the there are fewer than three noisy pixels in the level2.evt file, extra rows are filled as -1
| Pixel properties | Quadrant properties | ||||||
|---|---|---|---|---|---|---|---|
| Quadrant | DetID | PixID | Counts | Sigma | Mean | Median | Sigma |
| A | 0 | 23 | 971782 | 4358.87 | 1080 | 1056 | 222.7 |
| A | 12 | 189 | 209138 | 934.35 | 1080 | 1056 | 222.7 |
| A | 0 | 226 | 71940 | 318.29 | 1080 | 1056 | 222.7 |
| B | 4 | 239 | 472714 | 2271.58 | 1081 | 1053 | 207.6 |
| B | 0 | 85 | 82953 | 394.44 | 1081 | 1053 | 207.6 |
| B | 0 | 214 | 31724 | 147.72 | 1081 | 1053 | 207.6 |
| C | 13 | 61 | 7785 | 26.97 | 1070 | 1078 | 248.7 |
| C | 8 | 128 | 4564 | 14.02 | 1070 | 1078 | 248.7 |
| C | 8 | 112 | 3454 | 9.55 | 1070 | 1078 | 248.7 |
| D | 1 | 52 | 362488 | 1403.53 | 1056 | 1023 | 257.5 |
| D | 7 | 71 | 92146 | 353.82 | 1056 | 1023 | 257.5 |
| D | 2 | 234 | 31279 | 117.48 | 1056 | 1023 | 257.5 |
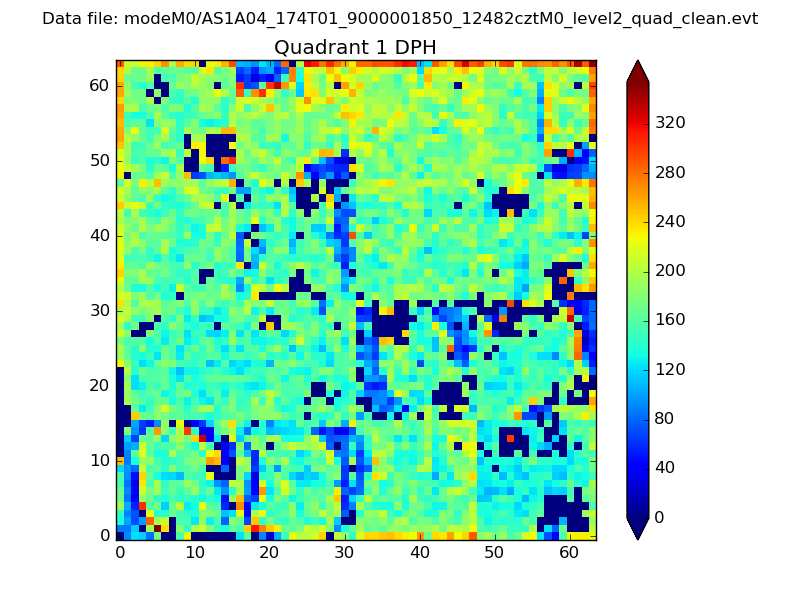
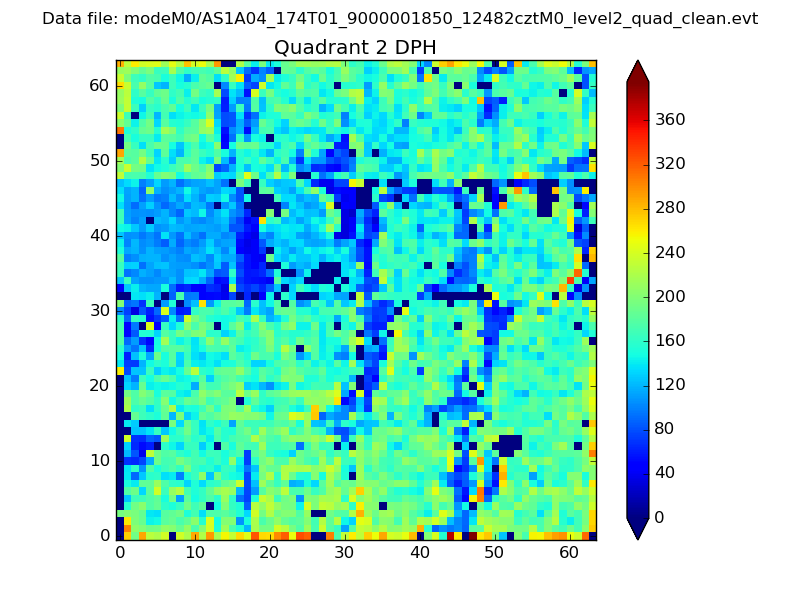
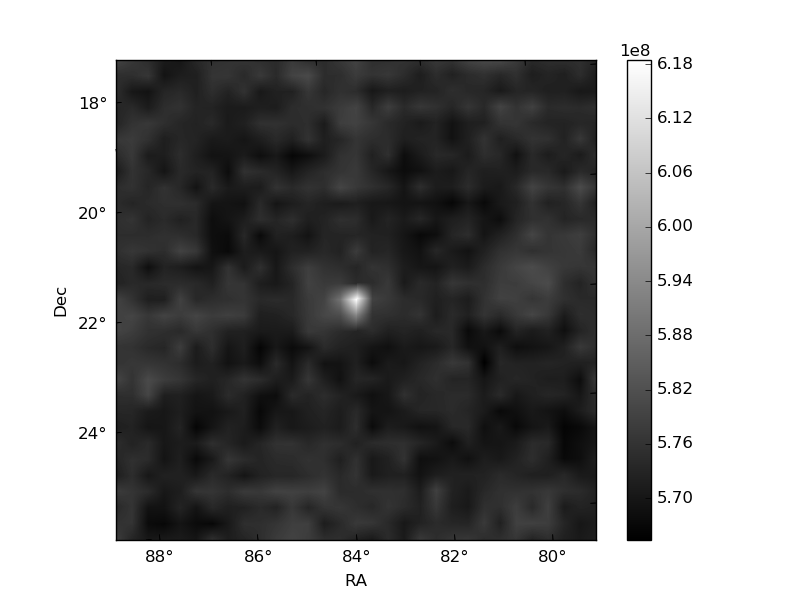
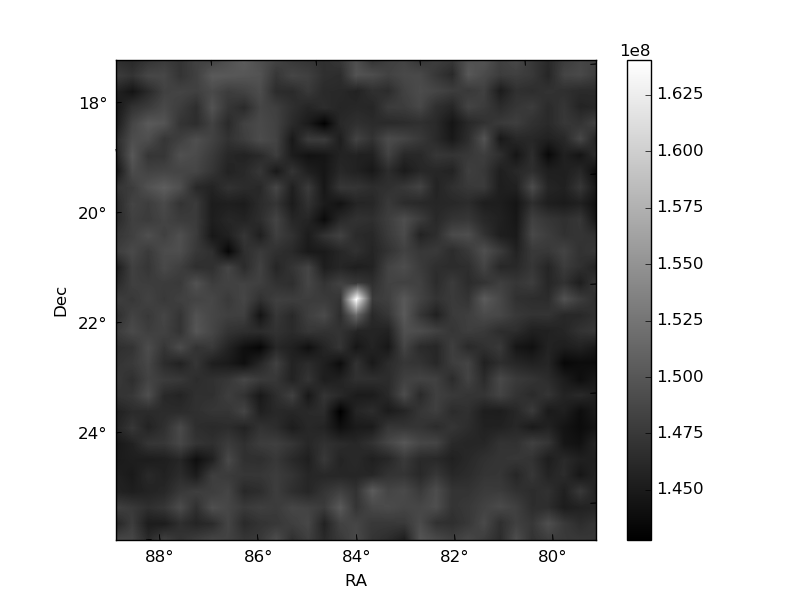
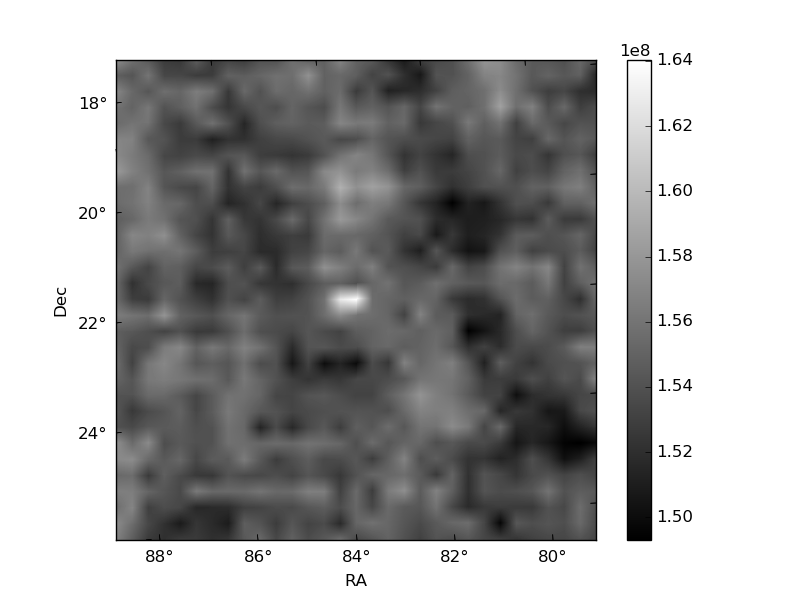
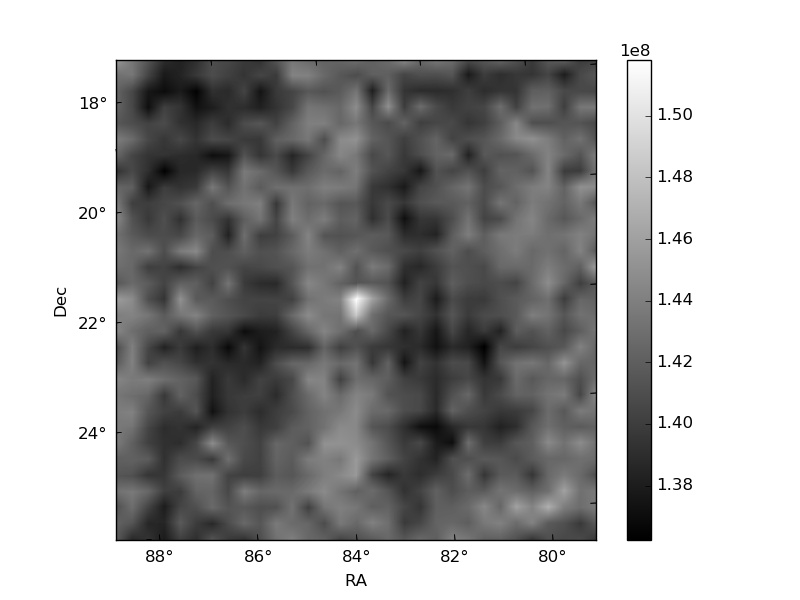
Histogram calculated using DETX and DETY for each event in the final _common_clean file
| Quadrant A | 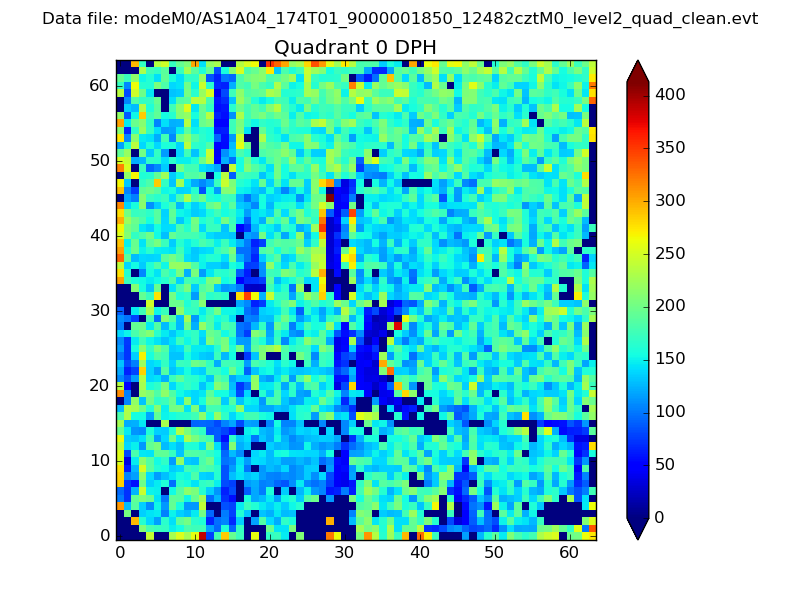 |
 |
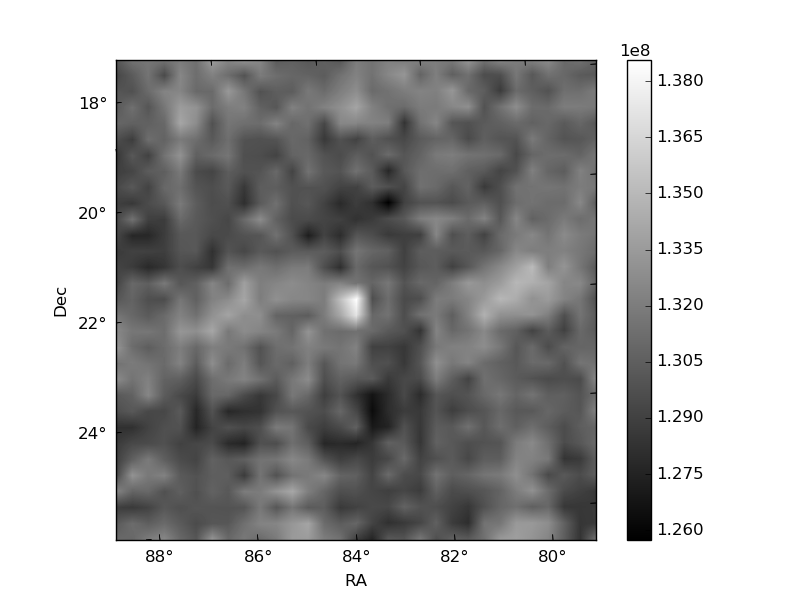
Quadrant B |
|---|---|---|---|
| Quadrant D | 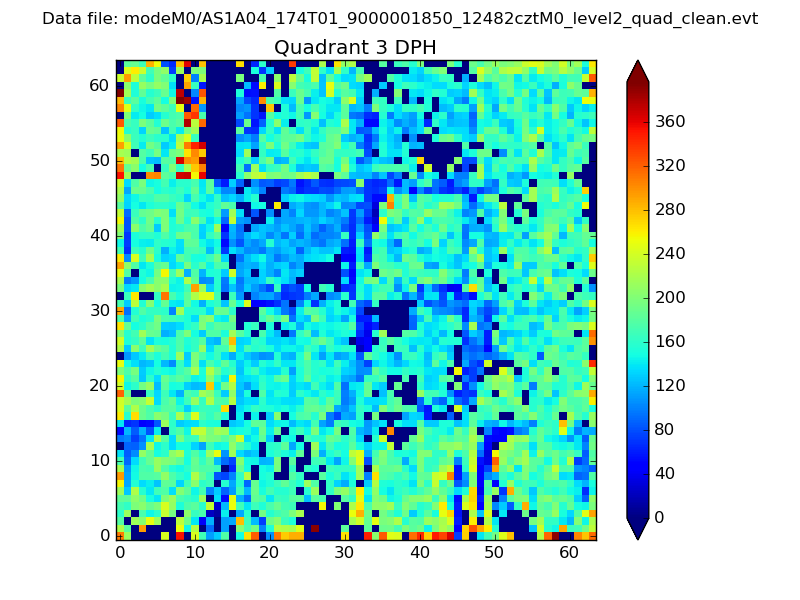 |
 |
Quadrant C |
| Plot type | Count rate plots | Images |
|---|---|---|
| Comparison with Poisson distribution Blue bars denote a histogram of data divided into 1 sec bins. Red curve is a Poisson curve with rate = median count rate of data. |
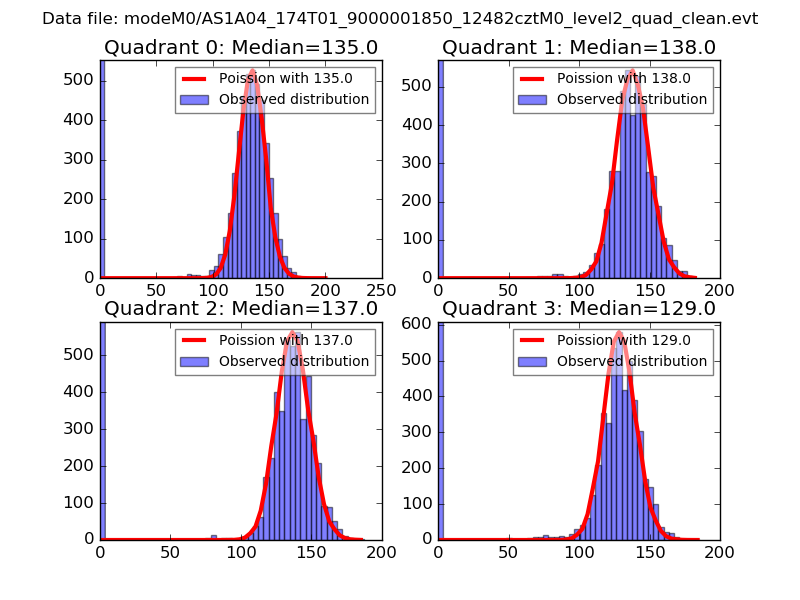 |
 |
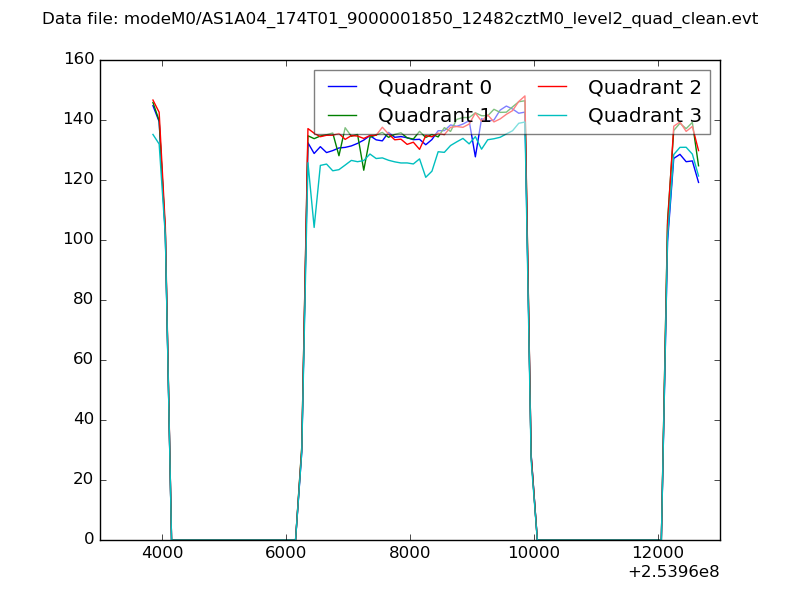
| Quadrant-wise count rates Data is divided into 100 sec bins |
 |
|
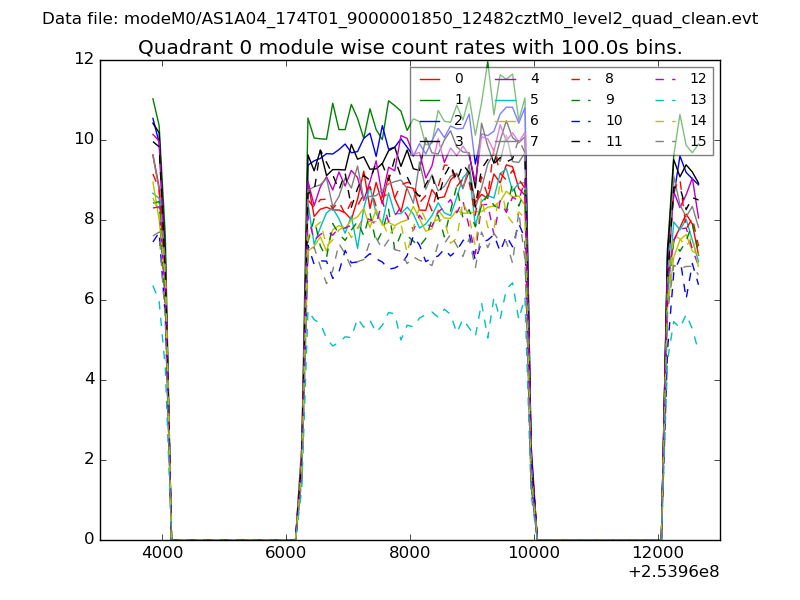
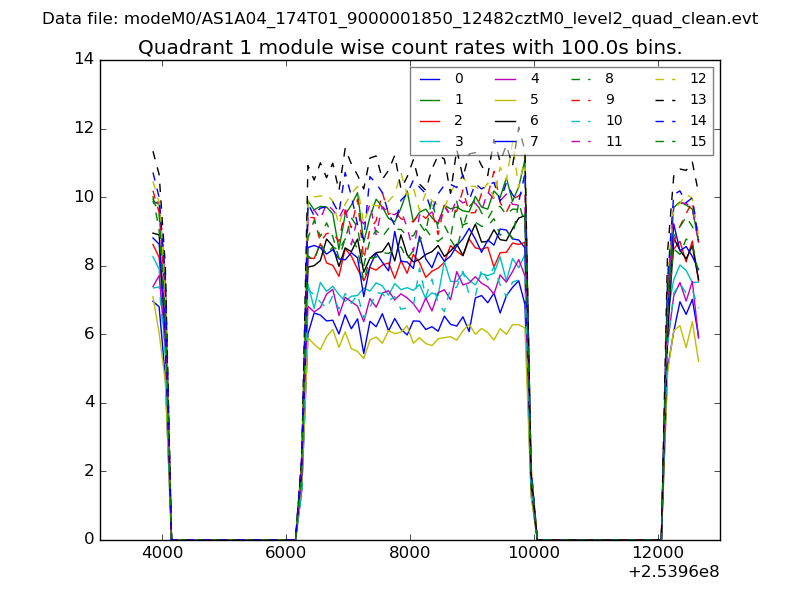
| Module-wise count rates for Quadrant A Data is divided into 100 sec bins |
 |
 |
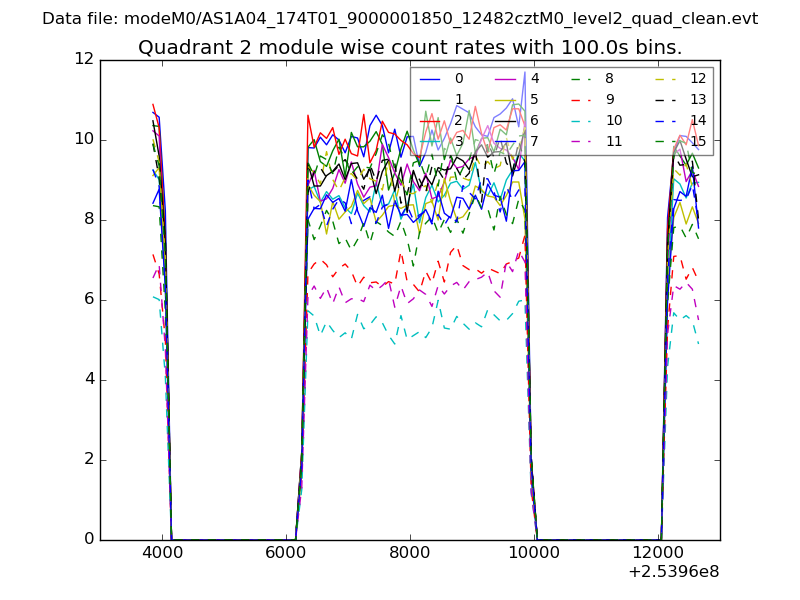
| Module-wise count rates for Quadrant B Data is divided into 100 sec bins |
 |
 |
| Module-wise count rates for Quadrant C Data is divided into 100 sec bins |
 |
 |
| Module-wise count rates for Quadrant D Data is divided into 100 sec bins |
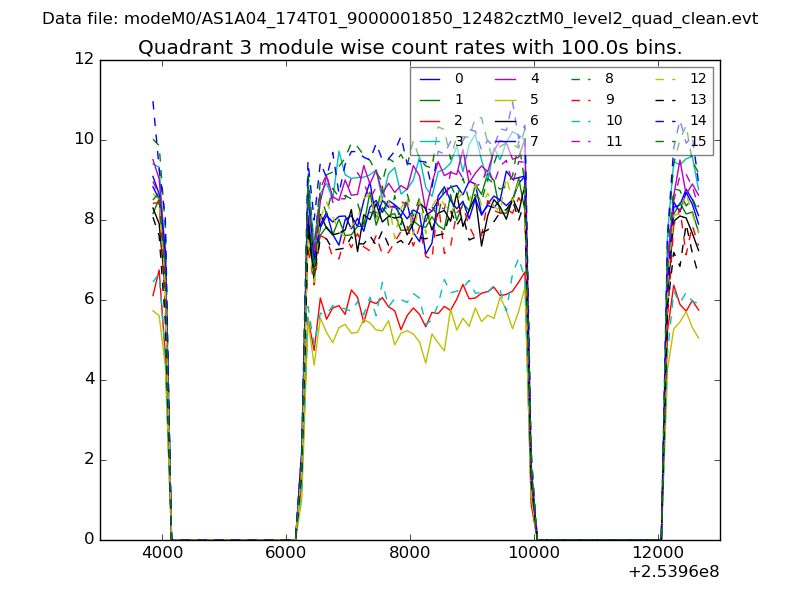 |
 |
| Parameter | Plot |
|---|---|
| CZT HV Monitor | 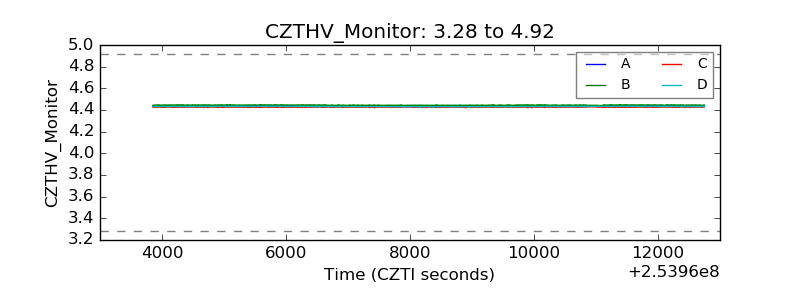 |
| D_VDD | 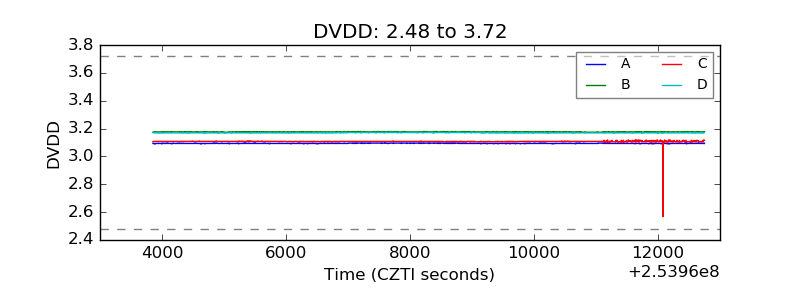 |
| Temperature 1 |  |
| Veto HV Monitor | 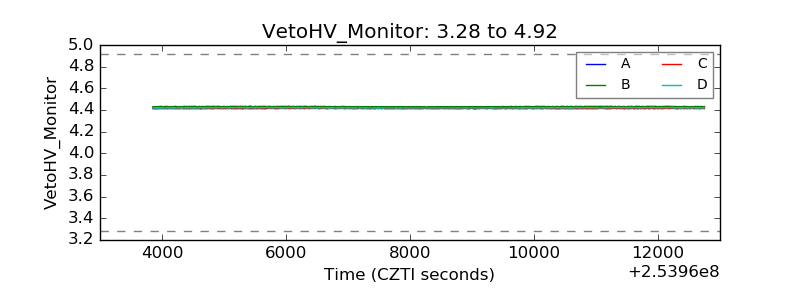 |
| Veto LLD | 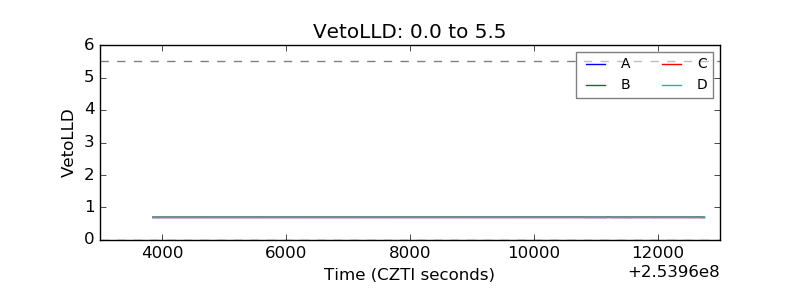 |
| Alpha Counter | 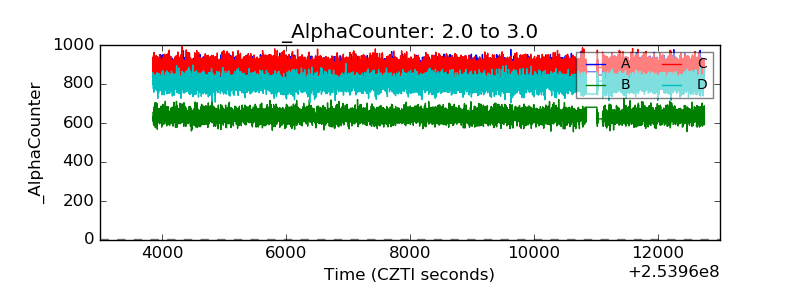 |
| _CPM_Rate | 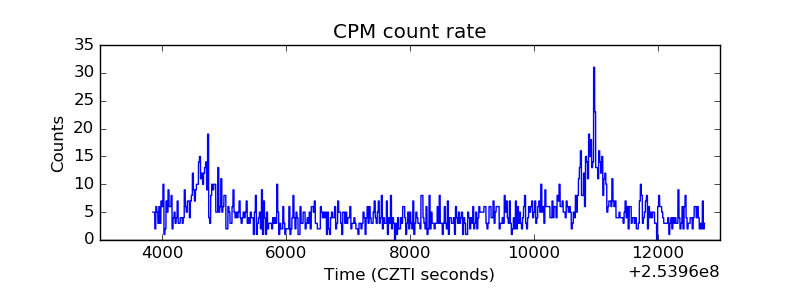 |
| CZT Counter | 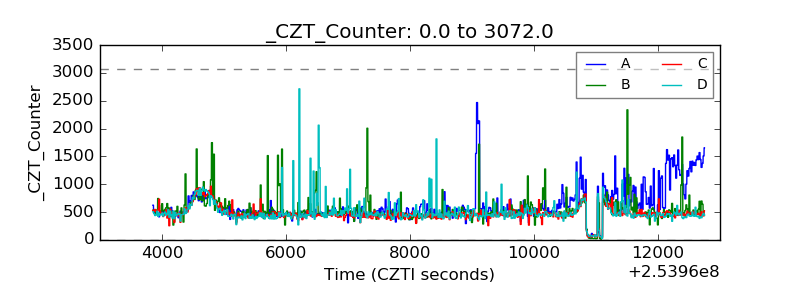 |
| +2.5 Volts monitor |  |
| +5 Volts monitor |  |
| _ROLL_ROT | 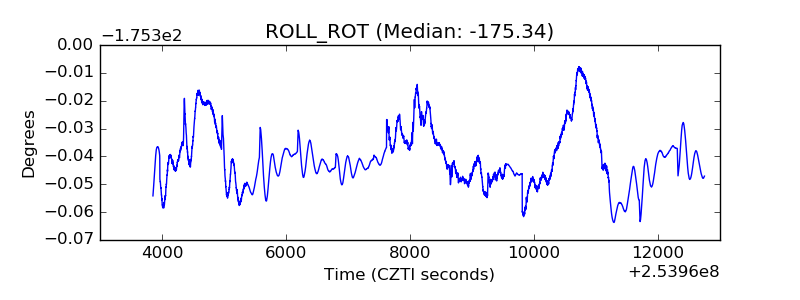 |
| _Roll_DEC | 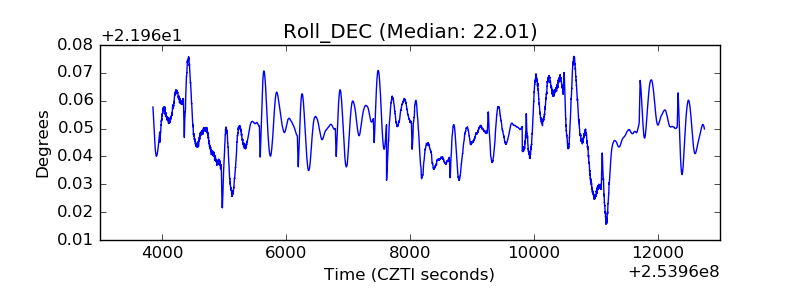 |
| _Roll_RA | 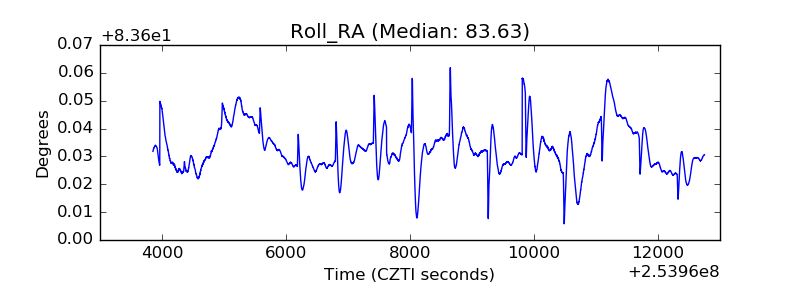 |
| Veto Counter | 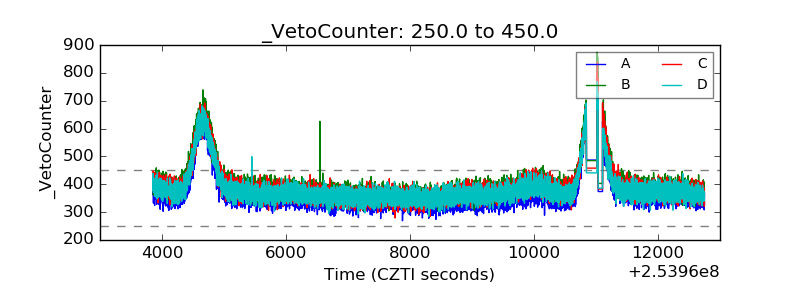 |