| Param | Original file | Final file |
|---|---|---|
| Filename | modeM0/AS1A04_174T01_9000001850_12485cztM0_level2.evt | modeM0/AS1A04_174T01_9000001850_12485cztM0_level2_quad_clean.evt |
| Size (bytes) | 1,461,726,720 | 261,328,320 |
| Size | 1.4 GB | 249.2 MB |
| Events in quadrant A | 13,530,762 | 1,669,240 |
| Events in quadrant B | 10,744,578 | 1,690,691 |
| Events in quadrant C | 8,472,010 | 1,701,411 |
| Events in quadrant D | 10,291,005 | 1,596,969 |
| Mode M0 | |||
|---|---|---|---|
| Quadrant | BADHDUFLAG | Total packets | Discarded packets |
| A | 0 | 51932 | 4 |
| B | 0 | 43604 | 3 |
| C | 0 | 37274 | 3 |
| D | 0 | 42395 | 3 |
| Mode M9 | |||
|---|---|---|---|
| Quadrant | BADHDUFLAG | Total packets | Discarded packets |
| A | 0 | 18 | 0 |
| B | 0 | 18 | 0 |
| C | 0 | 18 | 0 |
| D | 0 | 18 | 0 |
| Mode SS | |||
|---|---|---|---|
| Quadrant | BADHDUFLAG | Total packets | Discarded packets |
| A | 0 | 372 | 0 |
| B | 0 | 372 | 0 |
| C | 0 | 372 | 0 |
| D | 0 | 372 | 0 |
| Quadrant | Total seconds | Saturated seconds | Saturation percentage |
|---|---|---|---|
| A | 18229 | 400 | 2.194306% |
| B | 18229 | 646 | 3.543804% |
| C | 18229 | 134 | 0.735092% |
| D | 18229 | 468 | 2.567338% |
Noise dominated data is calculated using 1-second bins in cleaned event files. If a bin has >2000 counts, and if more than 50% of those come from <1% of pixels, then it is considered to be noise-dominated and hence unusable.
| Quadrant | # 1 sec bins | Bins with >0 counts | Bins with >2000 counts | High rate bins dominated by noise | Noise dominated (total time) | Noise dominated (detector-on time) | Marked lightcurve |
|---|---|---|---|---|---|---|---|
| A | 20140 | 18231 | 3 | 3 | 0.01% | 0.02% | 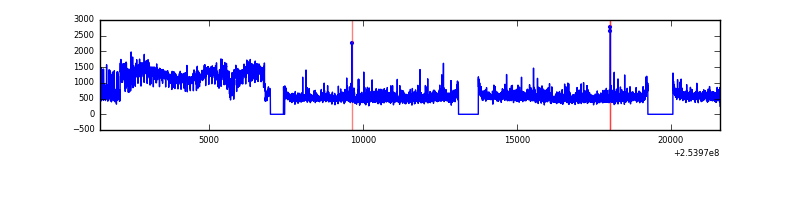 |
| B | 20140 | 18231 | 278 | 278 | 1.38% | 1.52% | 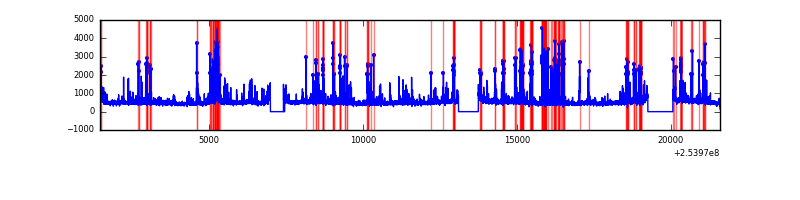 |
| C | 20140 | 18231 | 2 | 2 | 0.01% | 0.01% | 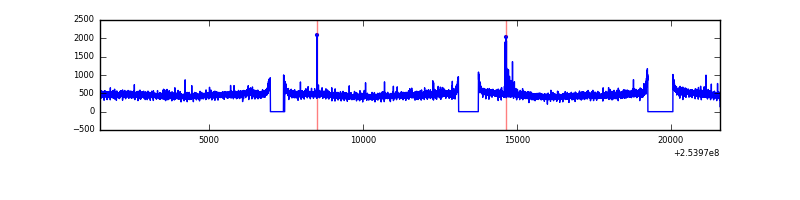 |
| D | 20140 | 18231 | 238 | 238 | 1.18% | 1.31% | 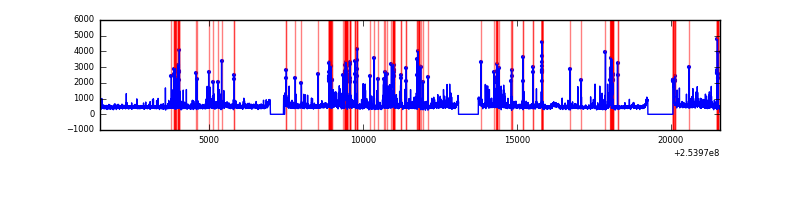 |
Top three noisy pixels from each quadrant. If the there are fewer than three noisy pixels in the level2.evt file, extra rows are filled as -1
| Pixel properties | Quadrant properties | ||||||
|---|---|---|---|---|---|---|---|
| Quadrant | DetID | PixID | Counts | Sigma | Mean | Median | Sigma |
| A | 0 | 23 | 3736917 | 8286.83 | 2209 | 2164 | 450.7 |
| A | 1 | 162 | 303826 | 669.34 | 2209 | 2164 | 450.7 |
| A | 0 | 226 | 276054 | 607.72 | 2209 | 2164 | 450.7 |
| B | 4 | 239 | 1263351 | 3020.7 | 2195 | 2143 | 417.5 |
| B | 10 | 245 | 384591 | 915.99 | 2195 | 2143 | 417.5 |
| B | 0 | 230 | 104433 | 244.99 | 2195 | 2143 | 417.5 |
| C | 15 | 208 | 40490 | 76.98 | 2157 | 2174 | 497.8 |
| C | 13 | 61 | 15773 | 27.32 | 2157 | 2174 | 497.8 |
| C | 8 | 128 | 10698 | 17.12 | 2157 | 2174 | 497.8 |
| D | 1 | 52 | 1140465 | 2200.27 | 2139 | 2081 | 517.4 |
| D | 8 | 195 | 248926 | 477.1 | 2139 | 2081 | 517.4 |
| D | 13 | 104 | 173940 | 332.17 | 2139 | 2081 | 517.4 |
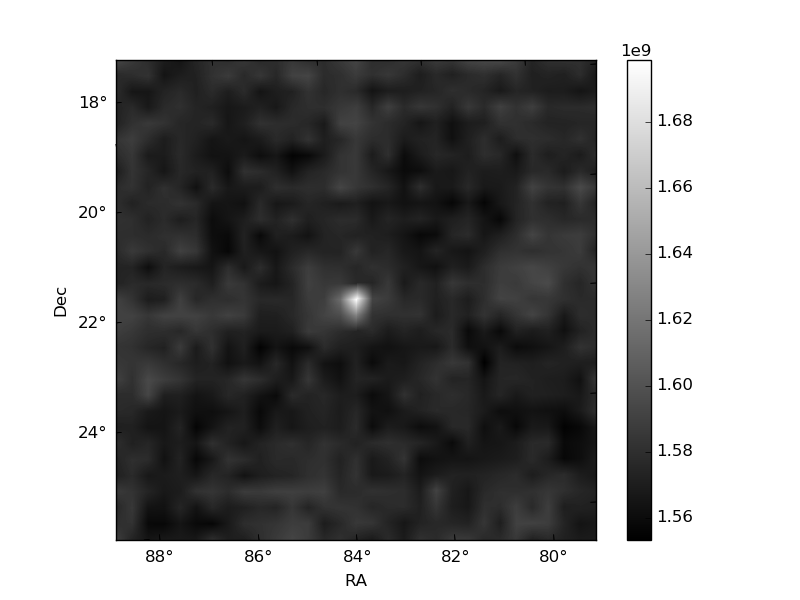
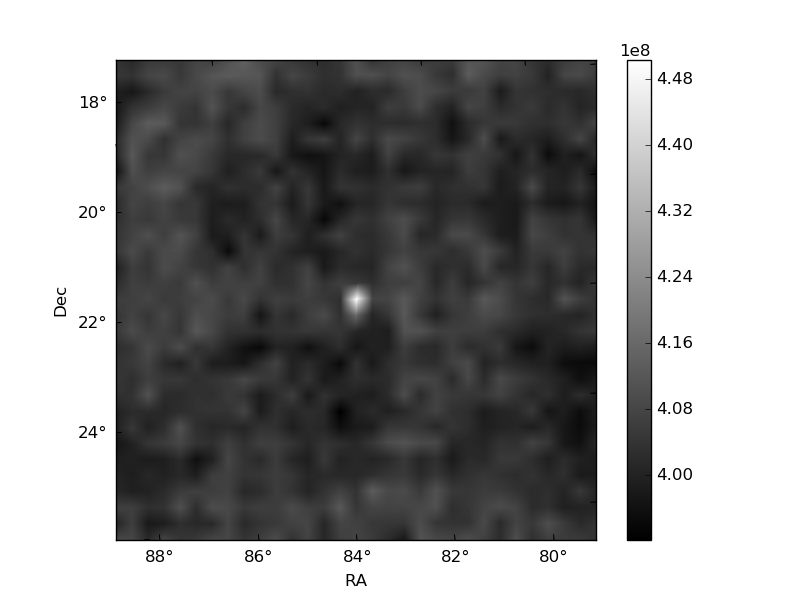
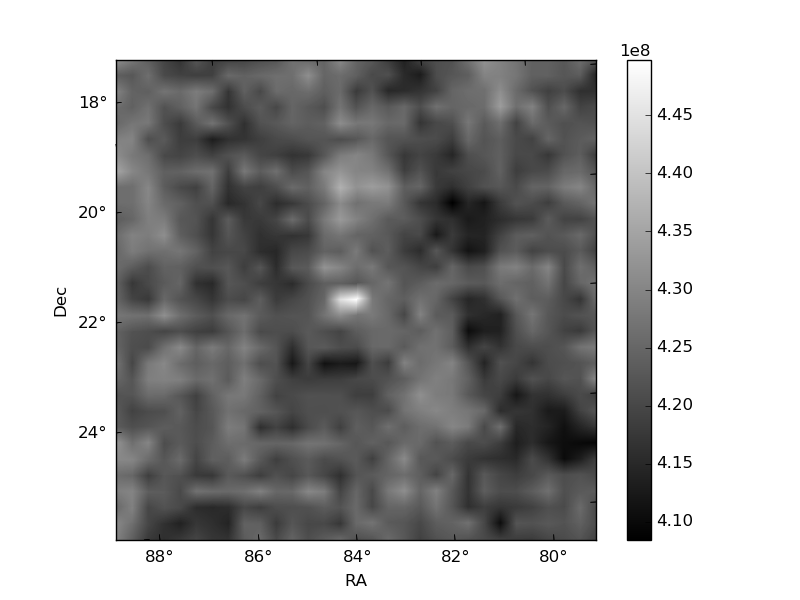
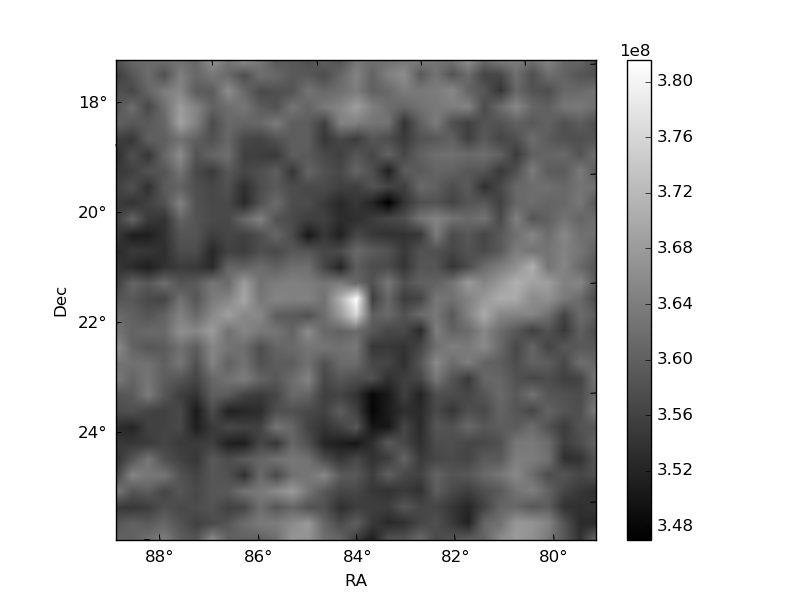
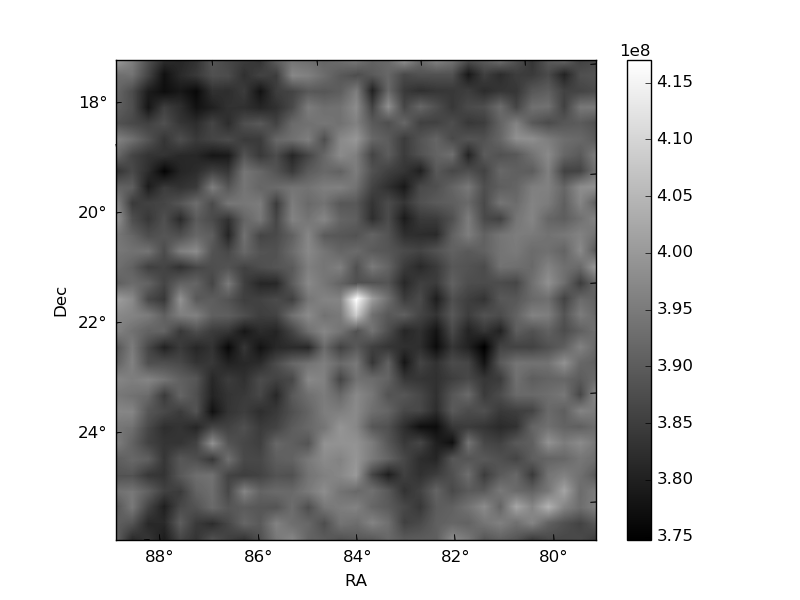
Histogram calculated using DETX and DETY for each event in the final _common_clean file
| Quadrant A | 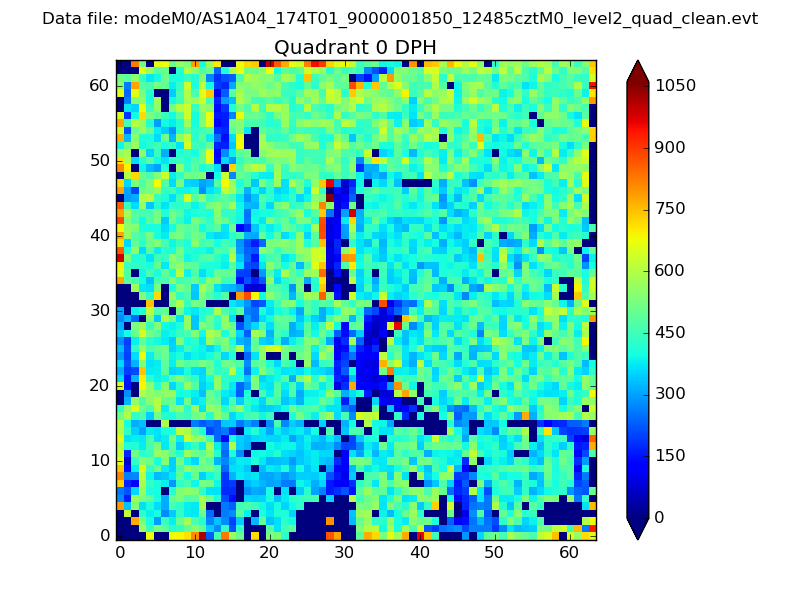 |
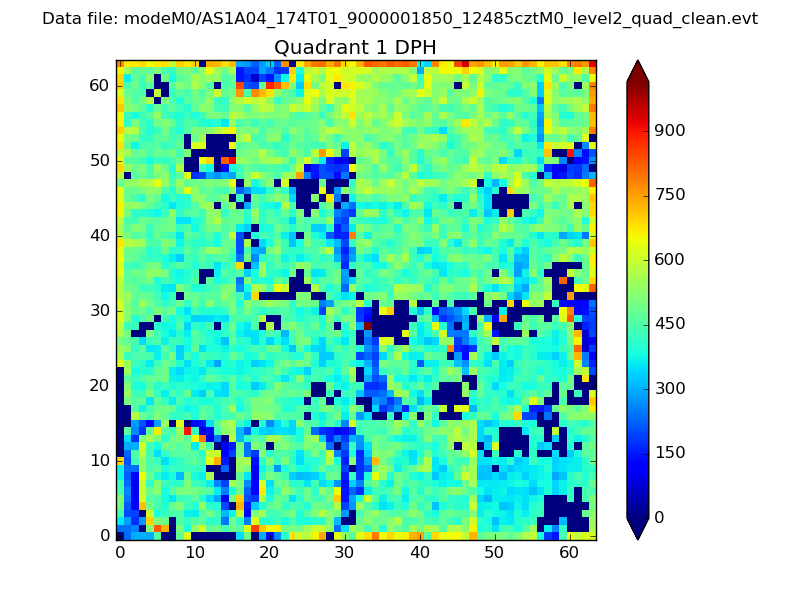 |
Quadrant B |
|---|---|---|---|
| Quadrant D | 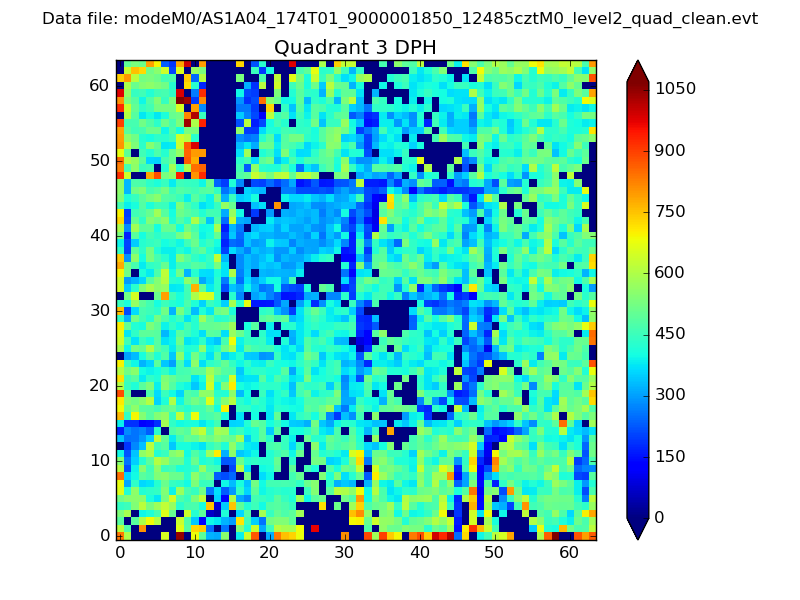 |
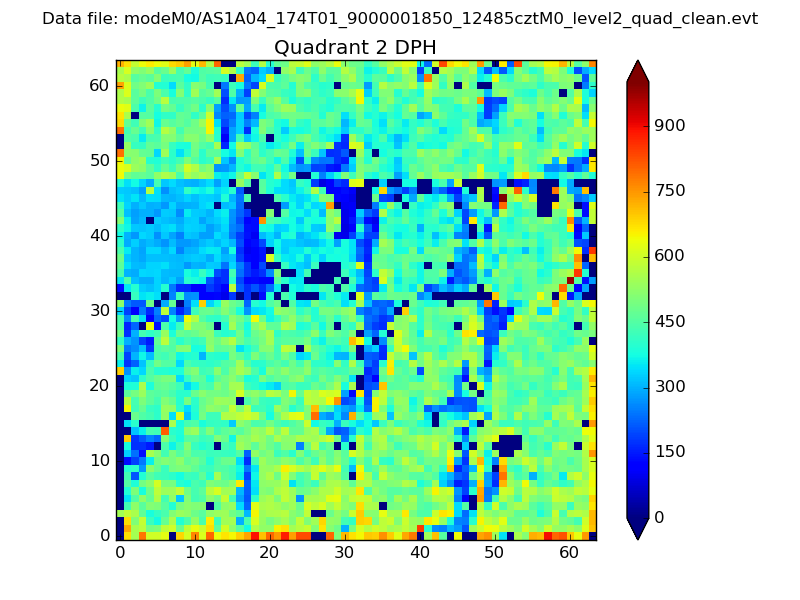 |
Quadrant C |
| Plot type | Count rate plots | Images |
|---|---|---|
| Comparison with Poisson distribution Blue bars denote a histogram of data divided into 1 sec bins. Red curve is a Poisson curve with rate = median count rate of data. |
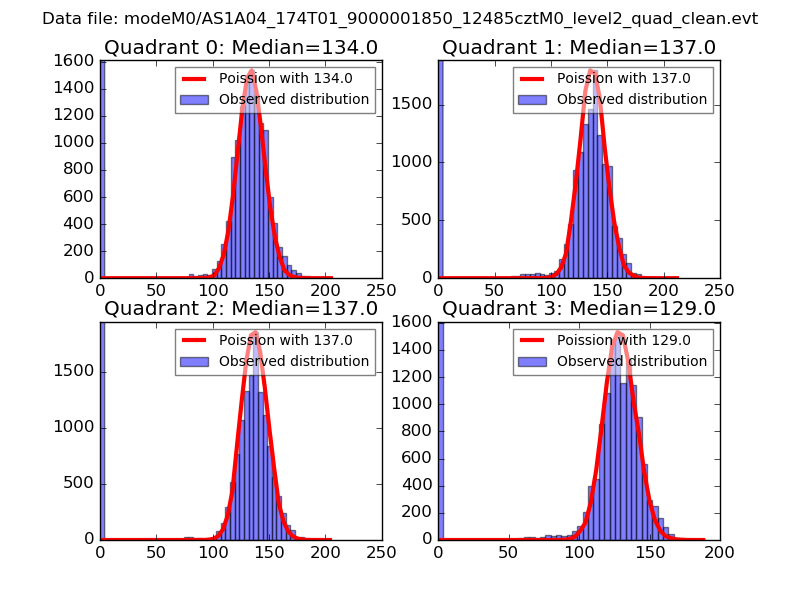 |
 |
| Quadrant-wise count rates Data is divided into 100 sec bins |
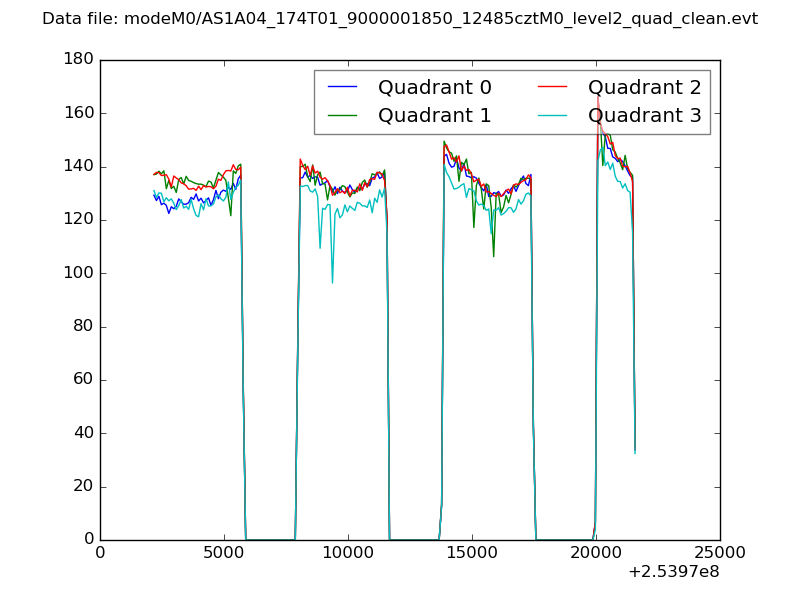 |
|
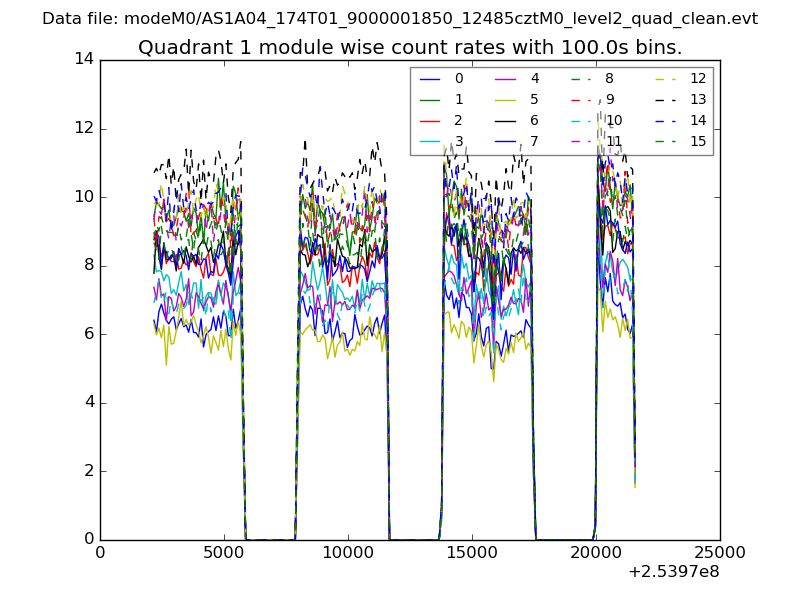
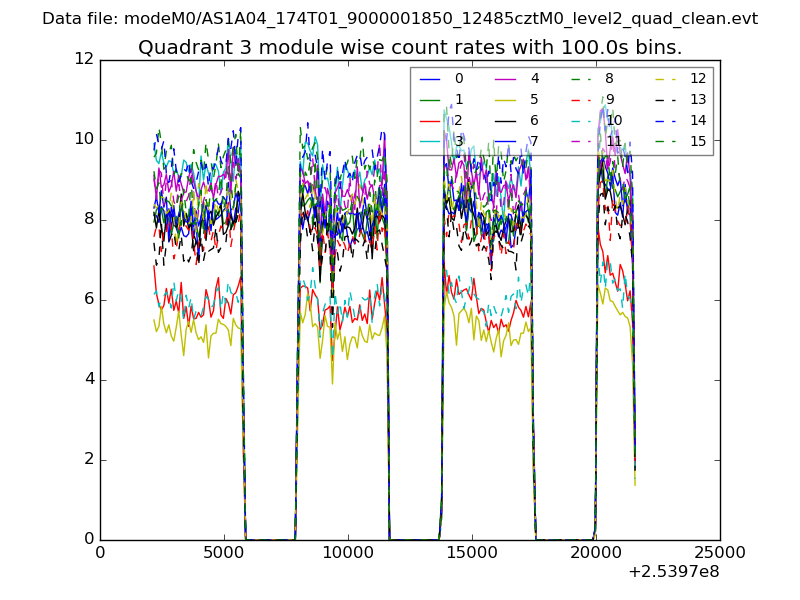
| Module-wise count rates for Quadrant A Data is divided into 100 sec bins |
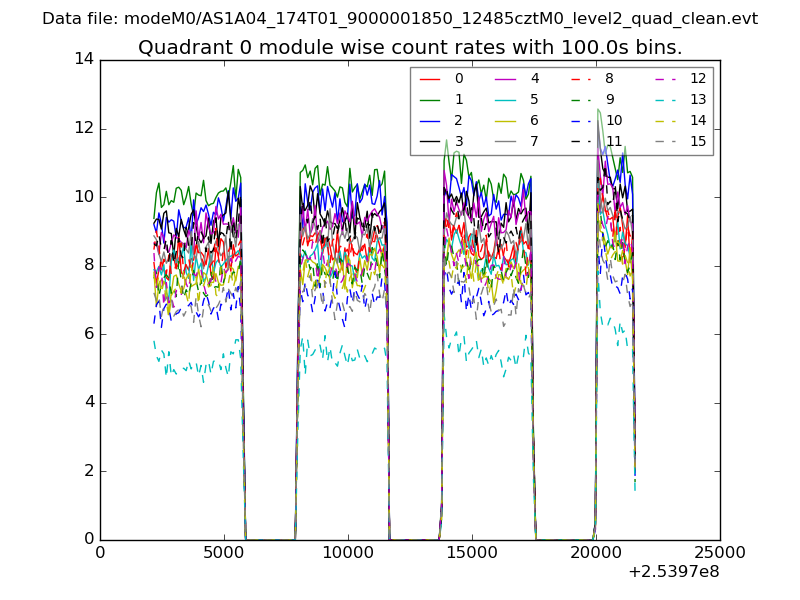 |
 |
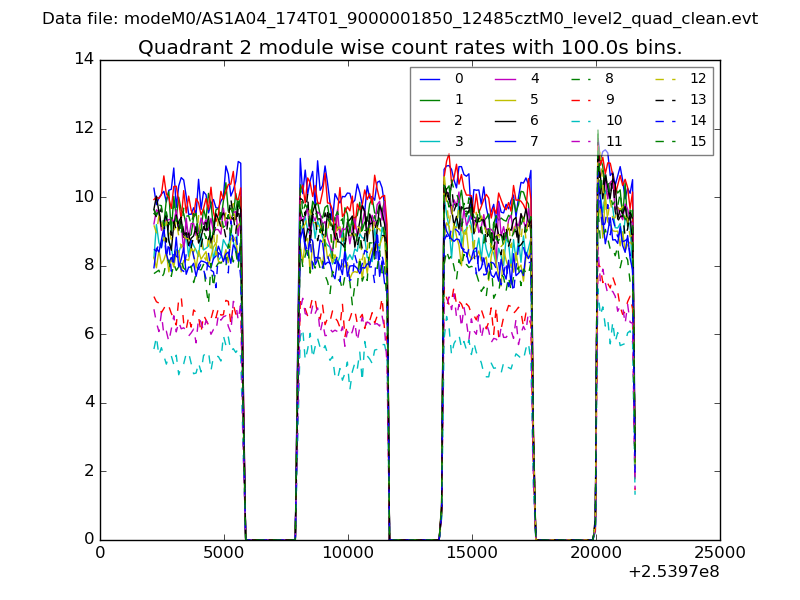
| Module-wise count rates for Quadrant B Data is divided into 100 sec bins |
 |
 |
| Module-wise count rates for Quadrant C Data is divided into 100 sec bins |
 |
 |
| Module-wise count rates for Quadrant D Data is divided into 100 sec bins |
 |
 |
| Parameter | Plot |
|---|---|
| CZT HV Monitor | 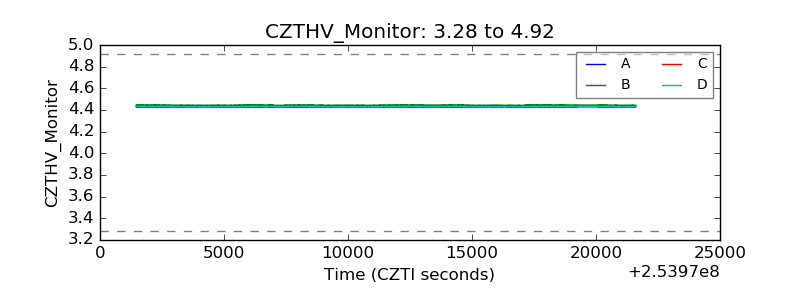 |
| D_VDD | 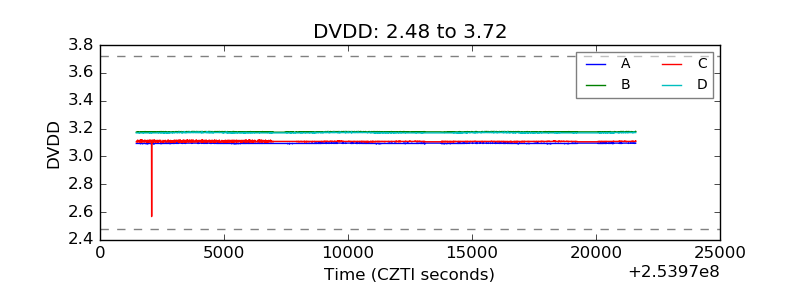 |
| Temperature 1 | 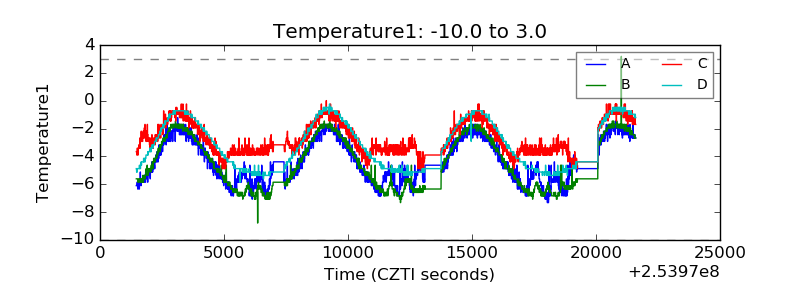 |
| Veto HV Monitor | 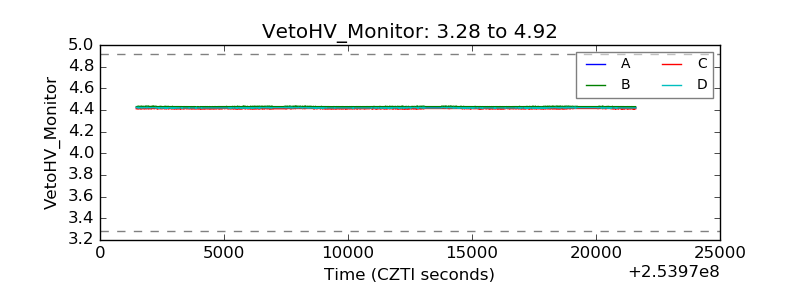 |
| Veto LLD | 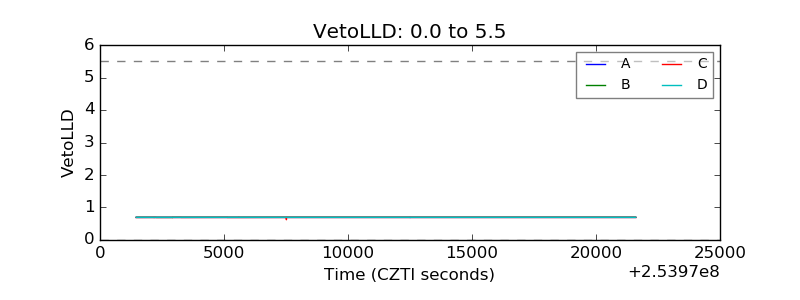 |
| Alpha Counter | 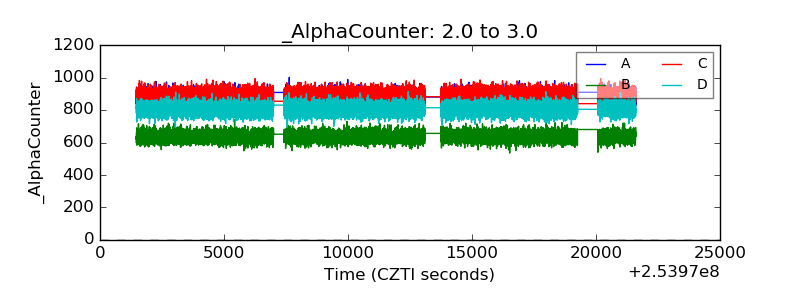 |
| _CPM_Rate | 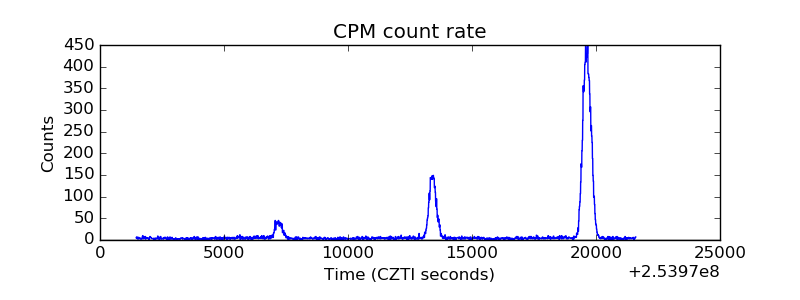 |
| CZT Counter | 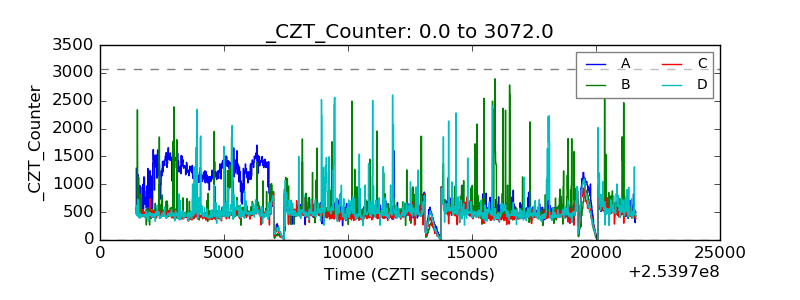 |
| +2.5 Volts monitor |  |
| +5 Volts monitor |  |
| _ROLL_ROT | 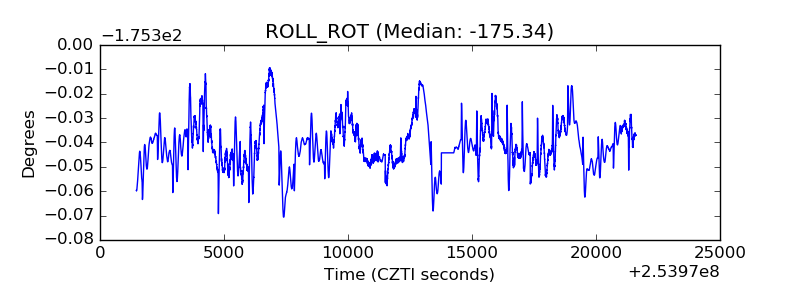 |
| _Roll_DEC | 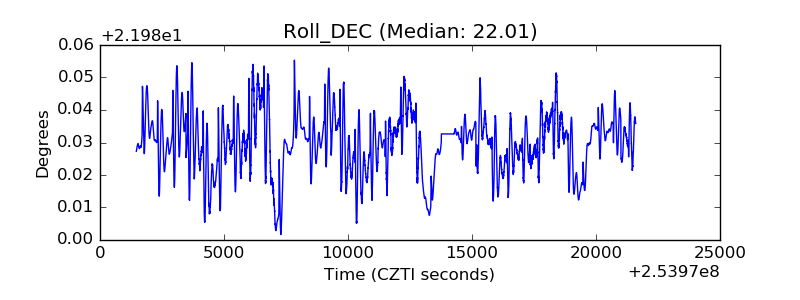 |
| _Roll_RA | 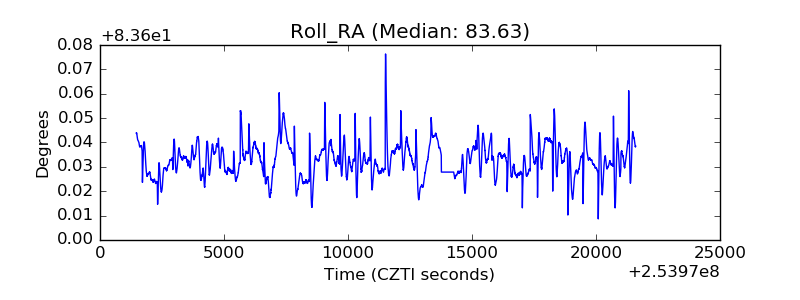 |
| Veto Counter | 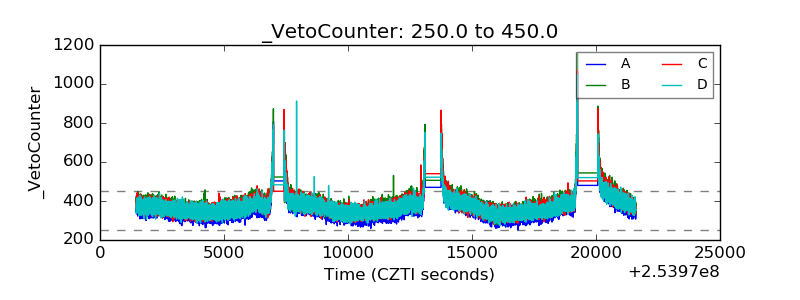 |