| Param | Original file | Final file |
|---|---|---|
| Filename | modeM0/AS1A04_174T01_9000001850_12490cztM0_level2.evt | modeM0/AS1A04_174T01_9000001850_12490cztM0_level2_quad_clean.evt |
| Size (bytes) | 452,687,040 | 88,214,400 |
| Size | 431.7 MB | 84.1 MB |
| Events in quadrant A | 3,411,015 | 570,956 |
| Events in quadrant B | 3,280,932 | 592,614 |
| Events in quadrant C | 2,811,569 | 575,152 |
| Events in quadrant D | 3,814,775 | 529,683 |
| Mode M0 | |||
|---|---|---|---|
| Quadrant | BADHDUFLAG | Total packets | Discarded packets |
| A | 0 | 13959 | 2 |
| B | 0 | 13344 | 1 |
| C | 0 | 11887 | 1 |
| D | 0 | 15067 | 1 |
| Mode M9 | |||
|---|---|---|---|
| Quadrant | BADHDUFLAG | Total packets | Discarded packets |
| A | 0 | 13 | 0 |
| B | 0 | 13 | 0 |
| C | 0 | 13 | 0 |
| D | 0 | 13 | 0 |
| Mode SS | |||
|---|---|---|---|
| Quadrant | BADHDUFLAG | Total packets | Discarded packets |
| A | 0 | 118 | 0 |
| B | 0 | 118 | 0 |
| C | 0 | 118 | 0 |
| D | 0 | 118 | 0 |
| Quadrant | Total seconds | Saturated seconds | Saturation percentage |
|---|---|---|---|
| A | 5762 | 35 | 0.607428% |
| B | 5762 | 62 | 1.076015% |
| C | 5762 | 11 | 0.190906% |
| D | 5762 | 273 | 4.737938% |
Noise dominated data is calculated using 1-second bins in cleaned event files. If a bin has >2000 counts, and if more than 50% of those come from <1% of pixels, then it is considered to be noise-dominated and hence unusable.
| Quadrant | # 1 sec bins | Bins with >0 counts | Bins with >2000 counts | High rate bins dominated by noise | Noise dominated (total time) | Noise dominated (detector-on time) | Marked lightcurve |
|---|---|---|---|---|---|---|---|
| A | 7093 | 5764 | 5 | 5 | 0.07% | 0.09% | 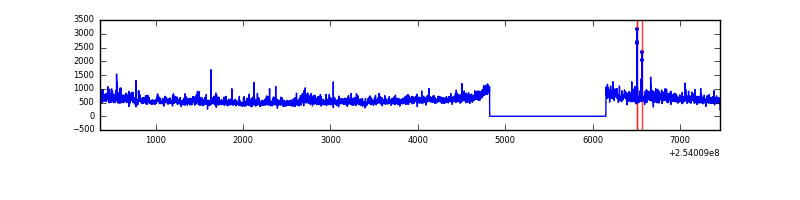 |
| B | 7093 | 5764 | 19 | 19 | 0.27% | 0.33% | 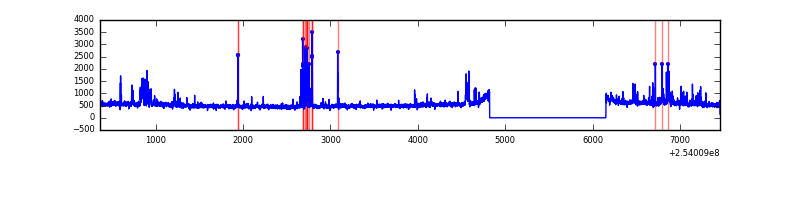 |
| C | 7093 | 5764 | 0 | 0 | 0.00% | 0.00% | 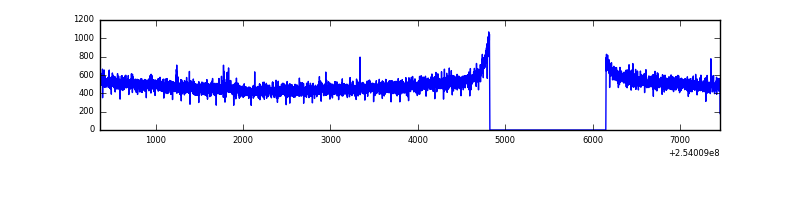 |
| D | 7093 | 5764 | 232 | 232 | 3.27% | 4.02% | 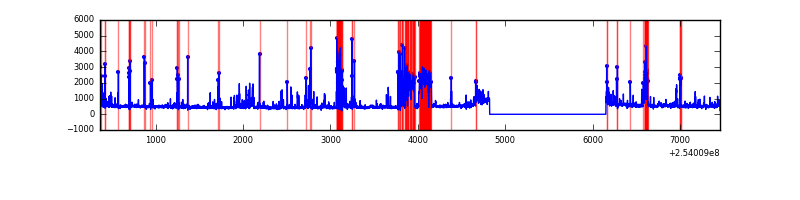 |
Top three noisy pixels from each quadrant. If the there are fewer than three noisy pixels in the level2.evt file, extra rows are filled as -1
| Pixel properties | Quadrant properties | ||||||
|---|---|---|---|---|---|---|---|
| Quadrant | DetID | PixID | Counts | Sigma | Mean | Median | Sigma |
| A | 1 | 162 | 161836 | 1084.36 | 733 | 719 | 148.6 |
| A | 1 | 178 | 101881 | 680.85 | 733 | 719 | 148.6 |
| A | 1 | 161 | 84748 | 565.54 | 733 | 719 | 148.6 |
| B | 4 | 239 | 185816 | 1325.34 | 743 | 728 | 139.7 |
| B | 0 | 230 | 58480 | 413.54 | 743 | 728 | 139.7 |
| B | 0 | 219 | 43027 | 302.89 | 743 | 728 | 139.7 |
| C | 15 | 208 | 5469 | 28.58 | 719 | 727 | 165.9 |
| C | 13 | 61 | 5213 | 27.04 | 719 | 727 | 165.9 |
| C | 14 | 234 | 3746 | 18.2 | 719 | 727 | 165.9 |
| D | 1 | 52 | 989291 | 5940.27 | 698 | 680 | 166.4 |
| D | 7 | 80 | 84172 | 501.68 | 698 | 680 | 166.4 |
| D | 7 | 71 | 44302 | 262.11 | 698 | 680 | 166.4 |
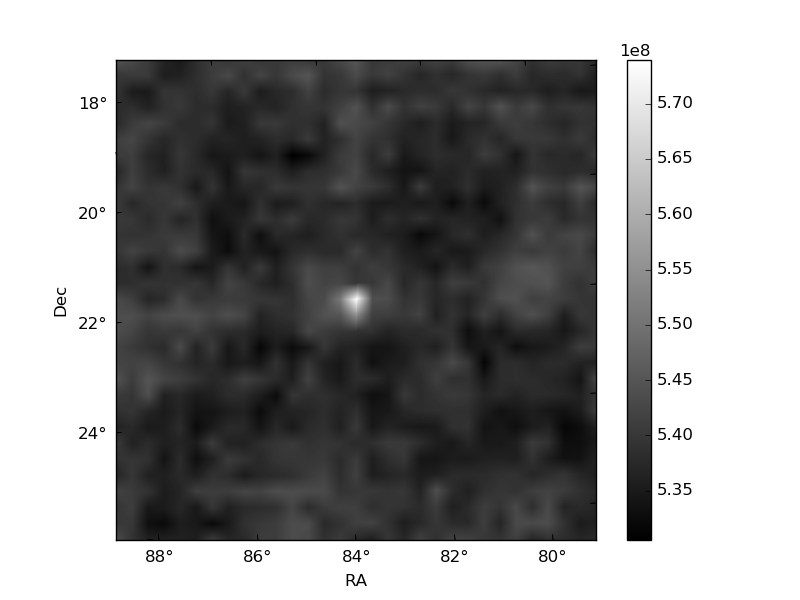
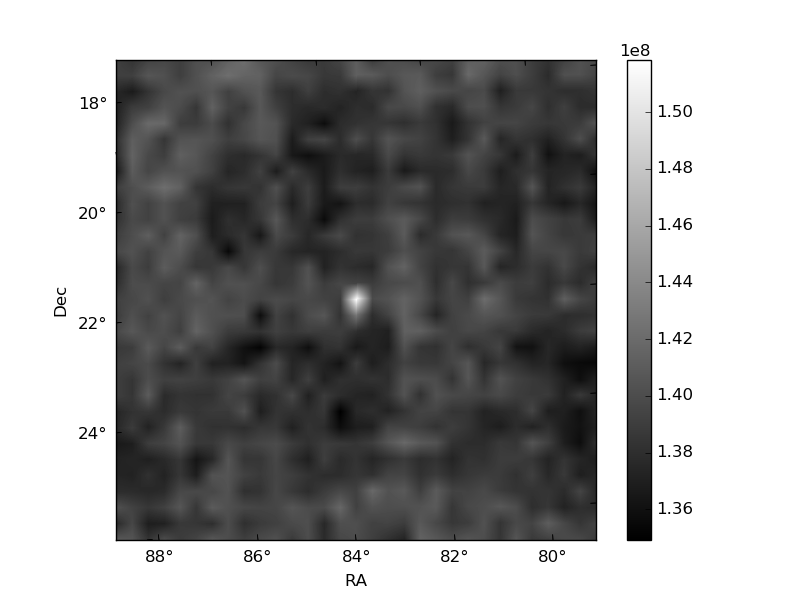
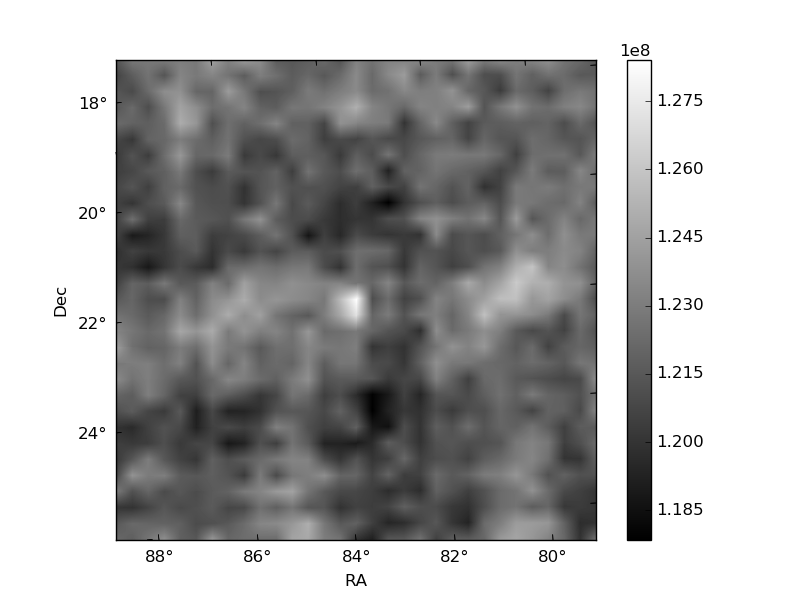
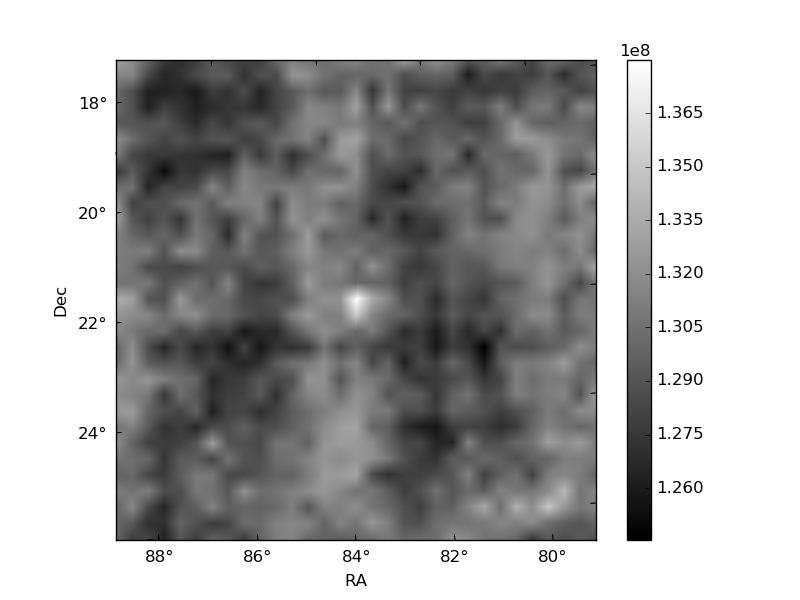
Histogram calculated using DETX and DETY for each event in the final _common_clean file
| Quadrant A | 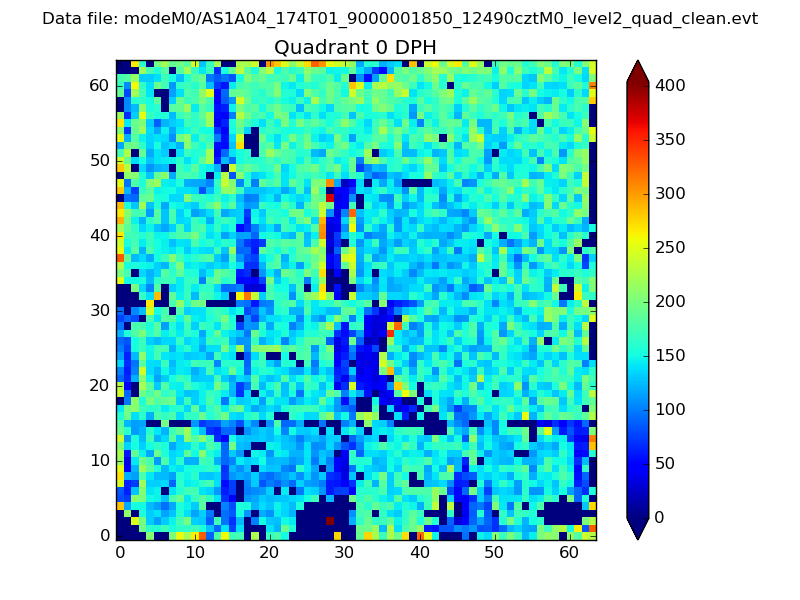 |
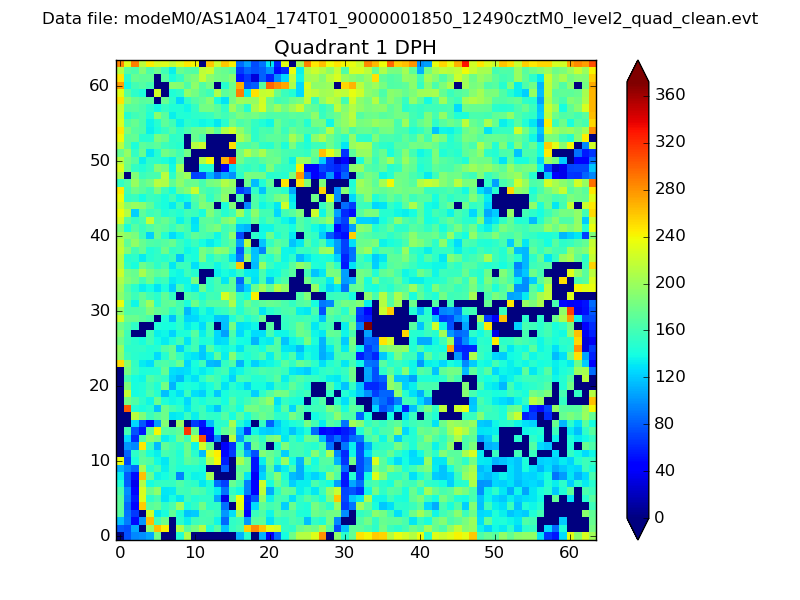 |
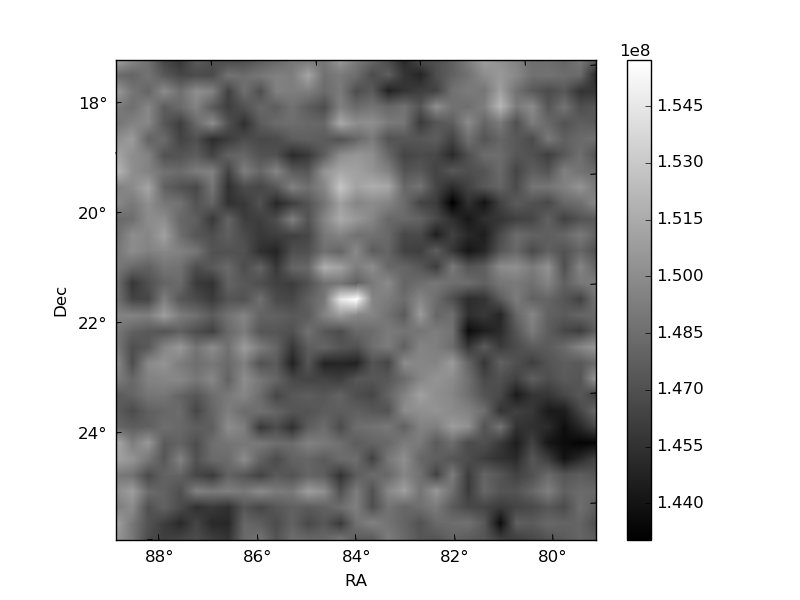
Quadrant B |
|---|---|---|---|
| Quadrant D | 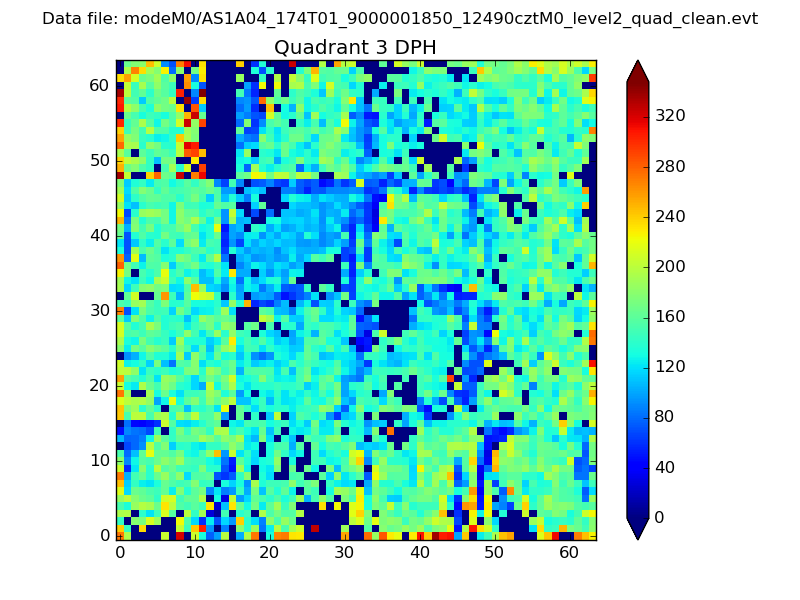 |
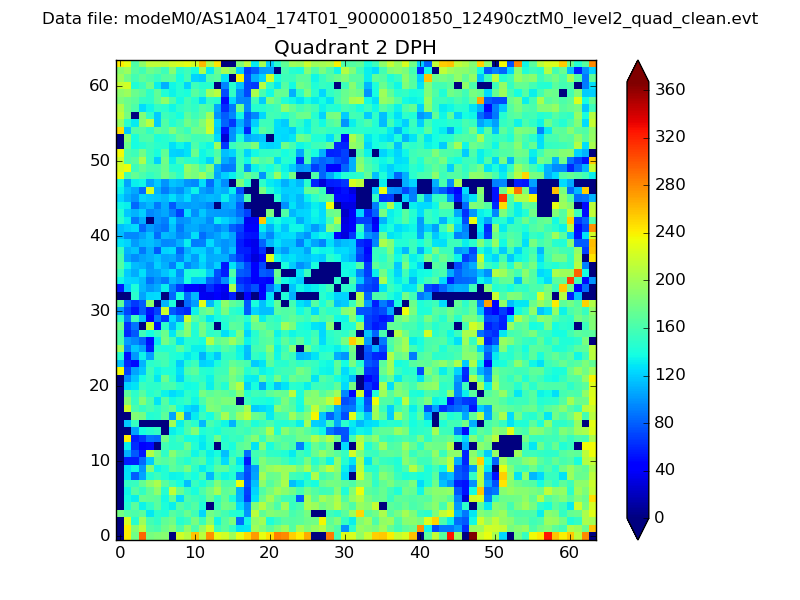 |
Quadrant C |
| Plot type | Count rate plots | Images |
|---|---|---|
| Comparison with Poisson distribution Blue bars denote a histogram of data divided into 1 sec bins. Red curve is a Poisson curve with rate = median count rate of data. |
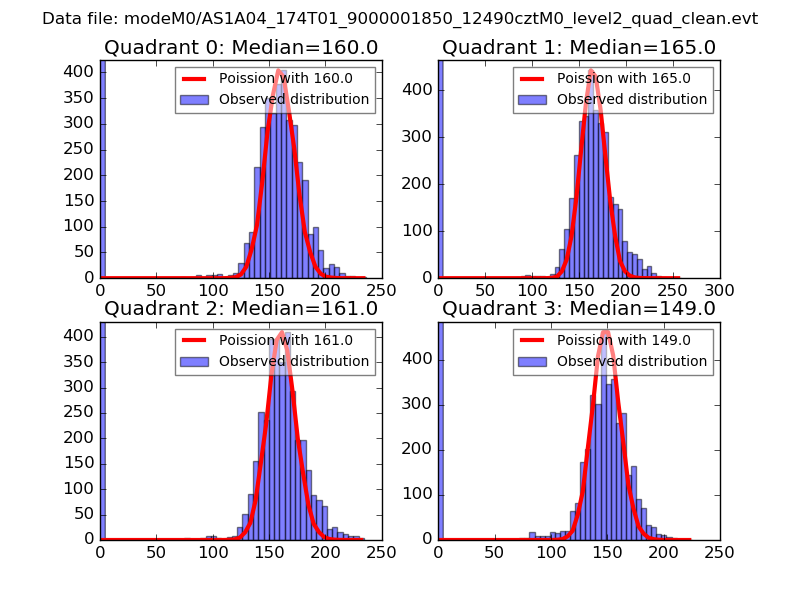 |
 |
| Quadrant-wise count rates Data is divided into 100 sec bins |
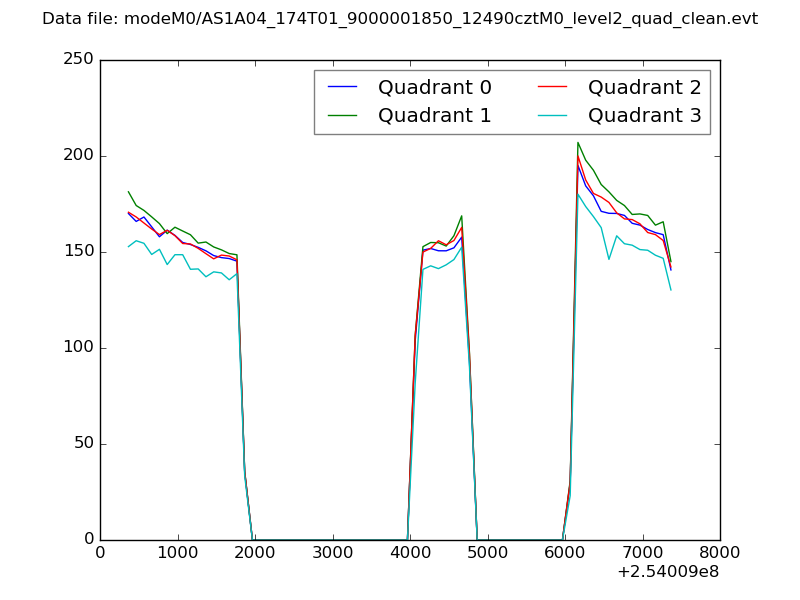 |
|
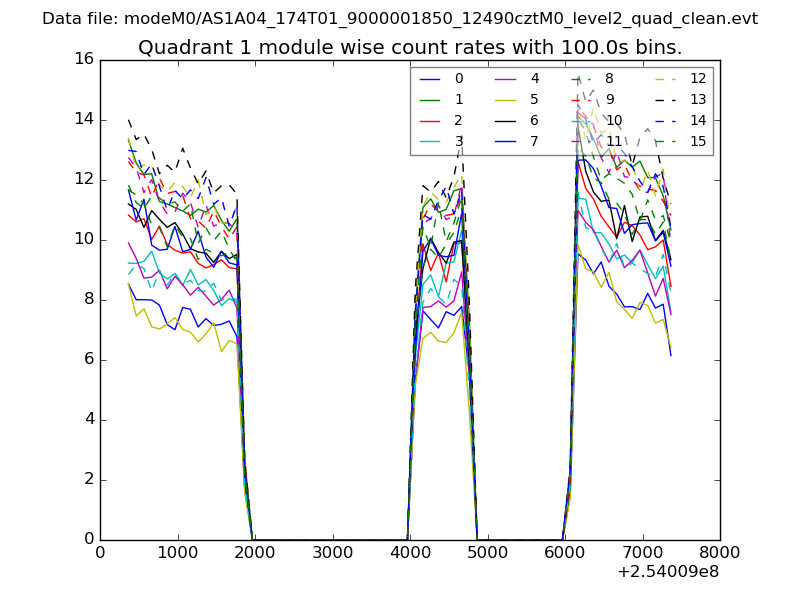
| Module-wise count rates for Quadrant A Data is divided into 100 sec bins |
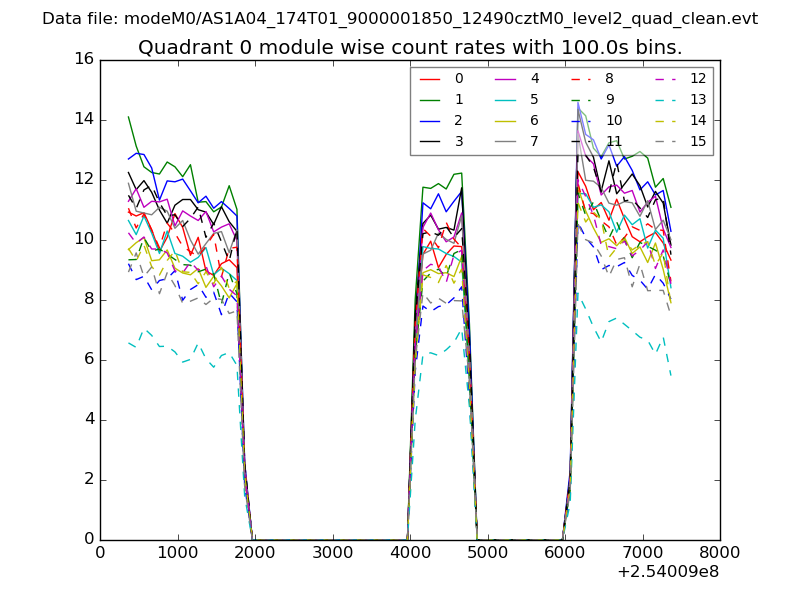 |
 |
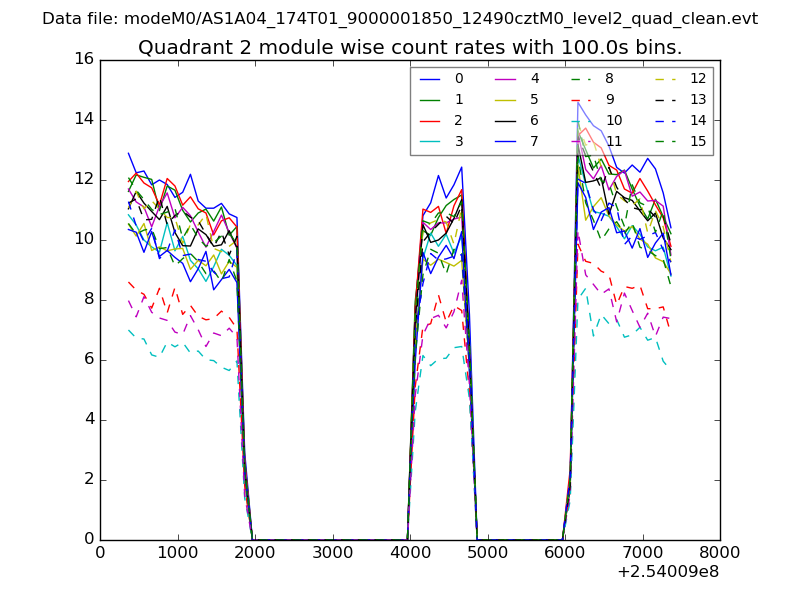
| Module-wise count rates for Quadrant B Data is divided into 100 sec bins |
 |
 |
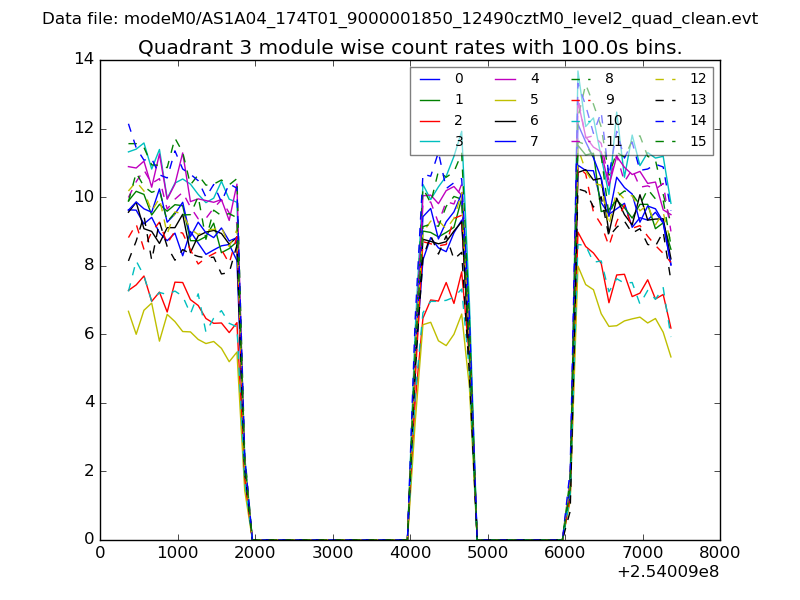
| Module-wise count rates for Quadrant C Data is divided into 100 sec bins |
 |
 |
| Module-wise count rates for Quadrant D Data is divided into 100 sec bins |
 |
 |
| Parameter | Plot |
|---|---|
| CZT HV Monitor | 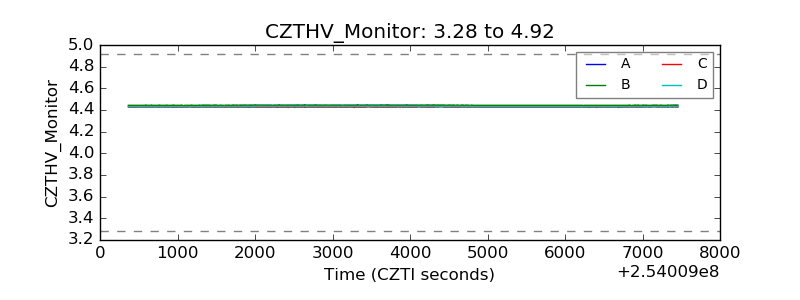 |
| D_VDD | 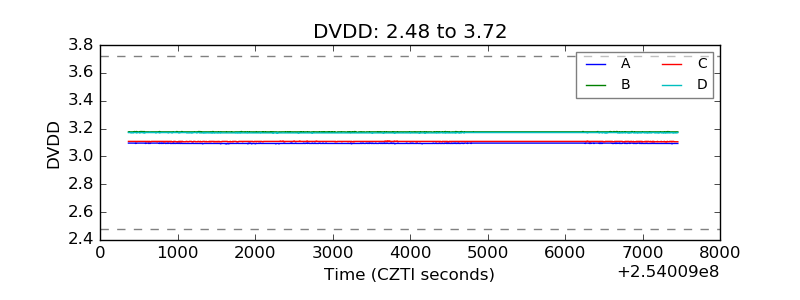 |
| Temperature 1 |  |
| Veto HV Monitor | 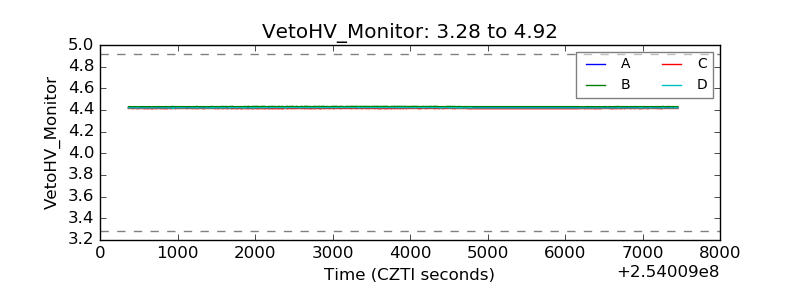 |
| Veto LLD | 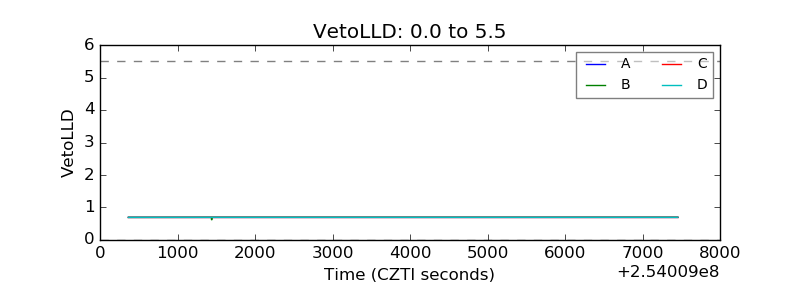 |
| Alpha Counter | 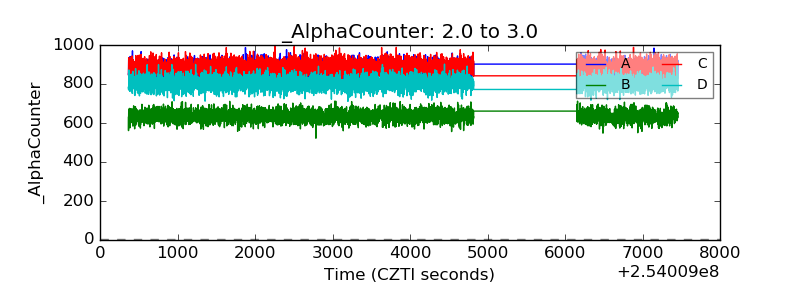 |
| _CPM_Rate | 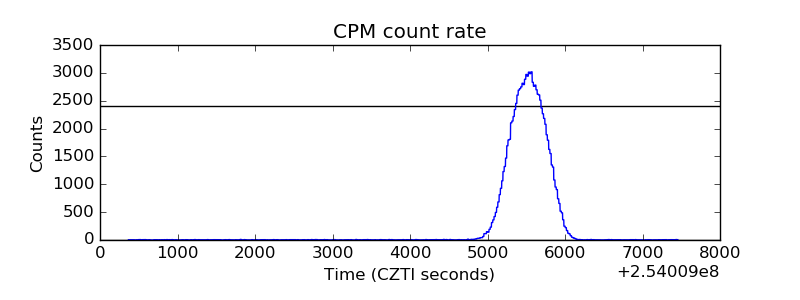 |
| CZT Counter | 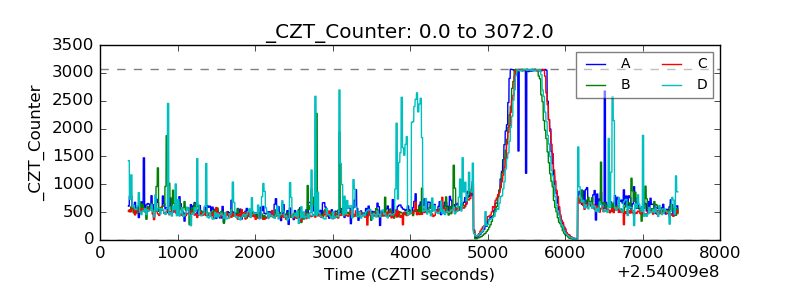 |
| +2.5 Volts monitor |  |
| +5 Volts monitor |  |
| _ROLL_ROT | 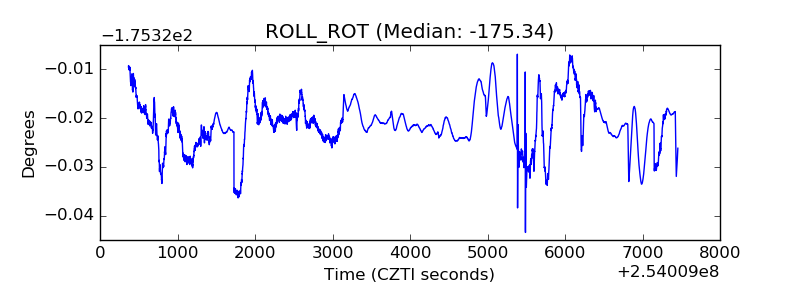 |
| _Roll_DEC | 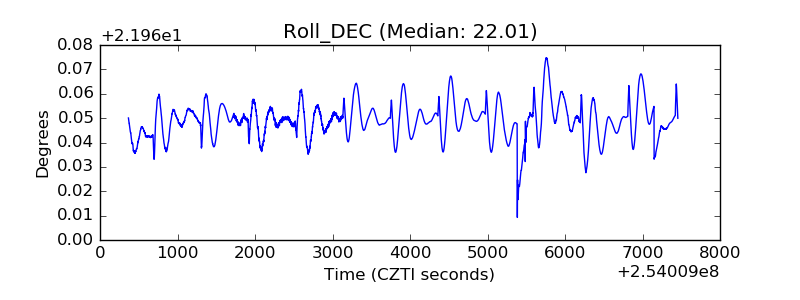 |
| _Roll_RA | 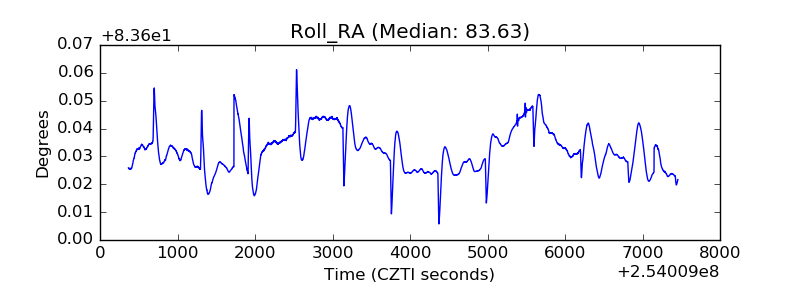 |
| Veto Counter | 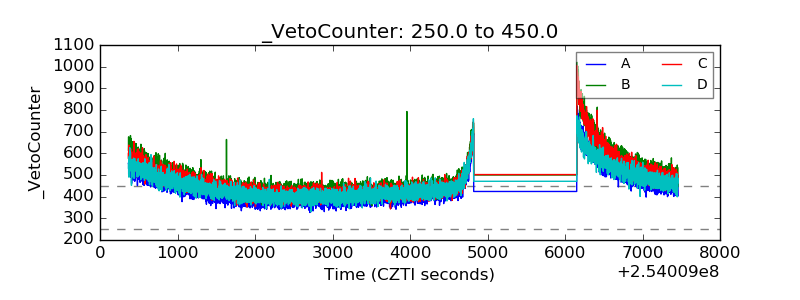 |