| Param | Original file | Final file |
|---|---|---|
| Filename | modeM0/AS1A04_174T01_9000001850_12491cztM0_level2.evt | modeM0/AS1A04_174T01_9000001850_12491cztM0_level2_quad_clean.evt |
| Size (bytes) | 458,579,520 | 90,936,000 |
| Size | 437.3 MB | 86.7 MB |
| Events in quadrant A | 3,534,612 | 588,514 |
| Events in quadrant B | 3,390,357 | 610,612 |
| Events in quadrant C | 2,945,249 | 594,457 |
| Events in quadrant D | 3,619,238 | 549,813 |
| Mode M0 | |||
|---|---|---|---|
| Quadrant | BADHDUFLAG | Total packets | Discarded packets |
| A | 0 | 14445 | 2 |
| B | 0 | 13853 | 1 |
| C | 0 | 12307 | 1 |
| D | 0 | 14757 | 1 |
| Mode M9 | |||
|---|---|---|---|
| Quadrant | BADHDUFLAG | Total packets | Discarded packets |
| A | 0 | 14 | 0 |
| B | 0 | 14 | 0 |
| C | 0 | 14 | 0 |
| D | 0 | 14 | 0 |
| Mode SS | |||
|---|---|---|---|
| Quadrant | BADHDUFLAG | Total packets | Discarded packets |
| A | 0 | 120 | 0 |
| B | 0 | 120 | 0 |
| C | 0 | 120 | 0 |
| D | 0 | 120 | 0 |
| Quadrant | Total seconds | Saturated seconds | Saturation percentage |
|---|---|---|---|
| A | 5873 | 48 | 0.817300% |
| B | 5873 | 80 | 1.362166% |
| C | 5873 | 28 | 0.476758% |
| D | 5873 | 58 | 0.987570% |
Noise dominated data is calculated using 1-second bins in cleaned event files. If a bin has >2000 counts, and if more than 50% of those come from <1% of pixels, then it is considered to be noise-dominated and hence unusable.
| Quadrant | # 1 sec bins | Bins with >0 counts | Bins with >2000 counts | High rate bins dominated by noise | Noise dominated (total time) | Noise dominated (detector-on time) | Marked lightcurve |
|---|---|---|---|---|---|---|---|
| A | 7234 | 5875 | 6 | 6 | 0.08% | 0.10% | 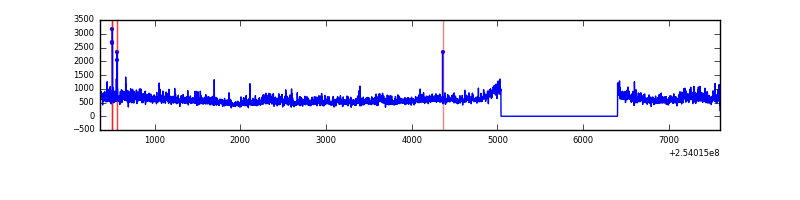 |
| B | 7234 | 5875 | 10 | 10 | 0.14% | 0.17% | 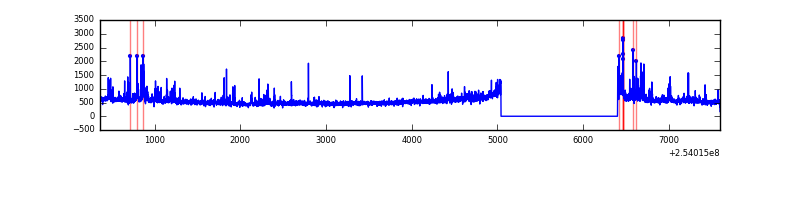 |
| C | 7234 | 5875 | 4 | 4 | 0.06% | 0.07% | 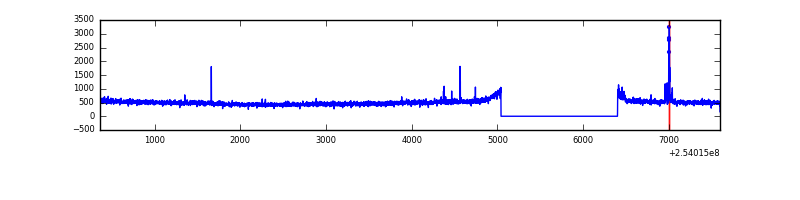 |
| D | 7234 | 5875 | 50 | 50 | 0.69% | 0.85% | 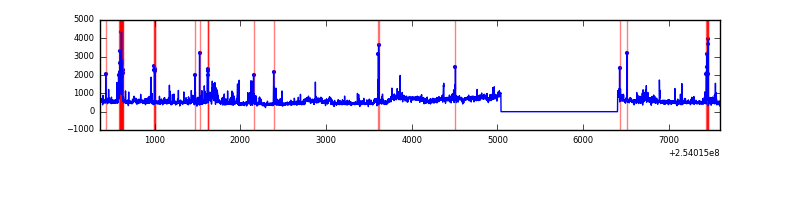 |
Top three noisy pixels from each quadrant. If the there are fewer than three noisy pixels in the level2.evt file, extra rows are filled as -1
| Pixel properties | Quadrant properties | ||||||
|---|---|---|---|---|---|---|---|
| Quadrant | DetID | PixID | Counts | Sigma | Mean | Median | Sigma |
| A | 12 | 189 | 183543 | 1189.97 | 756 | 742 | 153.6 |
| A | 1 | 162 | 138723 | 898.21 | 756 | 742 | 153.6 |
| A | 1 | 178 | 86041 | 555.27 | 756 | 742 | 153.6 |
| B | 4 | 239 | 158063 | 1096.82 | 766 | 749 | 143.4 |
| B | 0 | 219 | 72169 | 497.95 | 766 | 749 | 143.4 |
| B | 0 | 197 | 63599 | 438.2 | 766 | 749 | 143.4 |
| C | 15 | 208 | 53968 | 312.12 | 741 | 751 | 170.5 |
| C | 13 | 61 | 5304 | 26.7 | 741 | 751 | 170.5 |
| C | 14 | 234 | 2327 | 9.24 | 741 | 751 | 170.5 |
| D | 1 | 52 | 608787 | 3465.41 | 726 | 707 | 175.5 |
| D | 8 | 195 | 107141 | 606.56 | 726 | 707 | 175.5 |
| D | 7 | 80 | 67899 | 382.92 | 726 | 707 | 175.5 |
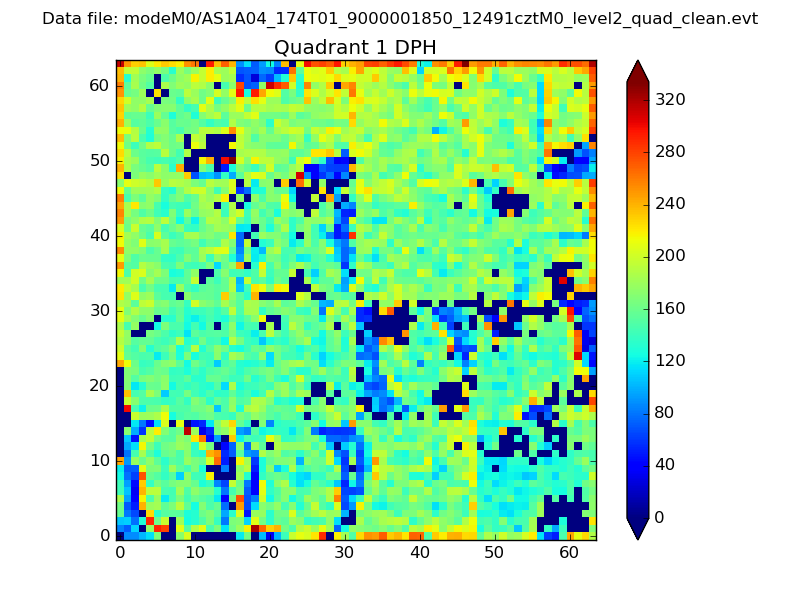
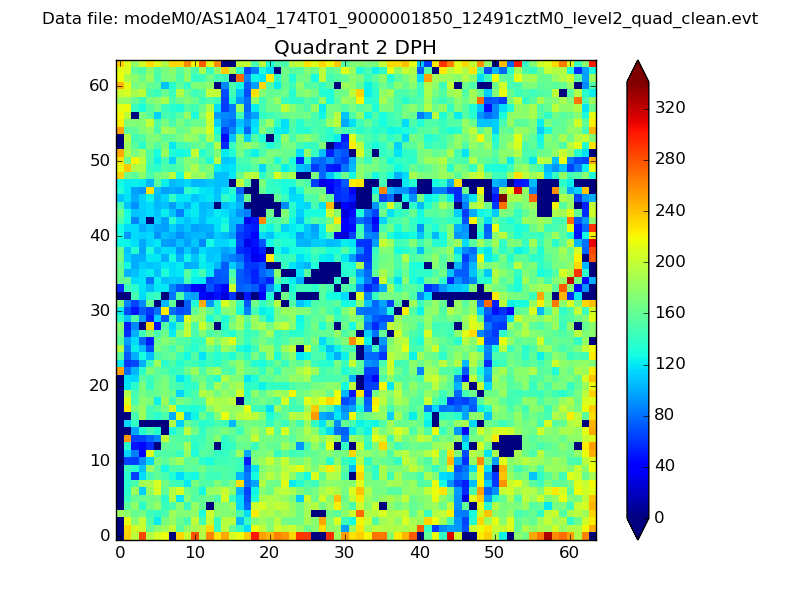
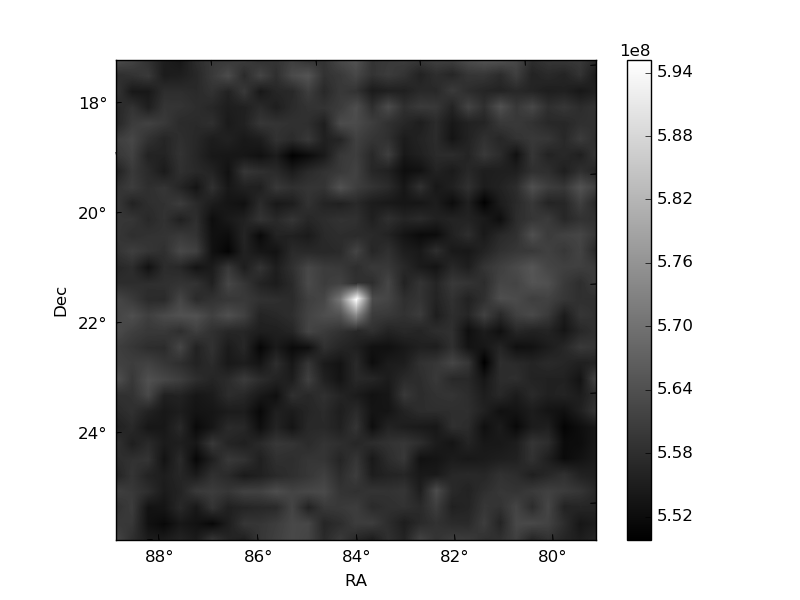
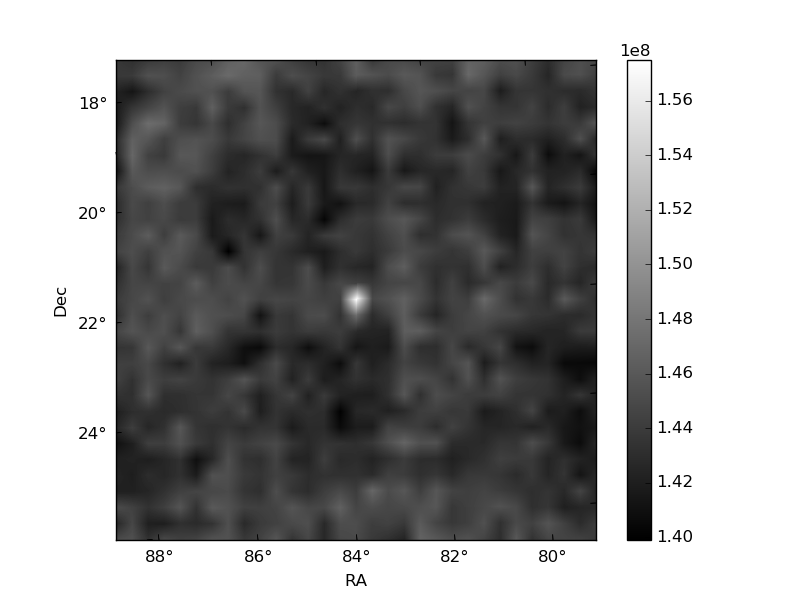
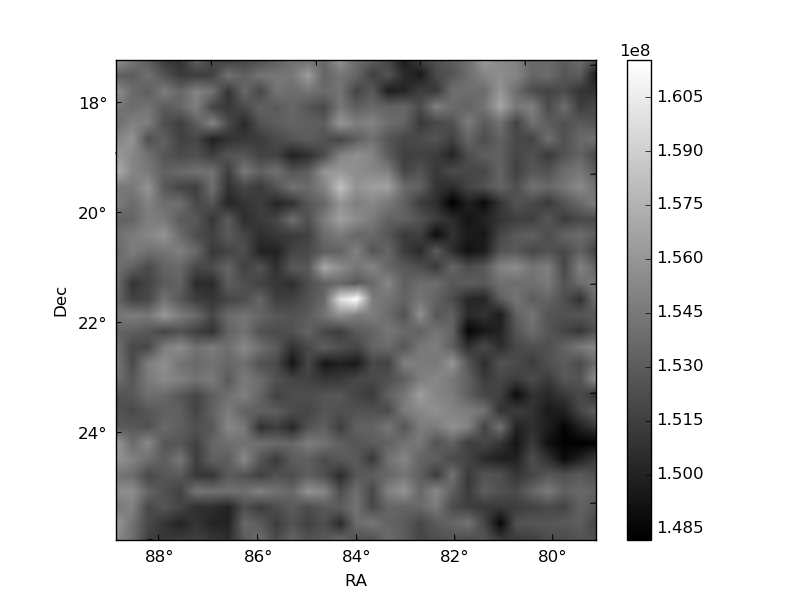
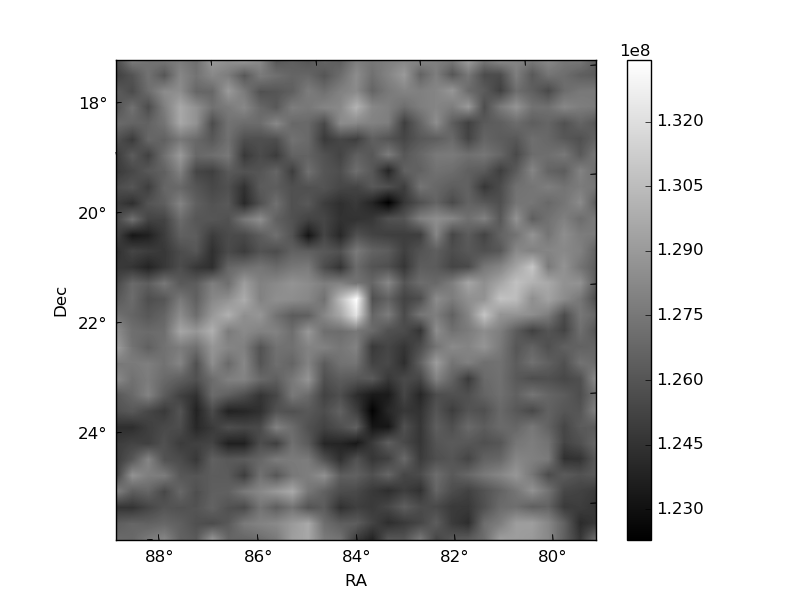
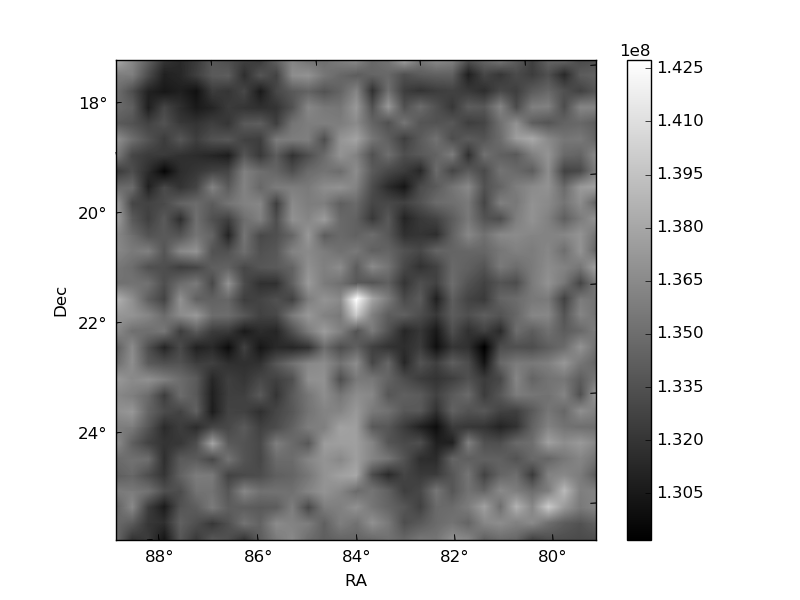
Histogram calculated using DETX and DETY for each event in the final _common_clean file
| Quadrant A |  |
 |
Quadrant B |
|---|---|---|---|
| Quadrant D | 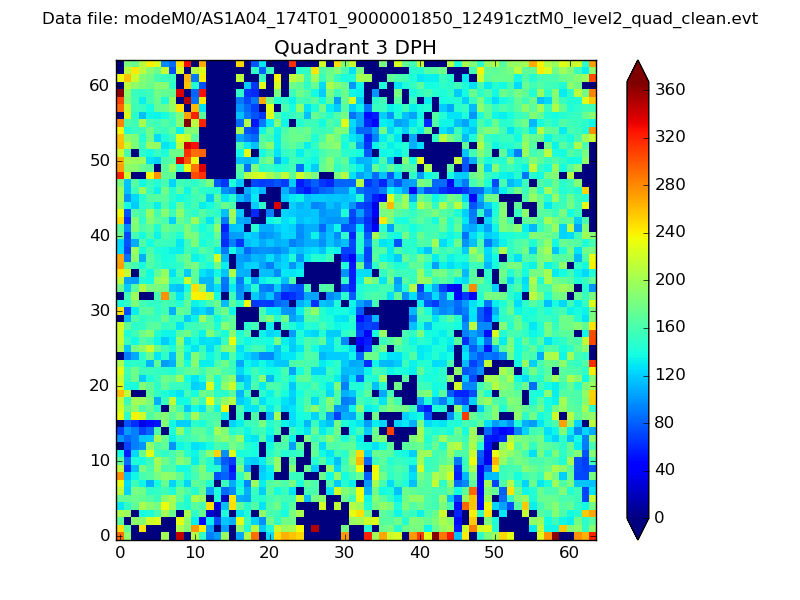 |
 |
Quadrant C |
| Plot type | Count rate plots | Images |
|---|---|---|
| Comparison with Poisson distribution Blue bars denote a histogram of data divided into 1 sec bins. Red curve is a Poisson curve with rate = median count rate of data. |
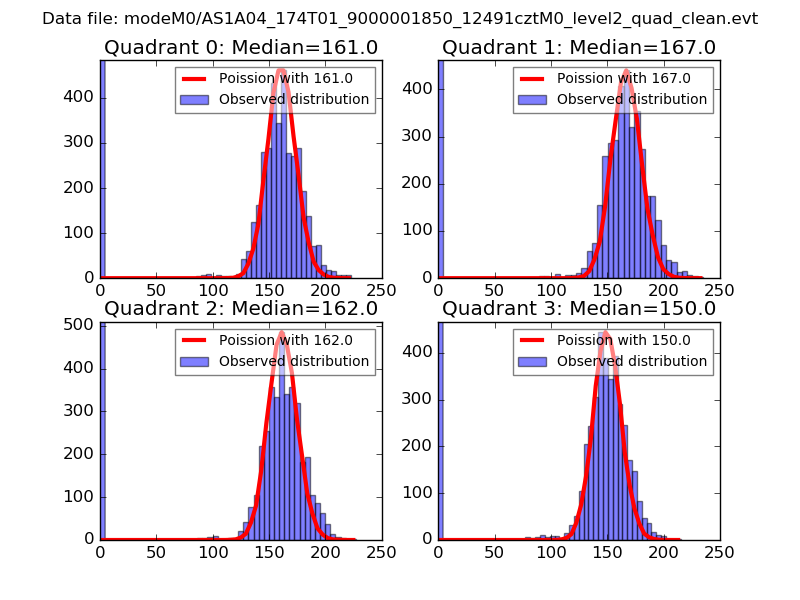 |
 |
| Quadrant-wise count rates Data is divided into 100 sec bins |
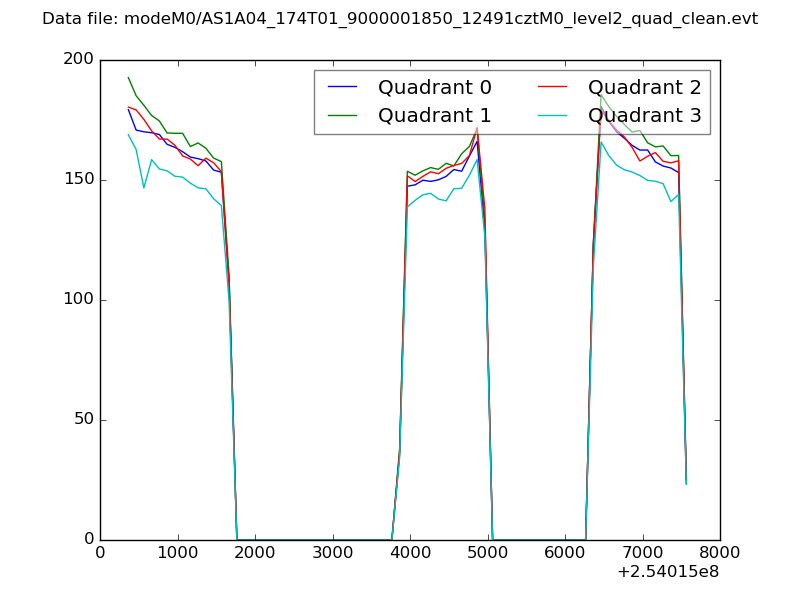 |
|
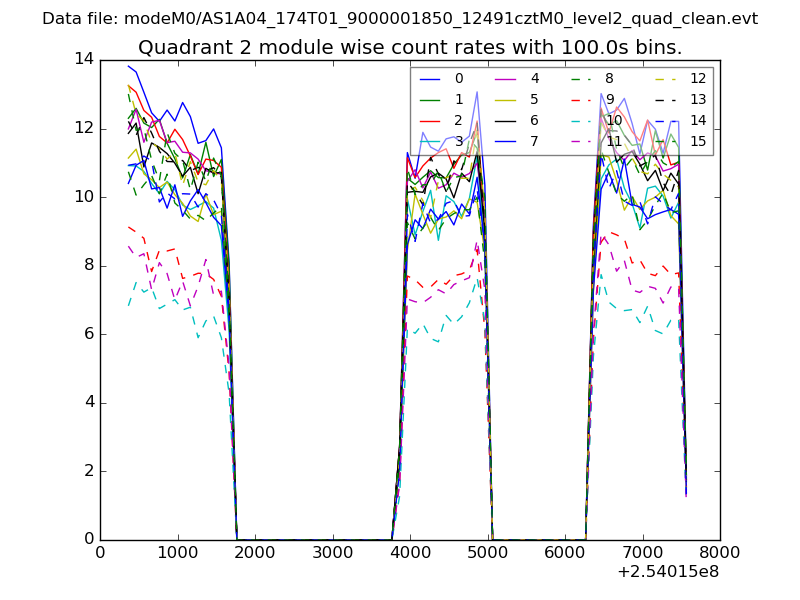
| Module-wise count rates for Quadrant A Data is divided into 100 sec bins |
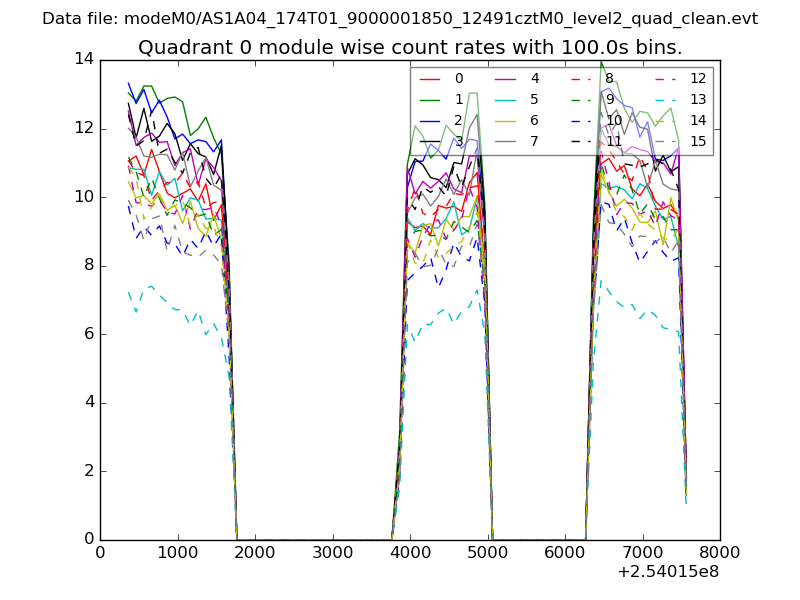 |
 |
| Module-wise count rates for Quadrant B Data is divided into 100 sec bins |
 |
 |
| Module-wise count rates for Quadrant C Data is divided into 100 sec bins |
 |
 |
| Module-wise count rates for Quadrant D Data is divided into 100 sec bins |
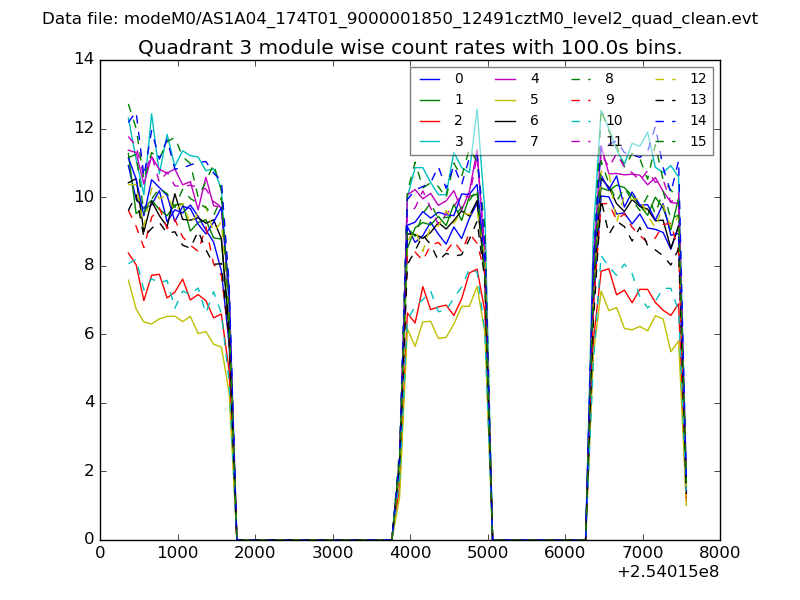 |
 |
| Parameter | Plot |
|---|---|
| CZT HV Monitor | 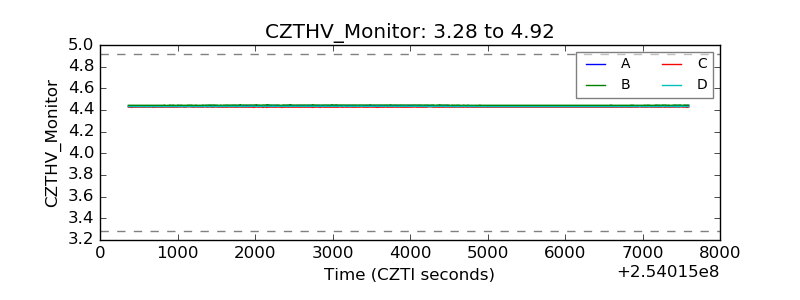 |
| D_VDD | 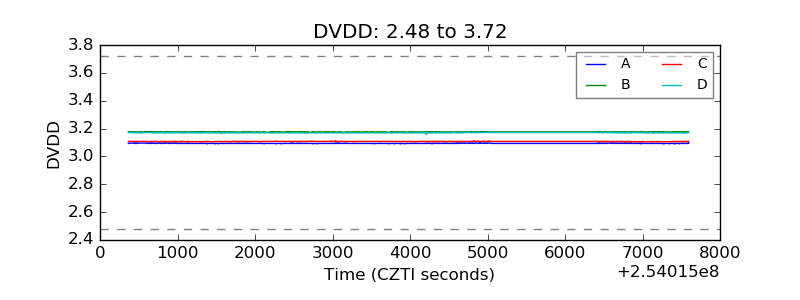 |
| Temperature 1 | 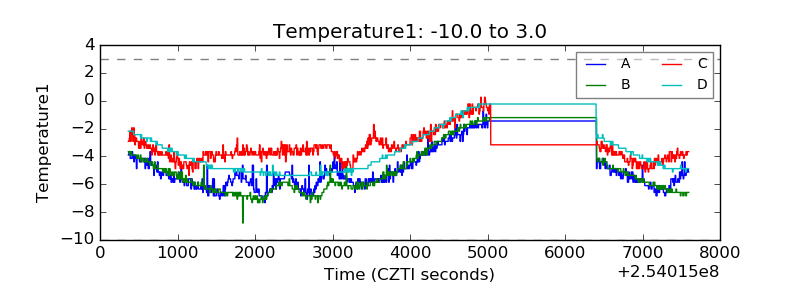 |
| Veto HV Monitor | 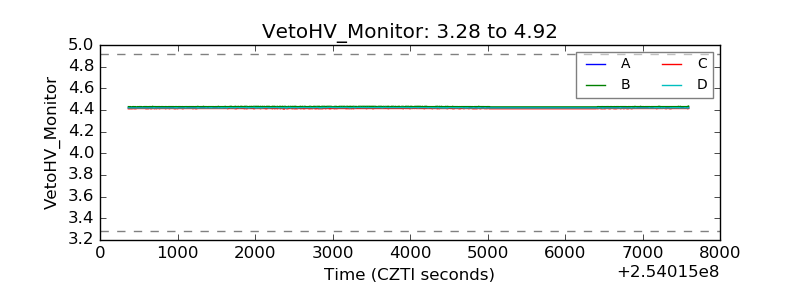 |
| Veto LLD | 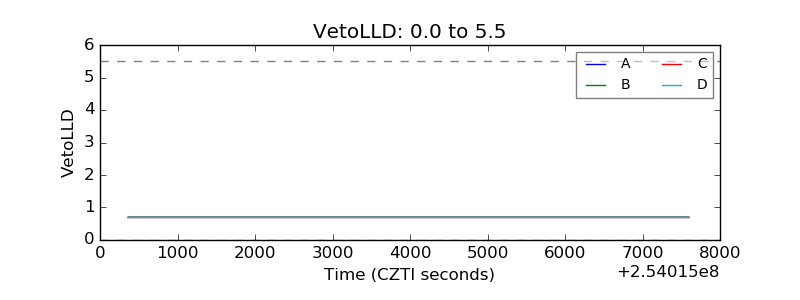 |
| Alpha Counter | 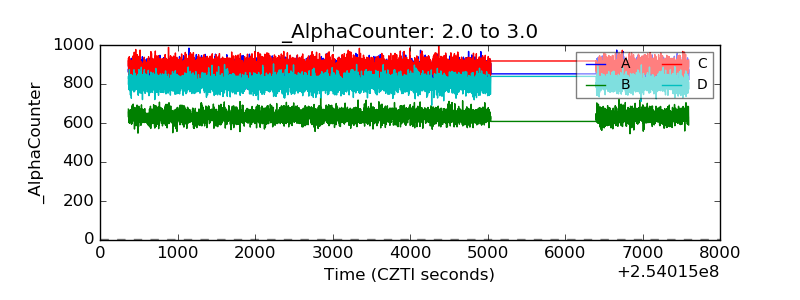 |
| _CPM_Rate | 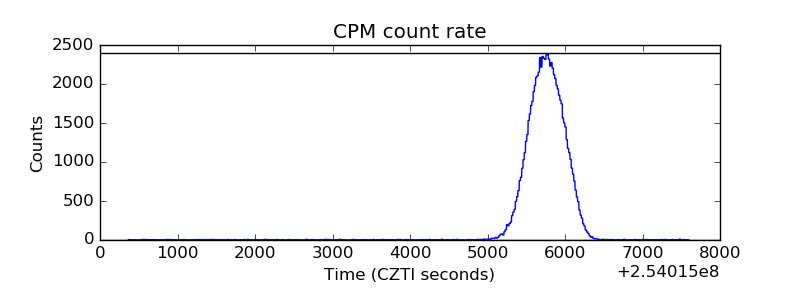 |
| CZT Counter | 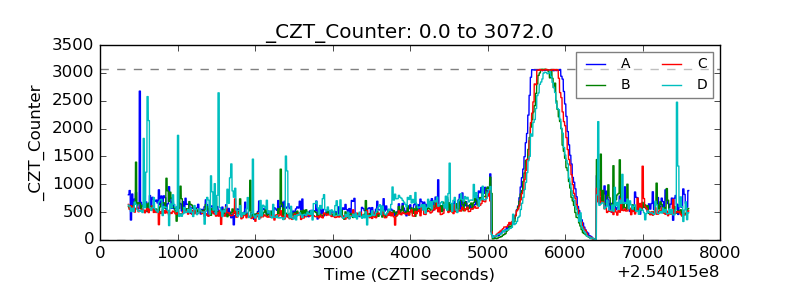 |
| +2.5 Volts monitor |  |
| +5 Volts monitor | 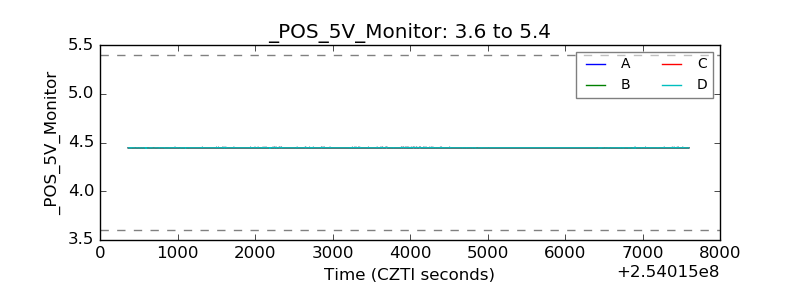 |
| _ROLL_ROT | 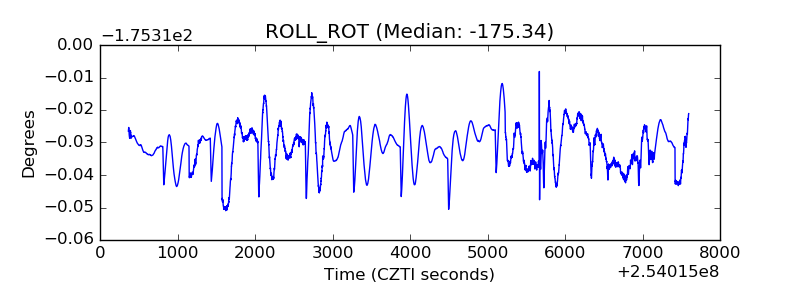 |
| _Roll_DEC | 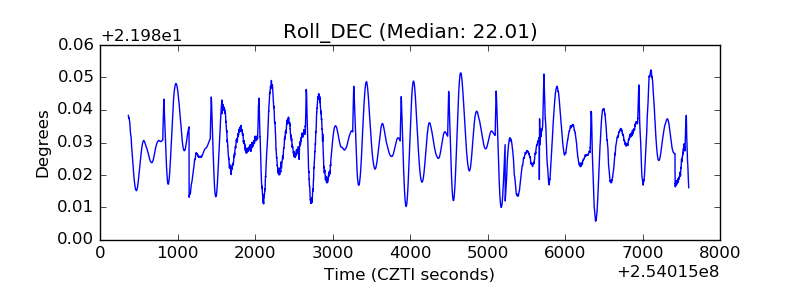 |
| _Roll_RA | 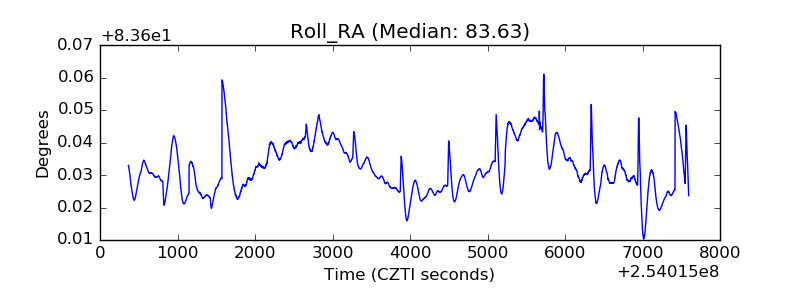 |
| Veto Counter | 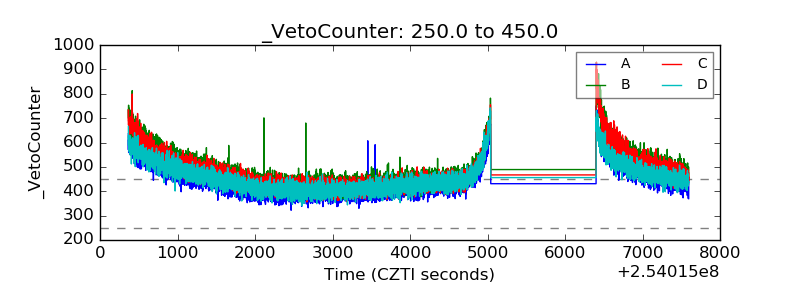 |