| Param | Original file | Final file |
|---|---|---|
| Filename | modeM0/AS1A04_174T01_9000001850_12492cztM0_level2.evt | modeM0/AS1A04_174T01_9000001850_12492cztM0_level2_quad_clean.evt |
| Size (bytes) | 485,130,240 | 86,181,120 |
| Size | 462.7 MB | 82.2 MB |
| Events in quadrant A | 3,611,864 | 553,925 |
| Events in quadrant B | 3,486,573 | 568,786 |
| Events in quadrant C | 3,048,030 | 555,749 |
| Events in quadrant D | 4,131,679 | 505,054 |
| Mode M0 | |||
|---|---|---|---|
| Quadrant | BADHDUFLAG | Total packets | Discarded packets |
| A | 0 | 14755 | 3 |
| B | 0 | 14220 | 2 |
| C | 0 | 12881 | 2 |
| D | 0 | 16290 | 2 |
| Mode M9 | |||
|---|---|---|---|
| Quadrant | BADHDUFLAG | Total packets | Discarded packets |
| A | 0 | 13 | 0 |
| B | 0 | 13 | 0 |
| C | 0 | 13 | 0 |
| D | 0 | 14 | 0 |
| Mode SS | |||
|---|---|---|---|
| Quadrant | BADHDUFLAG | Total packets | Discarded packets |
| A | 0 | 124 | 0 |
| B | 0 | 124 | 0 |
| C | 0 | 124 | 0 |
| D | 0 | 124 | 0 |
| Quadrant | Total seconds | Saturated seconds | Saturation percentage |
|---|---|---|---|
| A | 6104 | 48 | 0.786370% |
| B | 6104 | 94 | 1.539974% |
| C | 6104 | 15 | 0.245740% |
| D | 6104 | 216 | 3.538663% |
Noise dominated data is calculated using 1-second bins in cleaned event files. If a bin has >2000 counts, and if more than 50% of those come from <1% of pixels, then it is considered to be noise-dominated and hence unusable.
| Quadrant | # 1 sec bins | Bins with >0 counts | Bins with >2000 counts | High rate bins dominated by noise | Noise dominated (total time) | Noise dominated (detector-on time) | Marked lightcurve |
|---|---|---|---|---|---|---|---|
| A | 7420 | 6106 | 0 | 0 | 0.00% | 0.00% |  |
| B | 7420 | 6106 | 24 | 24 | 0.32% | 0.39% |  |
| C | 7420 | 6106 | 4 | 4 | 0.05% | 0.07% |  |
| D | 7420 | 6106 | 188 | 188 | 2.53% | 3.08% |  |
Top three noisy pixels from each quadrant. If the there are fewer than three noisy pixels in the level2.evt file, extra rows are filled as -1
| Pixel properties | Quadrant properties | ||||||
|---|---|---|---|---|---|---|---|
| Quadrant | DetID | PixID | Counts | Sigma | Mean | Median | Sigma |
| A | 12 | 189 | 234679 | 1490.68 | 774 | 760 | 156.9 |
| A | 1 | 162 | 135672 | 859.74 | 774 | 760 | 156.9 |
| A | 1 | 178 | 83214 | 525.45 | 774 | 760 | 156.9 |
| B | 4 | 239 | 152836 | 1038.71 | 785 | 767 | 146.4 |
| B | 11 | 51 | 70273 | 474.76 | 785 | 767 | 146.4 |
| B | 0 | 219 | 64421 | 434.79 | 785 | 767 | 146.4 |
| C | 15 | 208 | 82401 | 466.98 | 759 | 769 | 174.8 |
| C | 13 | 61 | 5568 | 27.45 | 759 | 769 | 174.8 |
| C | 3 | 233 | 4003 | 18.5 | 759 | 769 | 174.8 |
| D | 1 | 52 | 690971 | 3888.12 | 733 | 716 | 177.5 |
| D | 7 | 80 | 411864 | 2315.95 | 733 | 716 | 177.5 |
| D | 8 | 195 | 104908 | 586.9 | 733 | 716 | 177.5 |
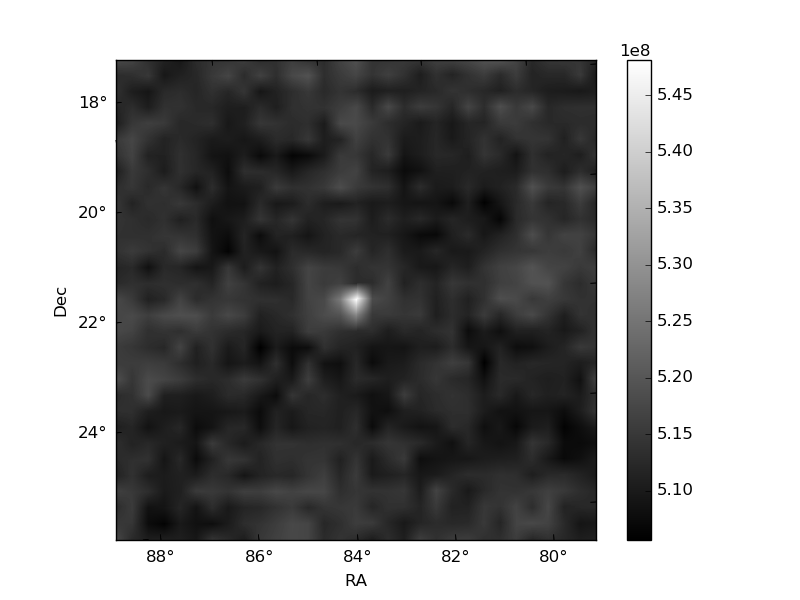
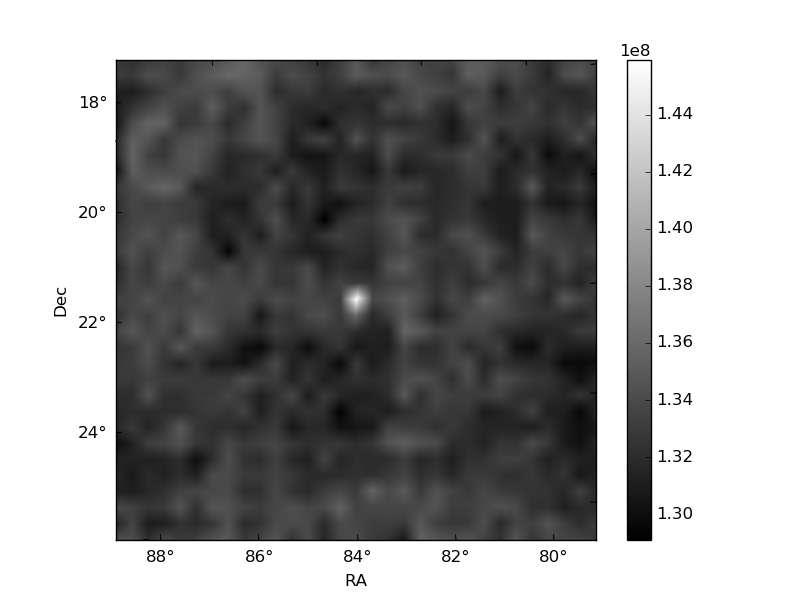
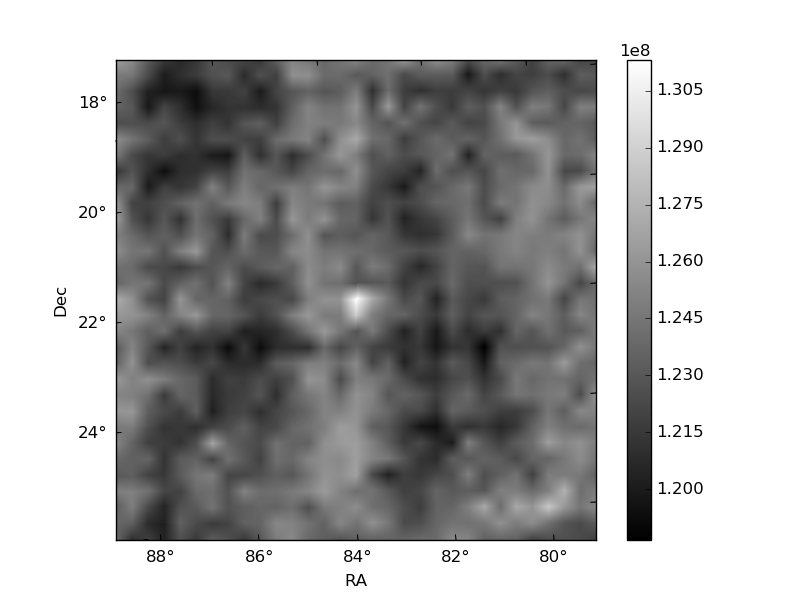
Histogram calculated using DETX and DETY for each event in the final _common_clean file
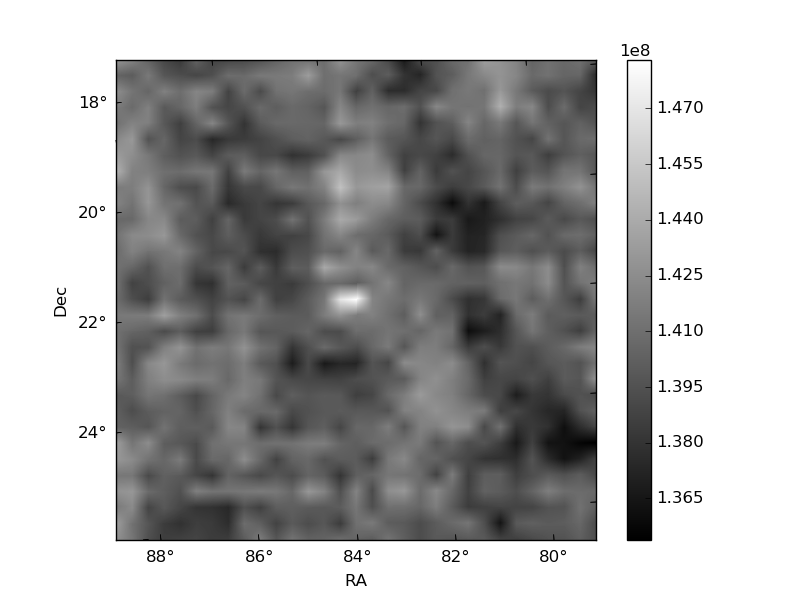
| Quadrant A | 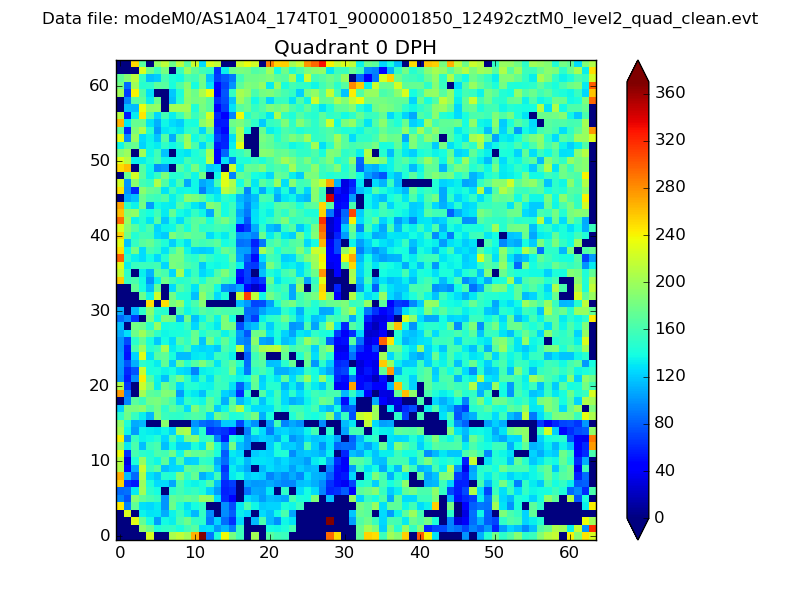 |
 |
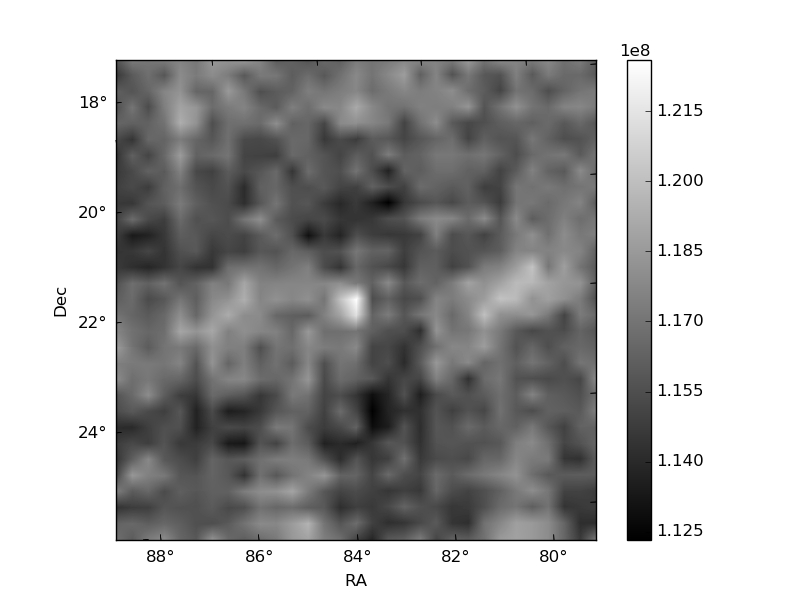
Quadrant B |
|---|---|---|---|
| Quadrant D | 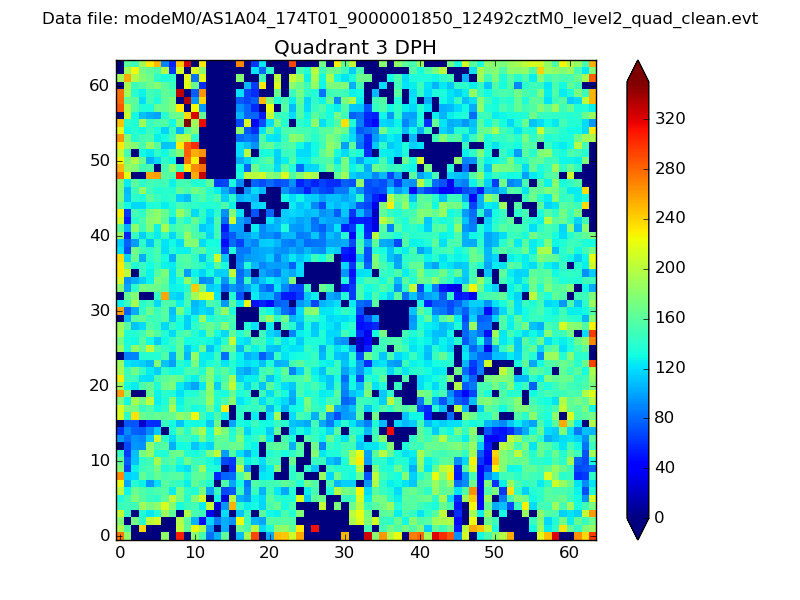 |
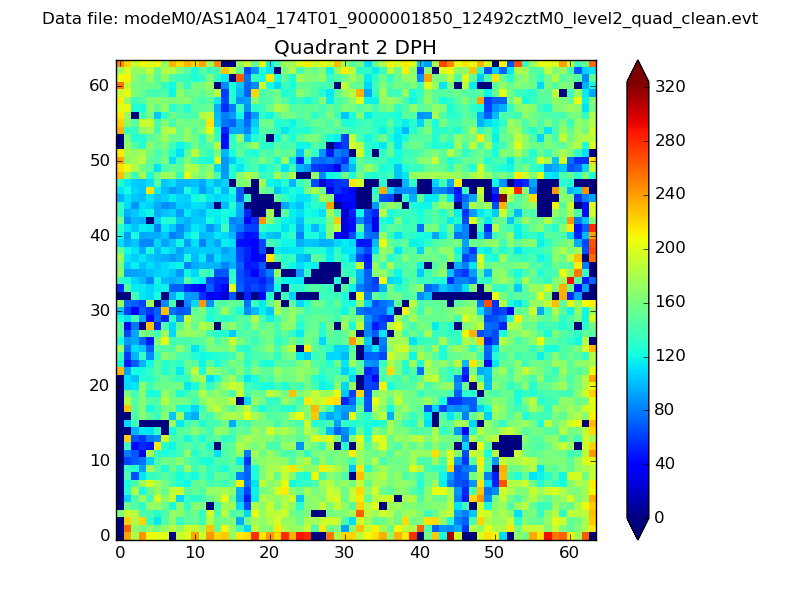 |
Quadrant C |
| Plot type | Count rate plots | Images |
|---|---|---|
| Comparison with Poisson distribution Blue bars denote a histogram of data divided into 1 sec bins. Red curve is a Poisson curve with rate = median count rate of data. |
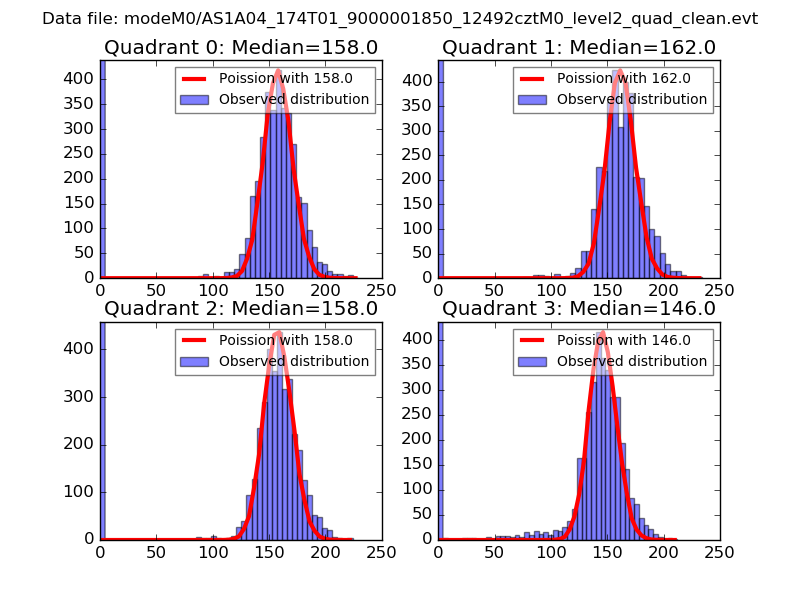 |
 |
| Quadrant-wise count rates Data is divided into 100 sec bins |
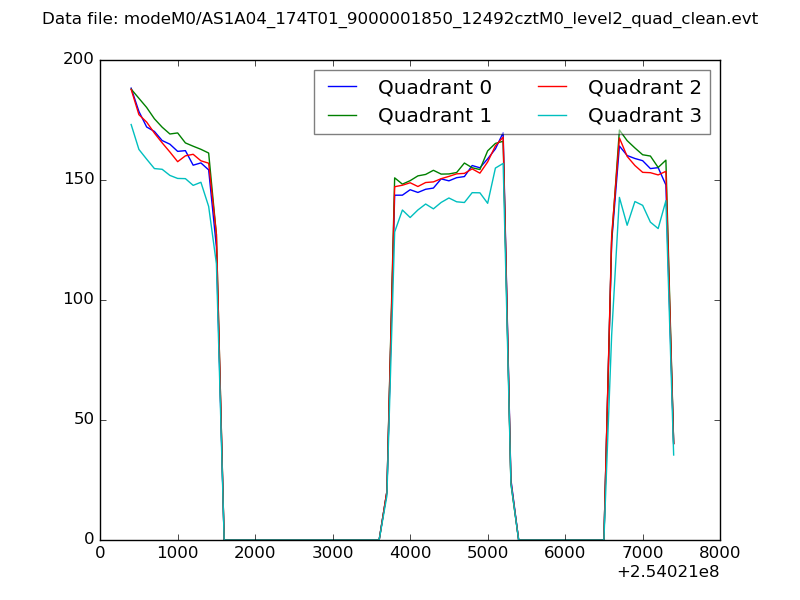 |
|
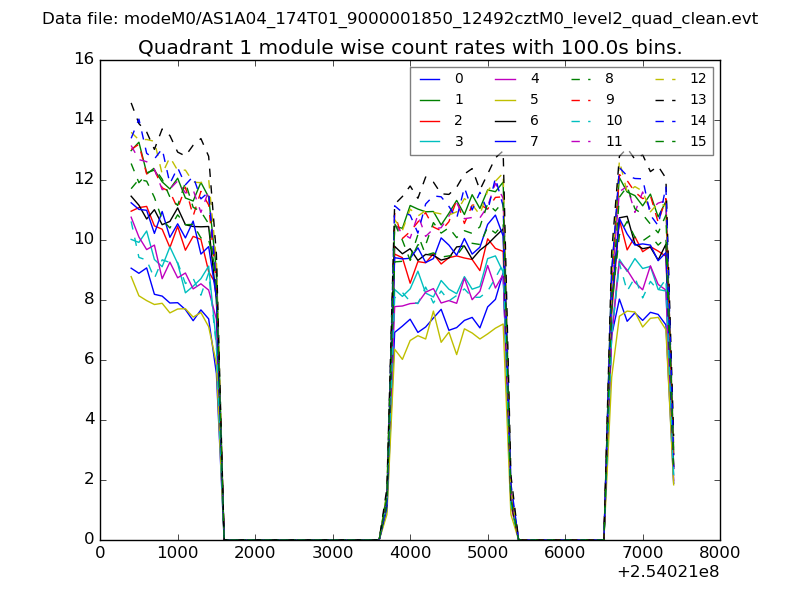
| Module-wise count rates for Quadrant A Data is divided into 100 sec bins |
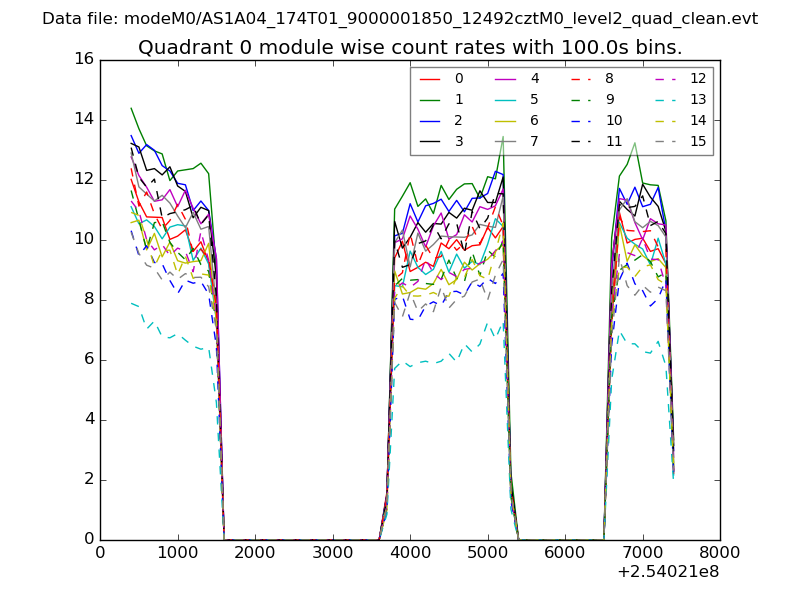 |
 |
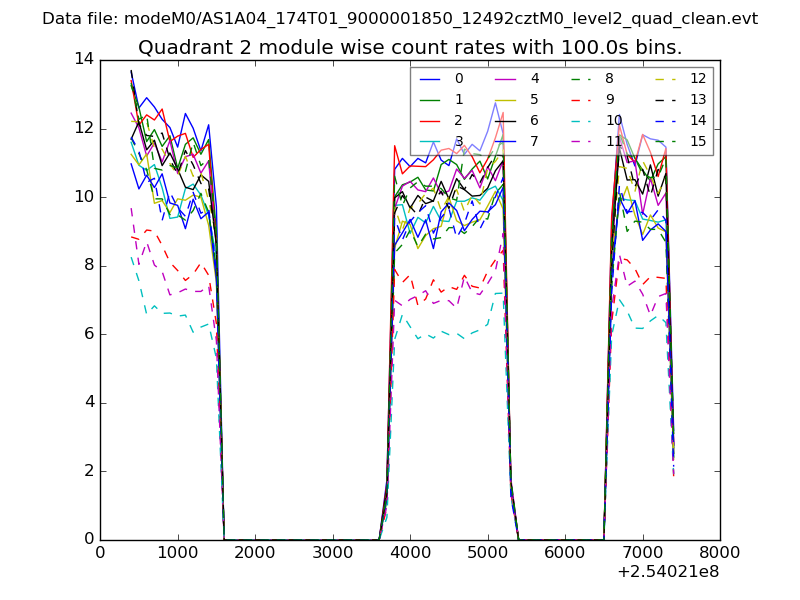
| Module-wise count rates for Quadrant B Data is divided into 100 sec bins |
 |
 |
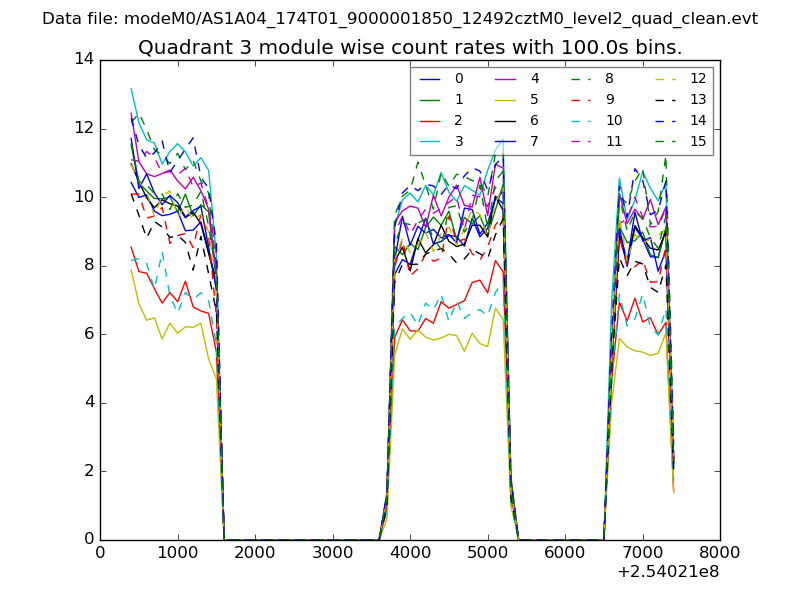
| Module-wise count rates for Quadrant C Data is divided into 100 sec bins |
 |
 |
| Module-wise count rates for Quadrant D Data is divided into 100 sec bins |
 |
 |
| Parameter | Plot |
|---|---|
| CZT HV Monitor | 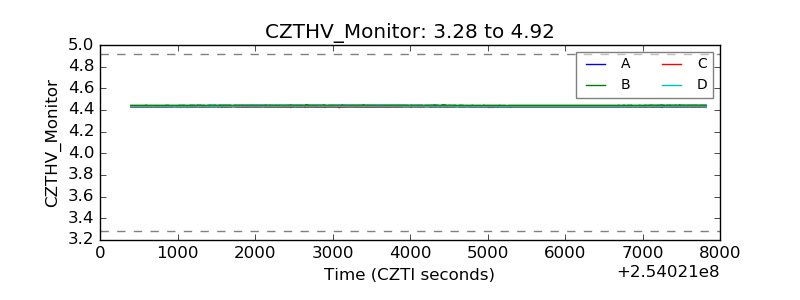 |
| D_VDD | 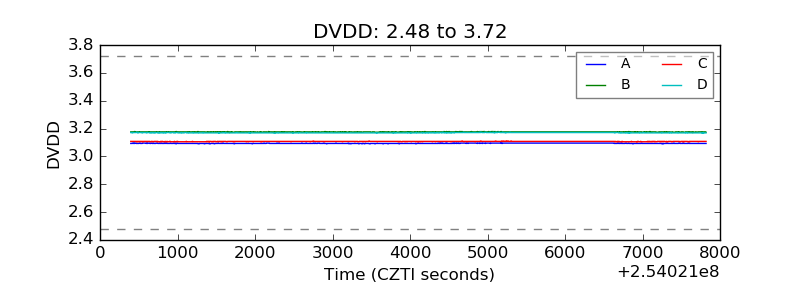 |
| Temperature 1 | 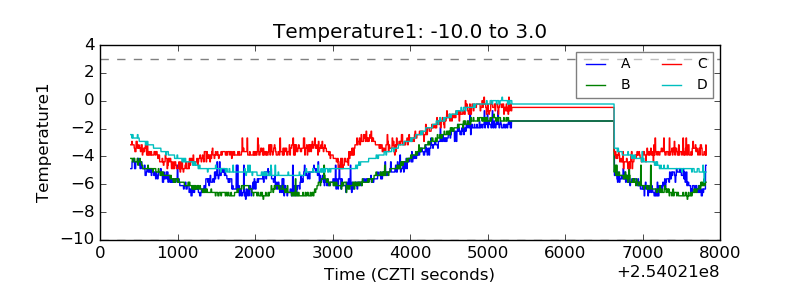 |
| Veto HV Monitor | 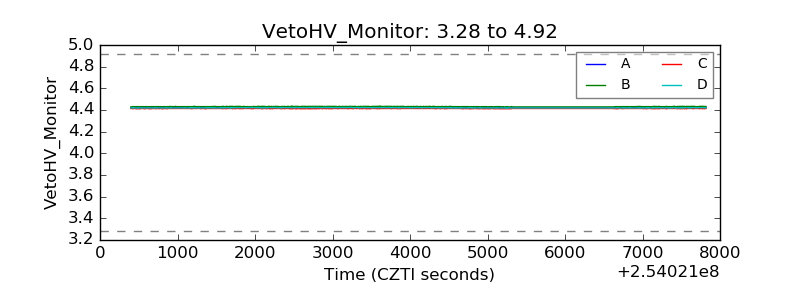 |
| Veto LLD |  |
| Alpha Counter | 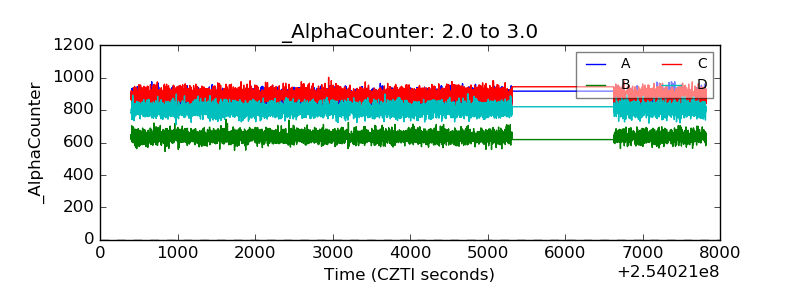 |
| _CPM_Rate | 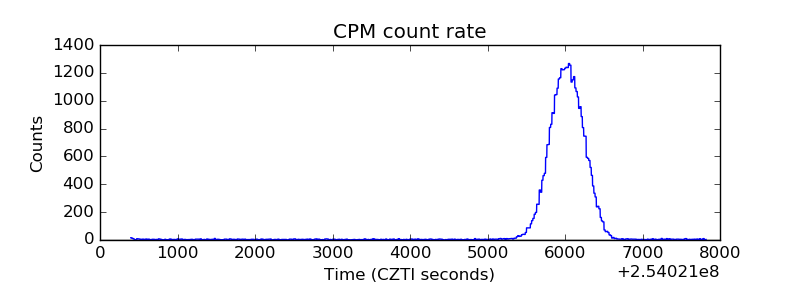 |
| CZT Counter | 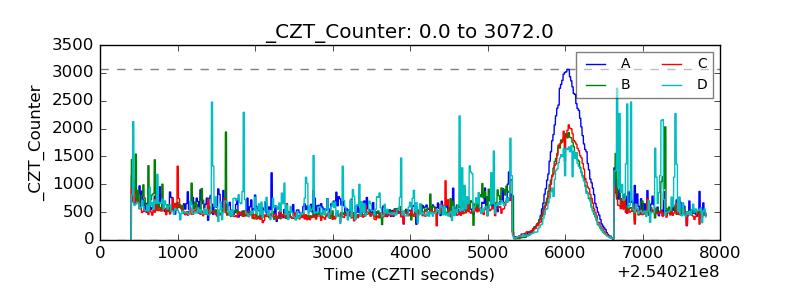 |
| +2.5 Volts monitor |  |
| +5 Volts monitor |  |
| _ROLL_ROT | 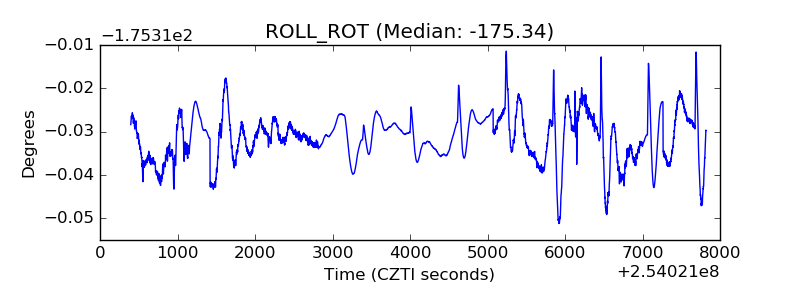 |
| _Roll_DEC | 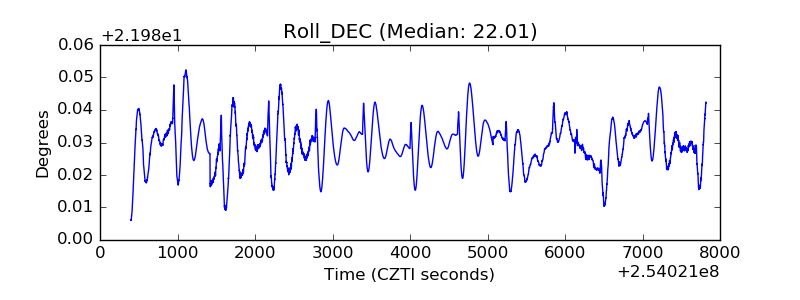 |
| _Roll_RA | 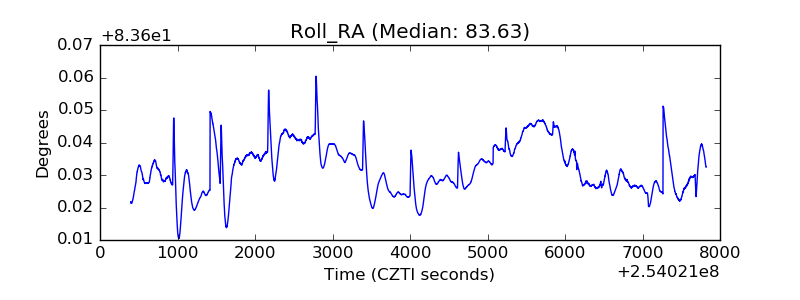 |
| Veto Counter | 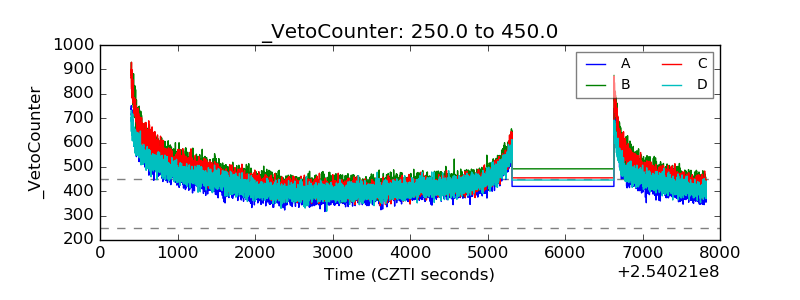 |