| Param | Original file | Final file |
|---|---|---|
| Filename | modeM0/AS1A04_174T01_9000001850_12495cztM0_level2.evt | modeM0/AS1A04_174T01_9000001850_12495cztM0_level2_quad_clean.evt |
| Size (bytes) | 567,221,760 | 83,727,360 |
| Size | 540.9 MB | 79.8 MB |
| Events in quadrant A | 4,334,621 | 505,472 |
| Events in quadrant B | 3,954,369 | 516,954 |
| Events in quadrant C | 3,605,233 | 513,272 |
| Events in quadrant D | 4,771,632 | 473,984 |
| Mode M0 | |||
|---|---|---|---|
| Quadrant | BADHDUFLAG | Total packets | Discarded packets |
| A | 0 | 17802 | 2 |
| B | 0 | 16443 | 1 |
| C | 0 | 15747 | 1 |
| D | 0 | 19234 | 1 |
| Mode M9 | |||
|---|---|---|---|
| Quadrant | BADHDUFLAG | Total packets | Discarded packets |
| A | 0 | 2 | 0 |
| B | 0 | 2 | 0 |
| C | 0 | 2 | 0 |
| D | 0 | 2 | 0 |
| Mode SS | |||
|---|---|---|---|
| Quadrant | BADHDUFLAG | Total packets | Discarded packets |
| A | 0 | 152 | 0 |
| B | 0 | 152 | 0 |
| C | 0 | 152 | 0 |
| D | 0 | 152 | 0 |
| Quadrant | Total seconds | Saturated seconds | Saturation percentage |
|---|---|---|---|
| A | 7566 | 282 | 3.727201% |
| B | 7566 | 321 | 4.242665% |
| C | 7566 | 166 | 2.194026% |
| D | 7566 | 309 | 4.084060% |
Noise dominated data is calculated using 1-second bins in cleaned event files. If a bin has >2000 counts, and if more than 50% of those come from <1% of pixels, then it is considered to be noise-dominated and hence unusable.
| Quadrant | # 1 sec bins | Bins with >0 counts | Bins with >2000 counts | High rate bins dominated by noise | Noise dominated (total time) | Noise dominated (detector-on time) | Marked lightcurve |
|---|---|---|---|---|---|---|---|
| A | 7637 | 7568 | 0 | 0 | 0.00% | 0.00% | 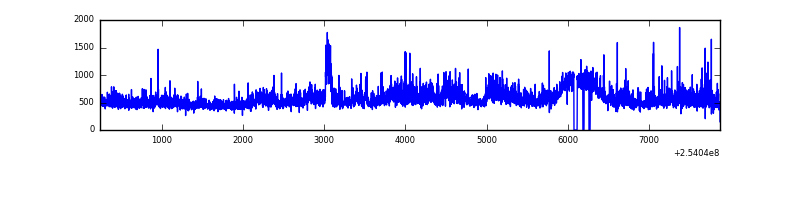 |
| B | 7637 | 7570 | 21 | 21 | 0.27% | 0.28% |  |
| C | 7637 | 7570 | 0 | 0 | 0.00% | 0.00% |  |
| D | 7637 | 7570 | 72 | 72 | 0.94% | 0.95% | 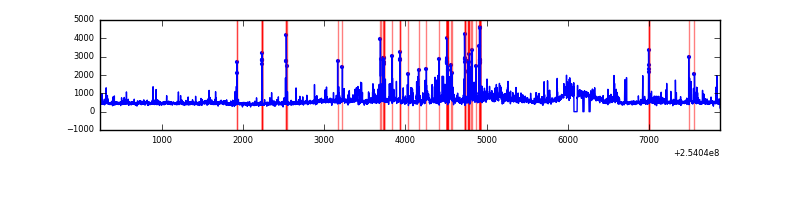 |
Top three noisy pixels from each quadrant. If the there are fewer than three noisy pixels in the level2.evt file, extra rows are filled as -1
| Pixel properties | Quadrant properties | ||||||
|---|---|---|---|---|---|---|---|
| Quadrant | DetID | PixID | Counts | Sigma | Mean | Median | Sigma |
| A | 12 | 189 | 215947 | 1120.73 | 931 | 911 | 191.9 |
| A | 1 | 162 | 160364 | 831.04 | 931 | 911 | 191.9 |
| A | 1 | 178 | 94392 | 487.21 | 931 | 911 | 191.9 |
| B | 4 | 239 | 226732 | 1239.29 | 939 | 917 | 182.2 |
| B | 0 | 214 | 22809 | 120.15 | 939 | 917 | 182.2 |
| B | 12 | 111 | 21070 | 110.6 | 939 | 917 | 182.2 |
| C | 14 | 234 | 7047 | 28.39 | 922 | 930 | 215.5 |
| C | 13 | 61 | 6736 | 26.95 | 922 | 930 | 215.5 |
| C | 8 | 222 | 2579 | 7.65 | 922 | 930 | 215.5 |
| D | 1 | 52 | 969836 | 4420.21 | 900 | 875 | 219.2 |
| D | 13 | 104 | 100005 | 452.21 | 900 | 875 | 219.2 |
| D | 7 | 71 | 90049 | 406.79 | 900 | 875 | 219.2 |
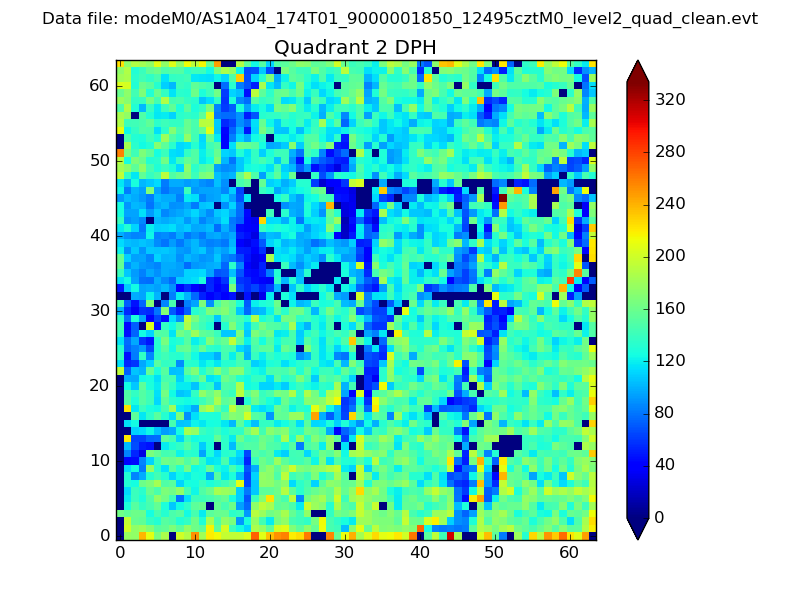
Histogram calculated using DETX and DETY for each event in the final _common_clean file
| Quadrant A | 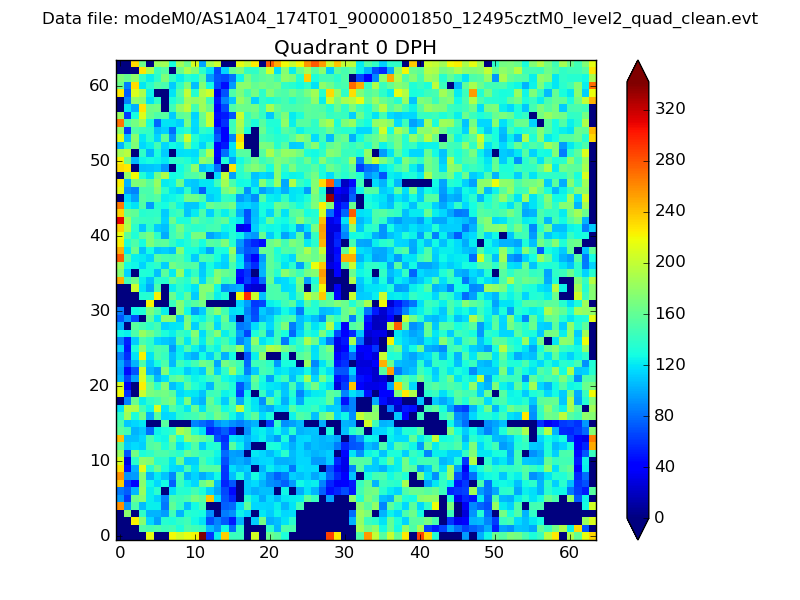 |
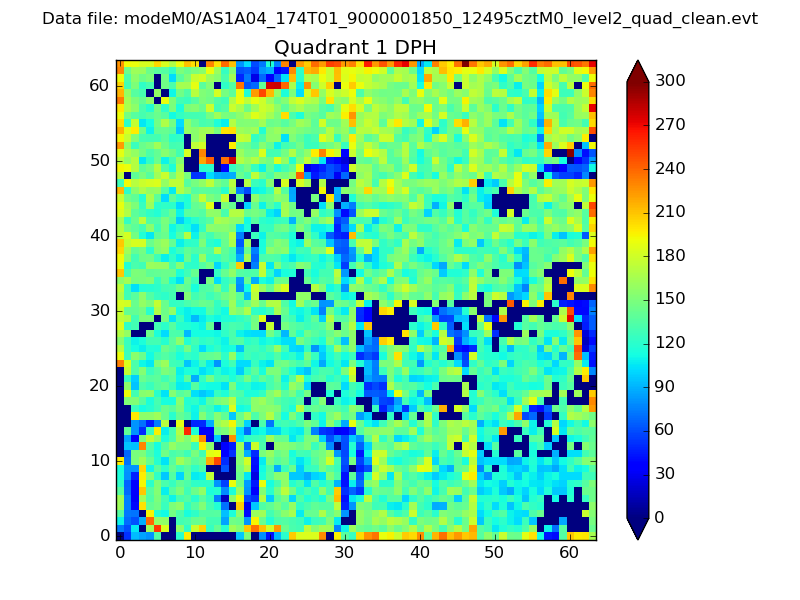 |
Quadrant B |
|---|---|---|---|
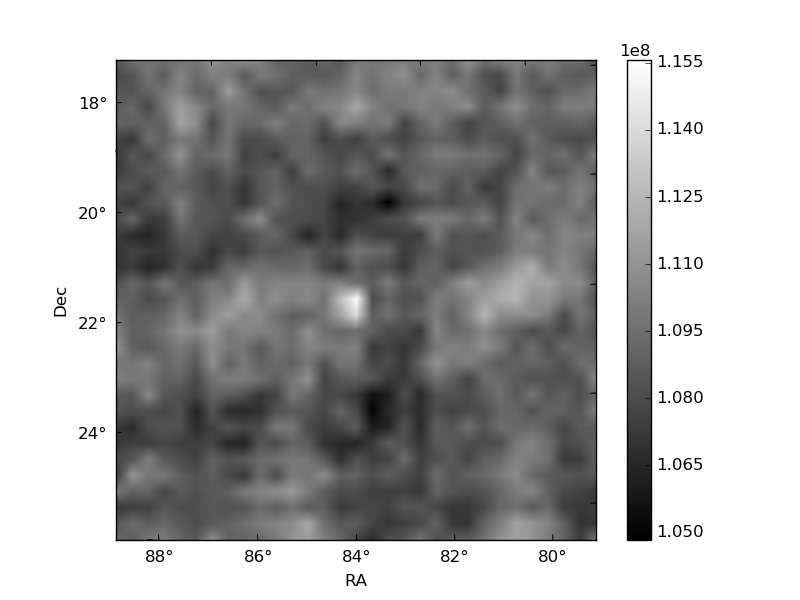
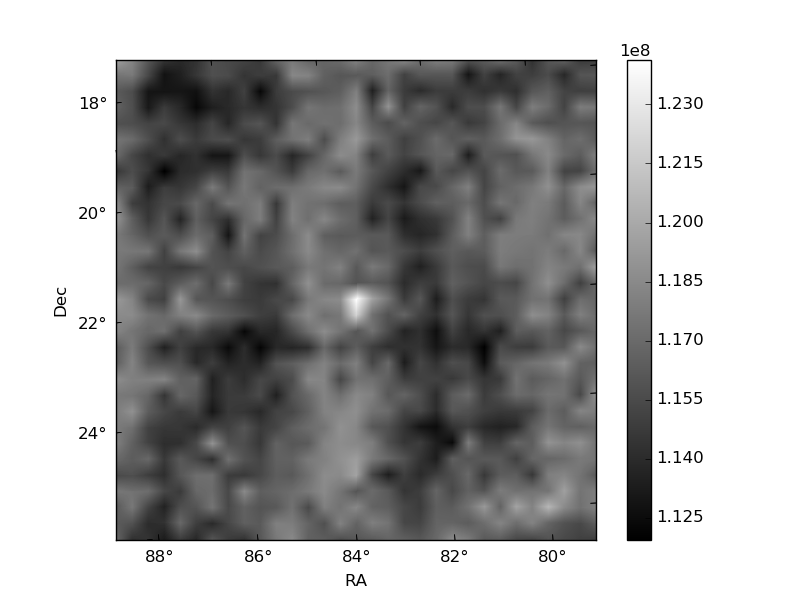
| Quadrant D | 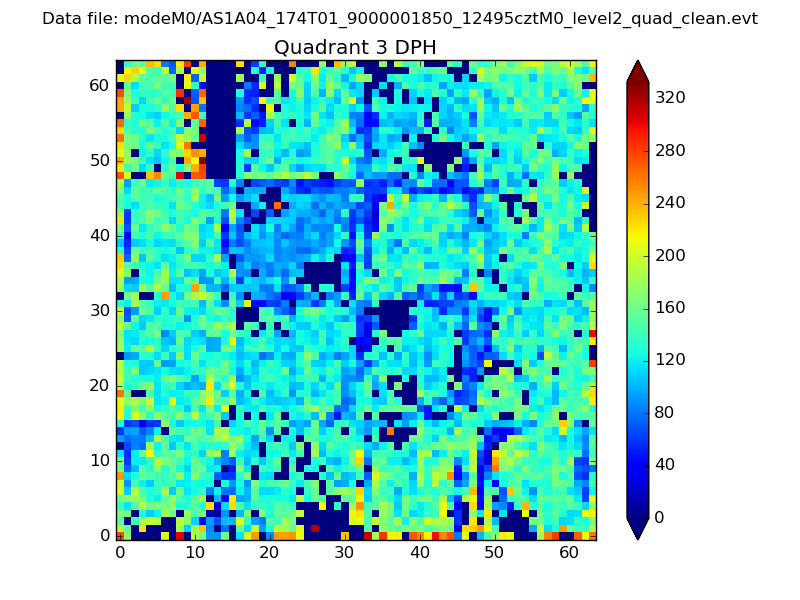 |
 |
Quadrant C |
| Plot type | Count rate plots | Images |
|---|---|---|
| Comparison with Poisson distribution Blue bars denote a histogram of data divided into 1 sec bins. Red curve is a Poisson curve with rate = median count rate of data. |
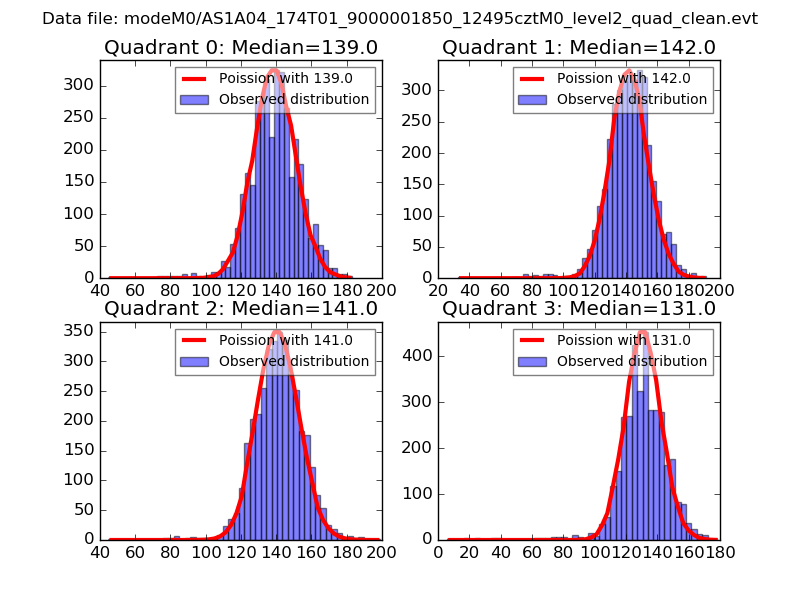 |
 |
| Quadrant-wise count rates Data is divided into 100 sec bins |
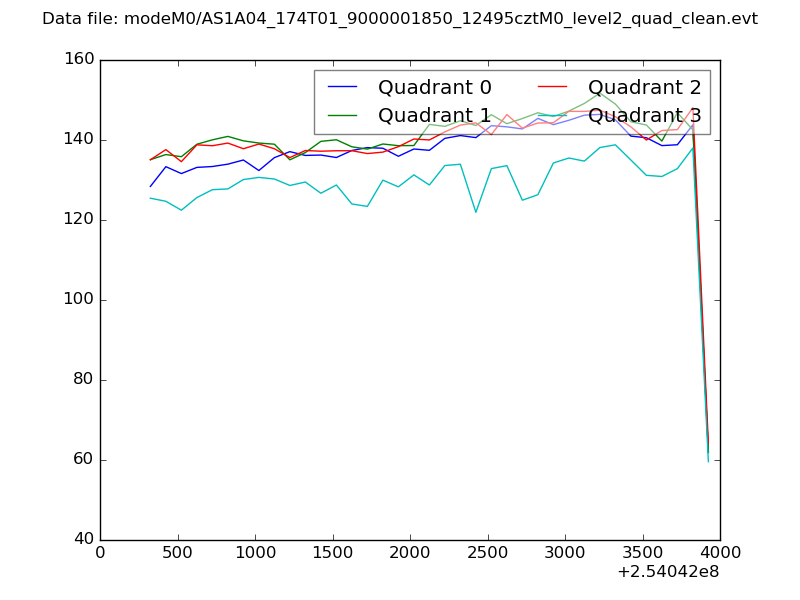 |
|
| Module-wise count rates for Quadrant A Data is divided into 100 sec bins |
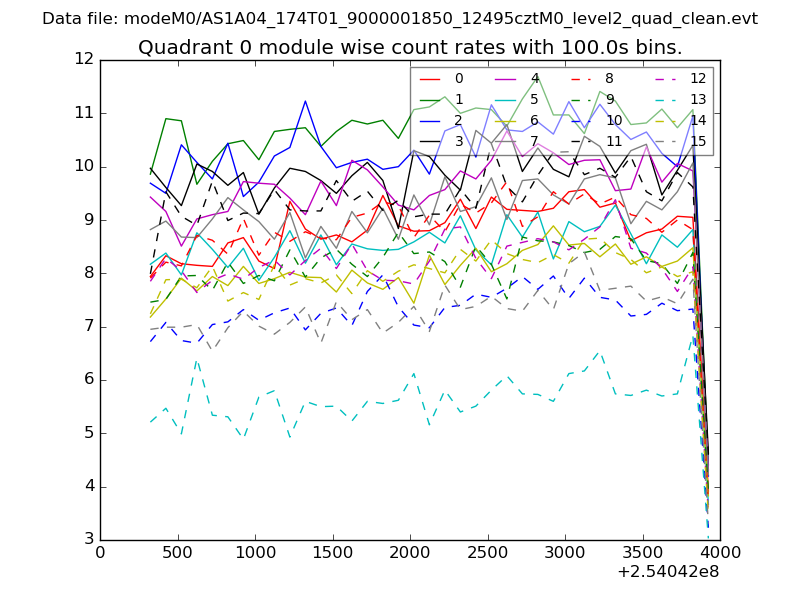 |
 |
| Module-wise count rates for Quadrant B Data is divided into 100 sec bins |
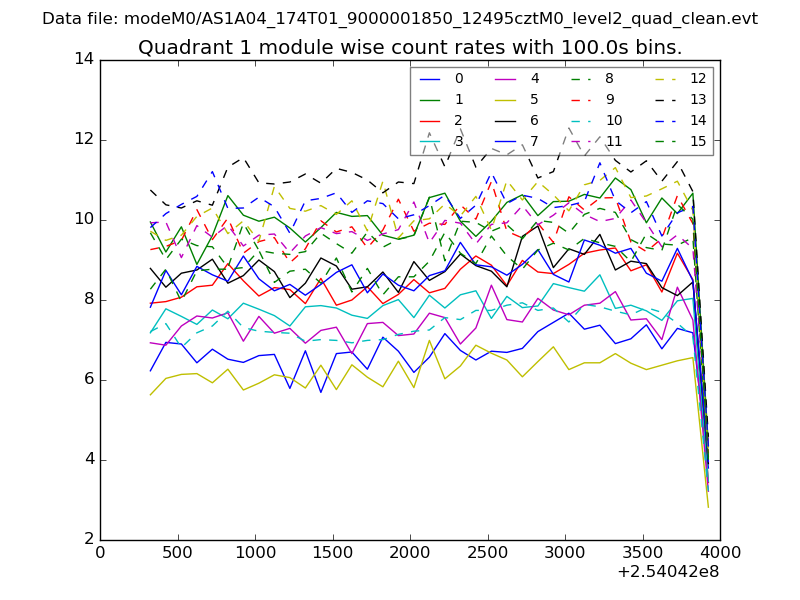 |
 |
| Module-wise count rates for Quadrant C Data is divided into 100 sec bins |
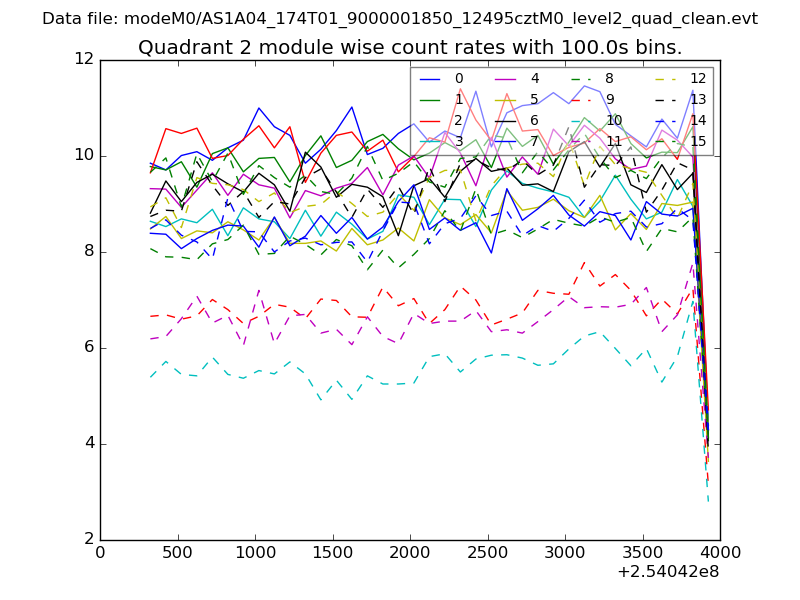 |
 |
| Module-wise count rates for Quadrant D Data is divided into 100 sec bins |
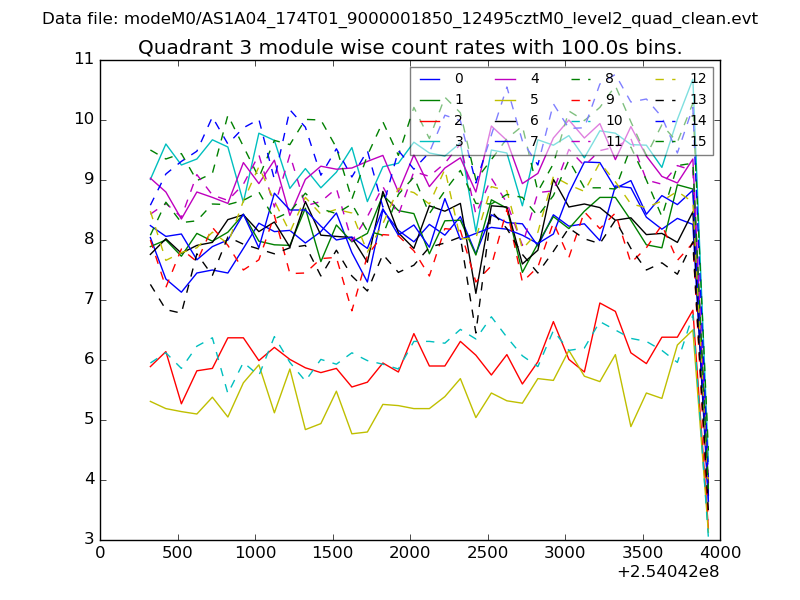 |
 |
| Parameter | Plot |
|---|---|
| CZT HV Monitor | 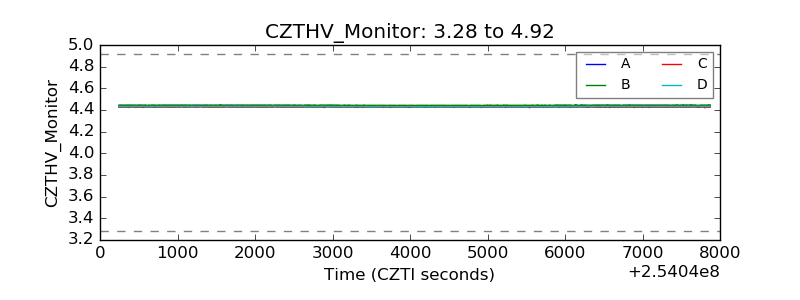 |
| D_VDD | 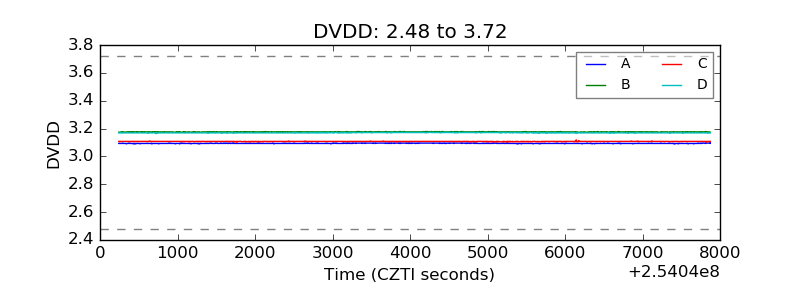 |
| Temperature 1 | 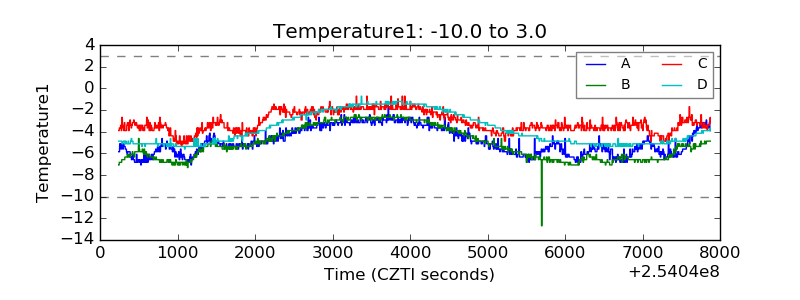 |
| Veto HV Monitor | 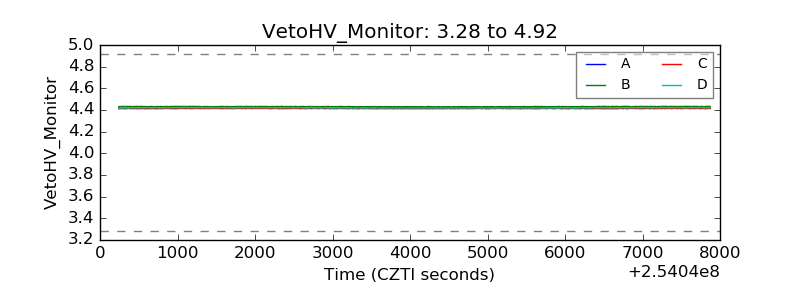 |
| Veto LLD |  |
| Alpha Counter | 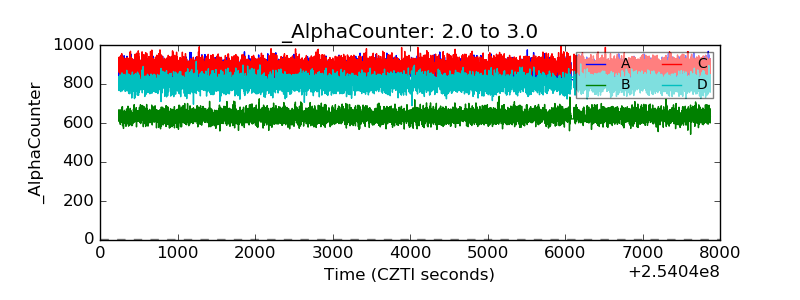 |
| _CPM_Rate | 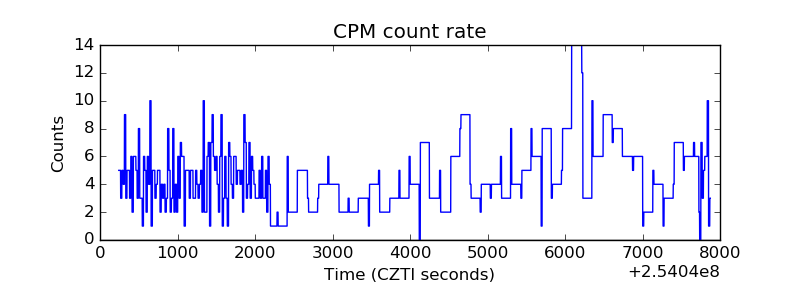 |
| CZT Counter | 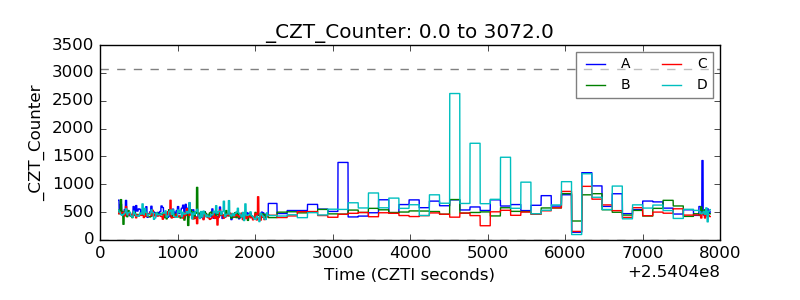 |
| +2.5 Volts monitor |  |
| +5 Volts monitor |  |
| _ROLL_ROT | 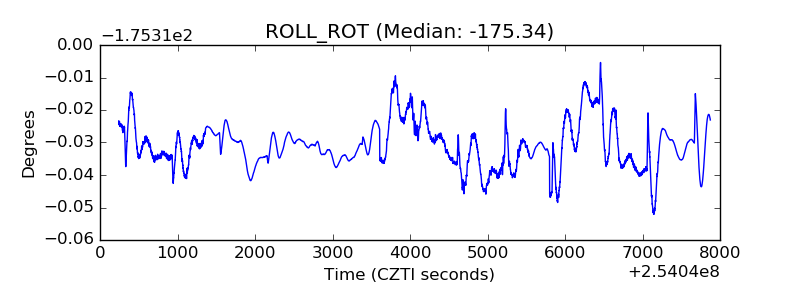 |
| _Roll_DEC | 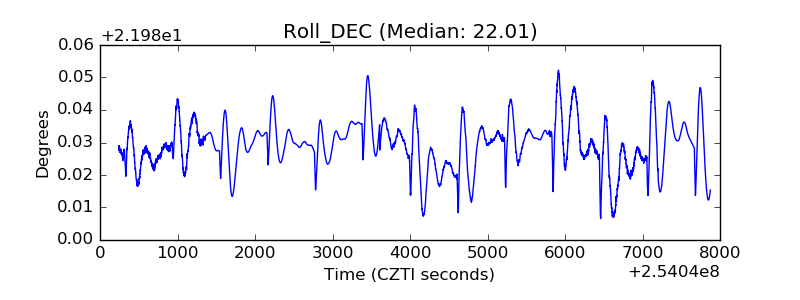 |
| _Roll_RA | 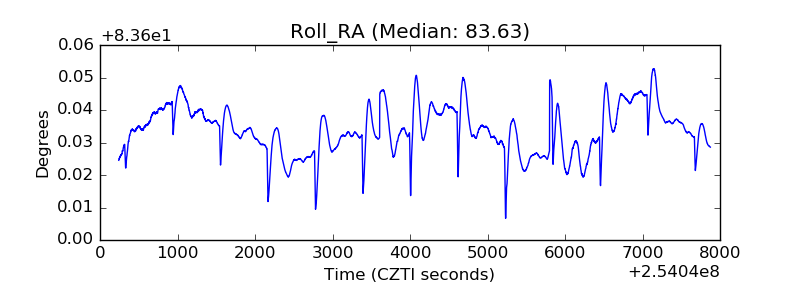 |
| Veto Counter | 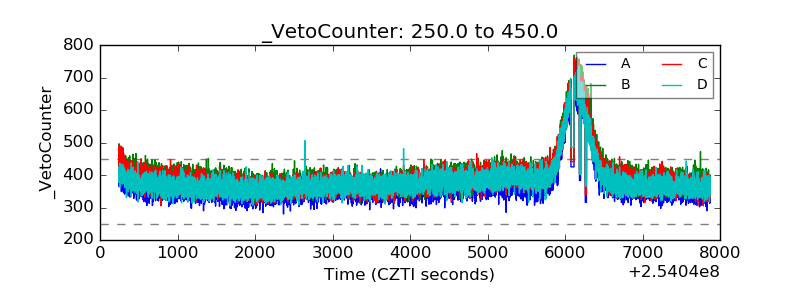 |