| Param | Original file | Final file |
|---|---|---|
| Filename | modeM0/AS1A04_174T01_9000001850_12496cztM0_level2.evt | modeM0/AS1A04_174T01_9000001850_12496cztM0_level2_quad_clean.evt |
| Size (bytes) | 711,596,160 | 96,871,680 |
| Size | 678.6 MB | 92.4 MB |
| Events in quadrant A | 5,727,603 | 586,680 |
| Events in quadrant B | 5,087,848 | 585,262 |
| Events in quadrant C | 4,214,934 | 604,025 |
| Events in quadrant D | 5,938,608 | 561,193 |
| Mode M0 | |||
|---|---|---|---|
| Quadrant | BADHDUFLAG | Total packets | Discarded packets |
| A | 0 | 22816 | 3 |
| B | 0 | 20464 | 2 |
| C | 0 | 18172 | 2 |
| D | 0 | 23173 | 2 |
| Mode M9 | |||
|---|---|---|---|
| Quadrant | BADHDUFLAG | Total packets | Discarded packets |
| A | 0 | 4 | 0 |
| B | 0 | 4 | 0 |
| C | 0 | 4 | 0 |
| D | 0 | 4 | 0 |
| Mode SS | |||
|---|---|---|---|
| Quadrant | BADHDUFLAG | Total packets | Discarded packets |
| A | 0 | 176 | 0 |
| B | 0 | 176 | 0 |
| C | 0 | 176 | 0 |
| D | 0 | 176 | 0 |
| Quadrant | Total seconds | Saturated seconds | Saturation percentage |
|---|---|---|---|
| A | 8599 | 580 | 6.744970% |
| B | 8599 | 771 | 8.966159% |
| C | 8599 | 283 | 3.291080% |
| D | 8599 | 656 | 7.628794% |
Noise dominated data is calculated using 1-second bins in cleaned event files. If a bin has >2000 counts, and if more than 50% of those come from <1% of pixels, then it is considered to be noise-dominated and hence unusable.
| Quadrant | # 1 sec bins | Bins with >0 counts | Bins with >2000 counts | High rate bins dominated by noise | Noise dominated (total time) | Noise dominated (detector-on time) | Marked lightcurve |
|---|---|---|---|---|---|---|---|
| A | 8755 | 8602 | 55 | 55 | 0.63% | 0.64% | 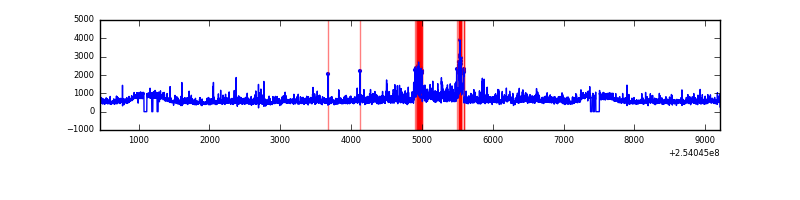 |
| B | 8755 | 8606 | 222 | 222 | 2.54% | 2.58% | 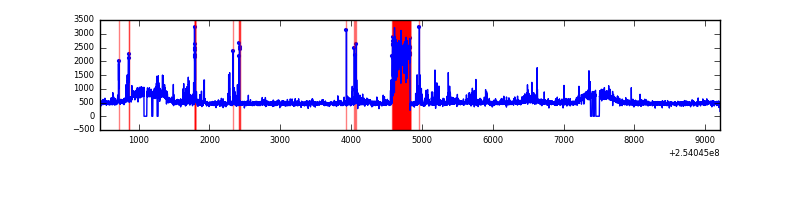 |
| C | 8755 | 8606 | 0 | 0 | 0.00% | 0.00% | 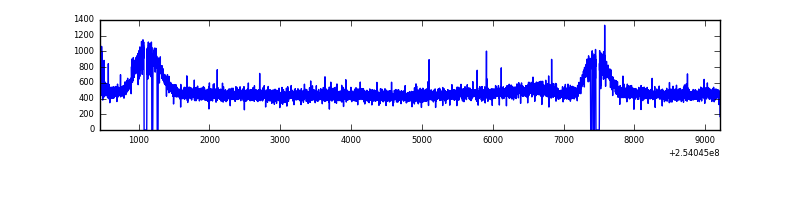 |
| D | 8755 | 8606 | 247 | 247 | 2.82% | 2.87% | 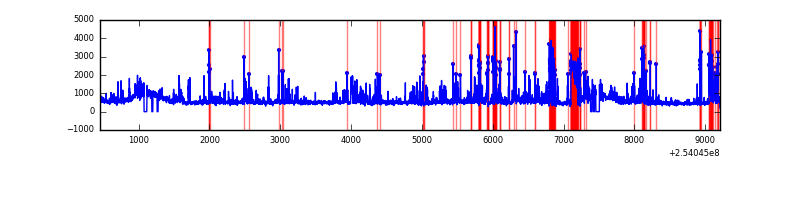 |
Top three noisy pixels from each quadrant. If the there are fewer than three noisy pixels in the level2.evt file, extra rows are filled as -1
| Pixel properties | Quadrant properties | ||||||
|---|---|---|---|---|---|---|---|
| Quadrant | DetID | PixID | Counts | Sigma | Mean | Median | Sigma |
| A | 8 | 15 | 536909 | 2387.59 | 1083 | 1058 | 224.4 |
| A | 1 | 162 | 289491 | 1285.17 | 1083 | 1058 | 224.4 |
| A | 12 | 189 | 196374 | 870.27 | 1083 | 1058 | 224.4 |
| B | 4 | 239 | 765214 | 3627.02 | 1081 | 1053 | 210.7 |
| B | 0 | 214 | 55168 | 256.85 | 1081 | 1053 | 210.7 |
| B | 12 | 111 | 24623 | 111.87 | 1081 | 1053 | 210.7 |
| C | 13 | 61 | 7987 | 27.56 | 1079 | 1085 | 250.4 |
| C | 14 | 234 | 6519 | 21.7 | 1079 | 1085 | 250.4 |
| C | 8 | 222 | 3602 | 10.05 | 1079 | 1085 | 250.4 |
| D | 1 | 52 | 1678371 | 6610.21 | 1039 | 1007 | 253.8 |
| D | 13 | 104 | 141511 | 553.7 | 1039 | 1007 | 253.8 |
| D | 10 | 157 | 65717 | 255.01 | 1039 | 1007 | 253.8 |
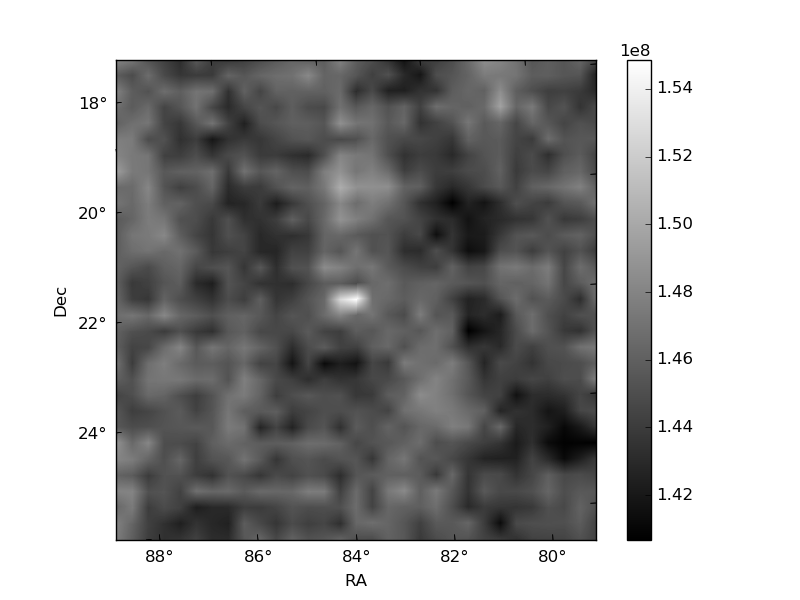
Histogram calculated using DETX and DETY for each event in the final _common_clean file
| Quadrant A | 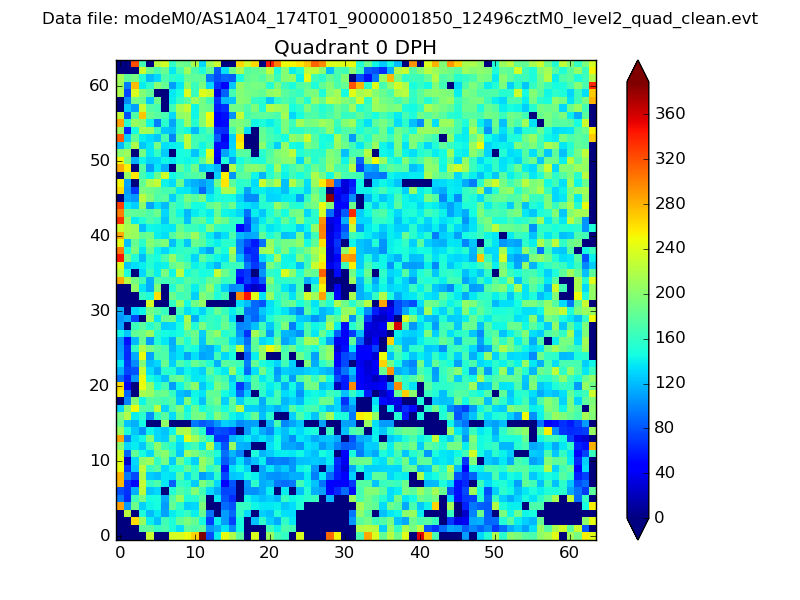 |
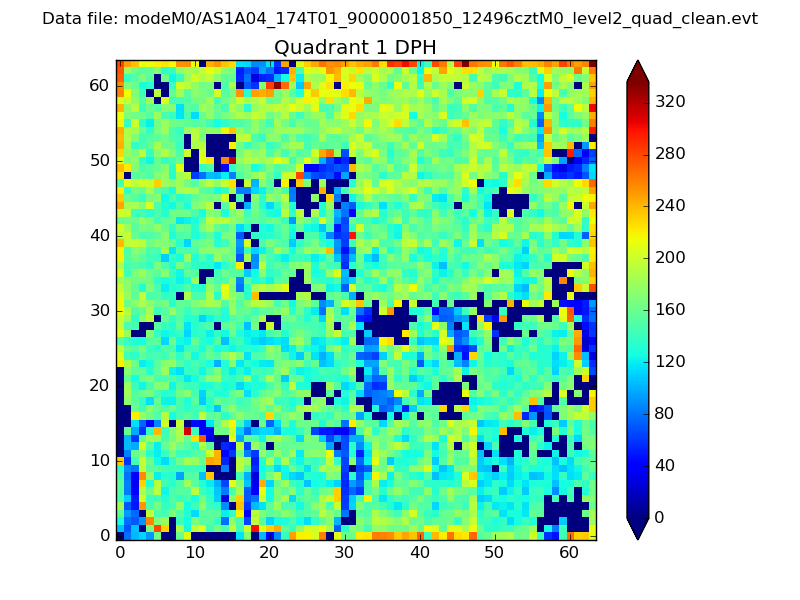 |
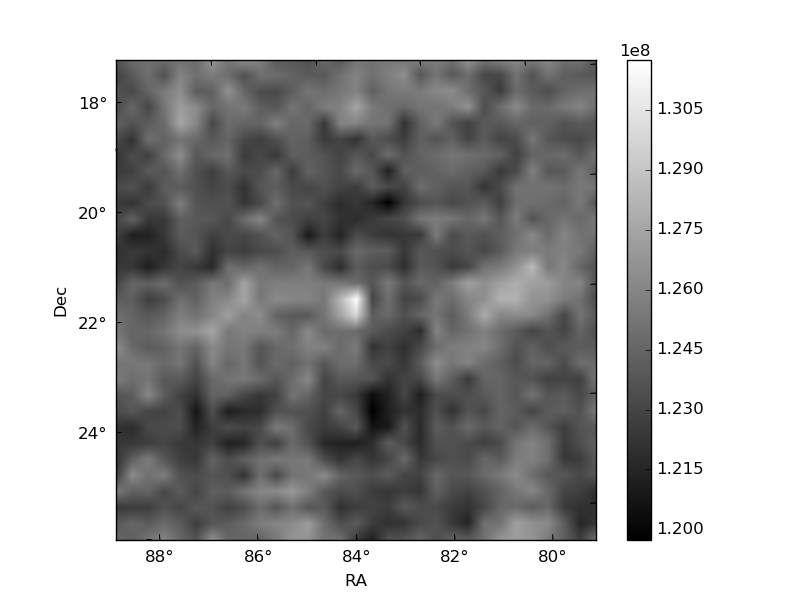
Quadrant B |
|---|---|---|---|
| Quadrant D | 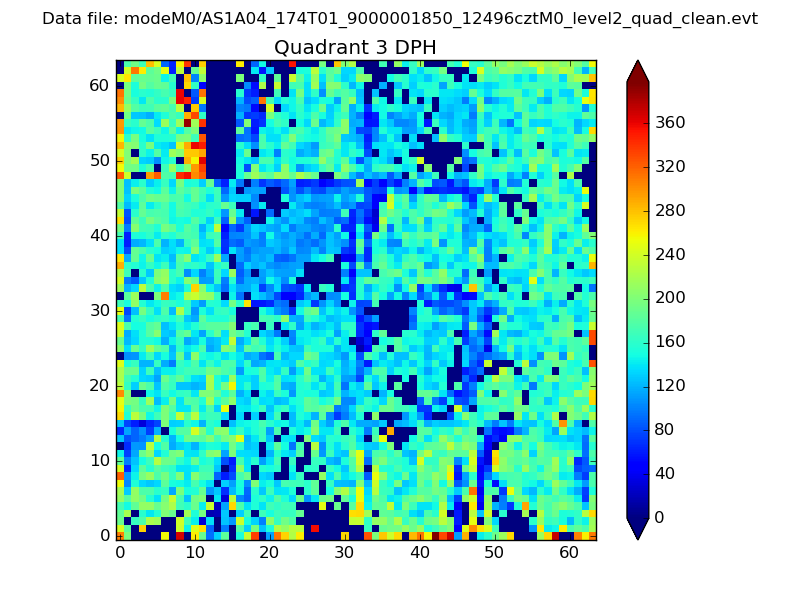 |
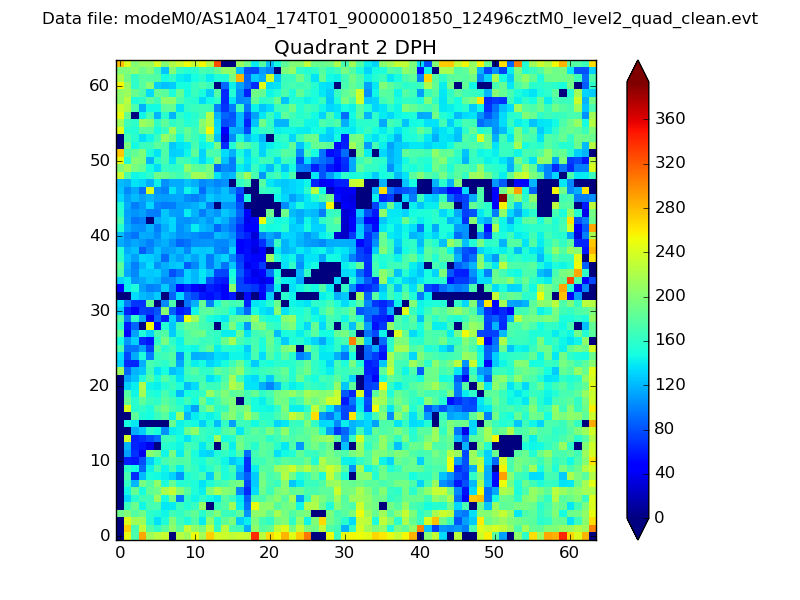 |
Quadrant C |
| Plot type | Count rate plots | Images |
|---|---|---|
| Comparison with Poisson distribution Blue bars denote a histogram of data divided into 1 sec bins. Red curve is a Poisson curve with rate = median count rate of data. |
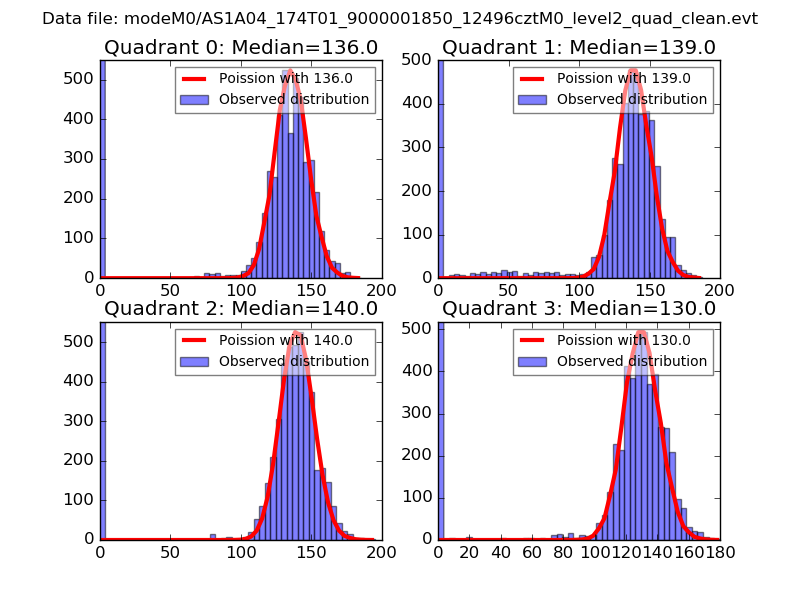 |
 |
| Quadrant-wise count rates Data is divided into 100 sec bins |
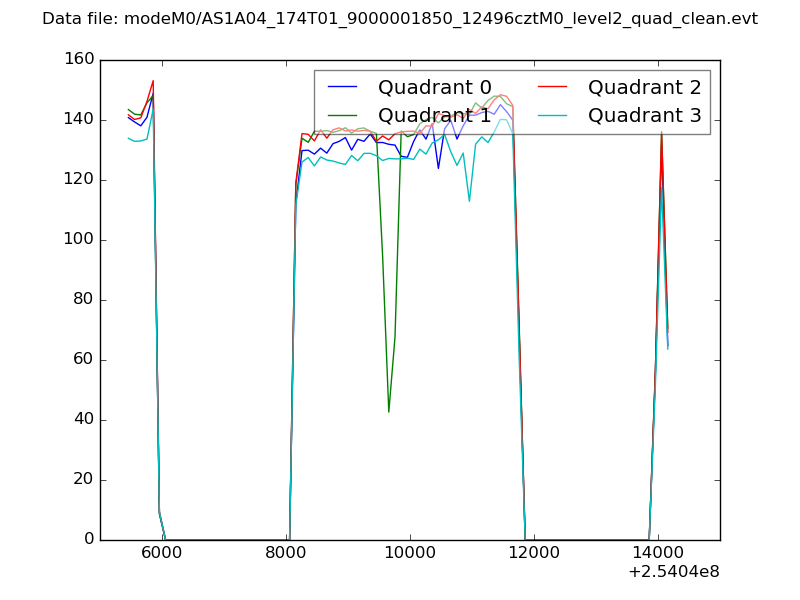 |
|
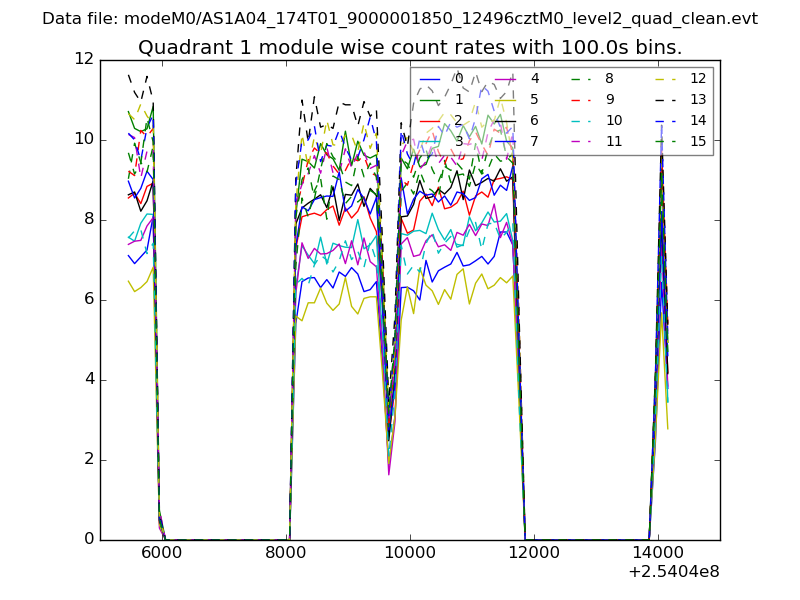
| Module-wise count rates for Quadrant A Data is divided into 100 sec bins |
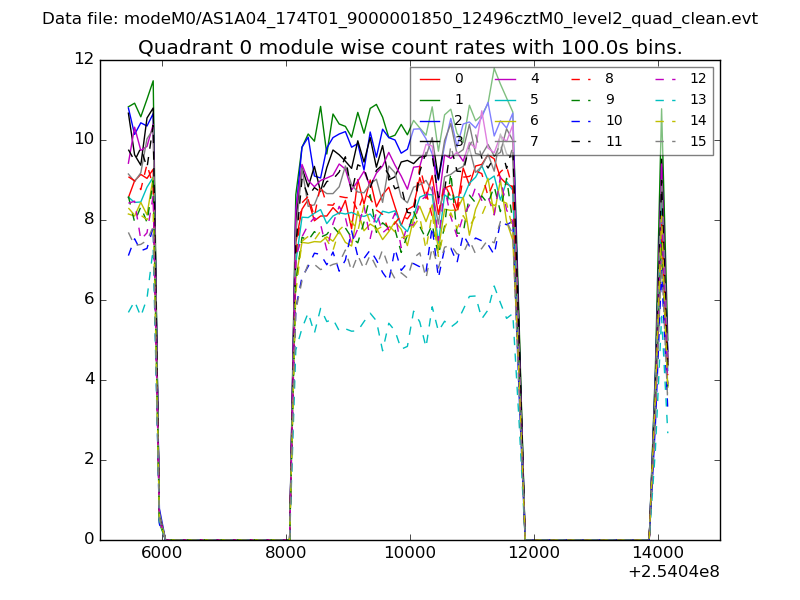 |
 |
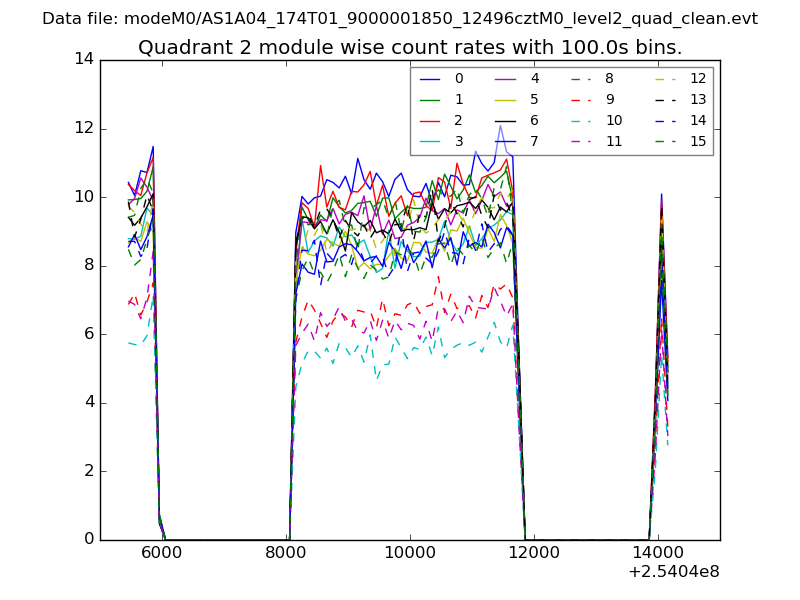
| Module-wise count rates for Quadrant B Data is divided into 100 sec bins |
 |
 |
| Module-wise count rates for Quadrant C Data is divided into 100 sec bins |
 |
 |
| Module-wise count rates for Quadrant D Data is divided into 100 sec bins |
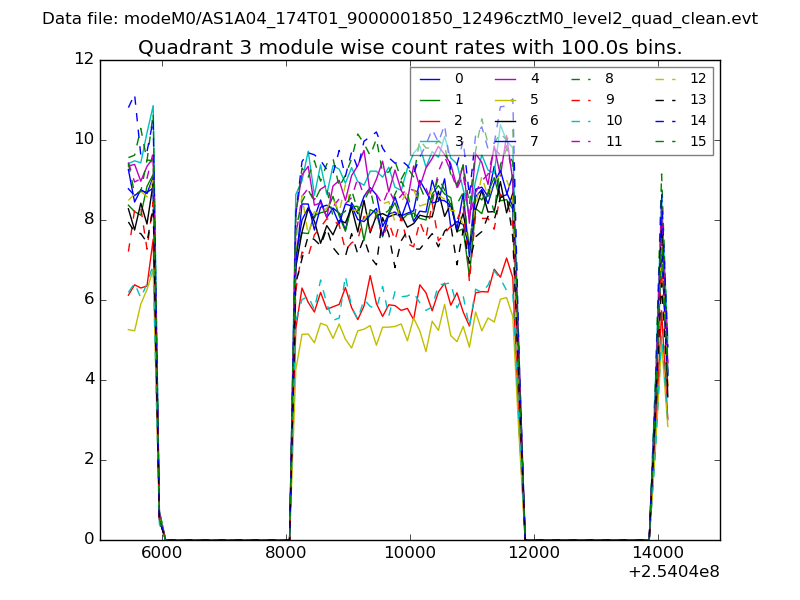 |
 |
| Parameter | Plot |
|---|---|
| CZT HV Monitor | 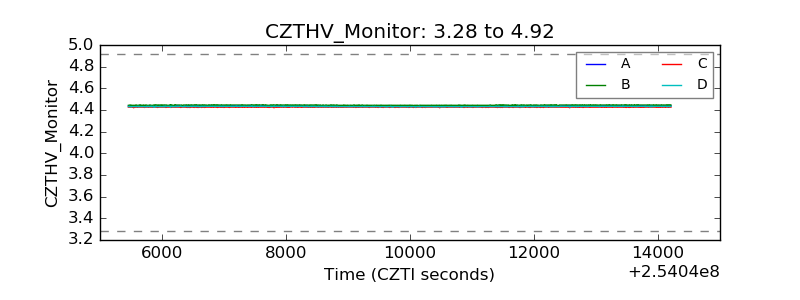 |
| D_VDD | 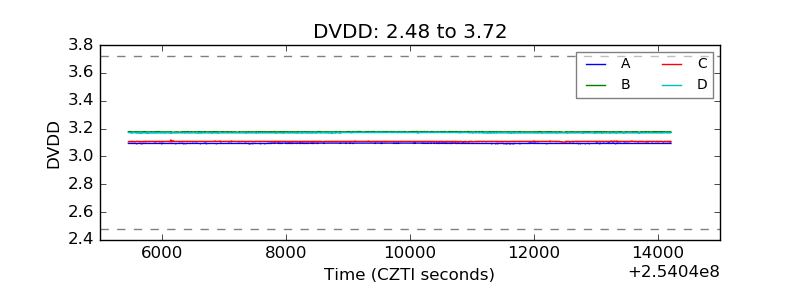 |
| Temperature 1 | 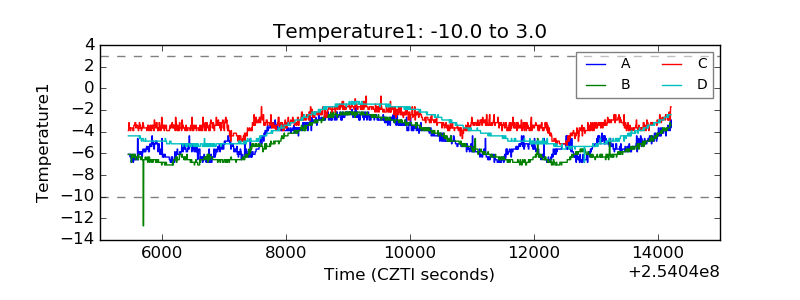 |
| Veto HV Monitor | 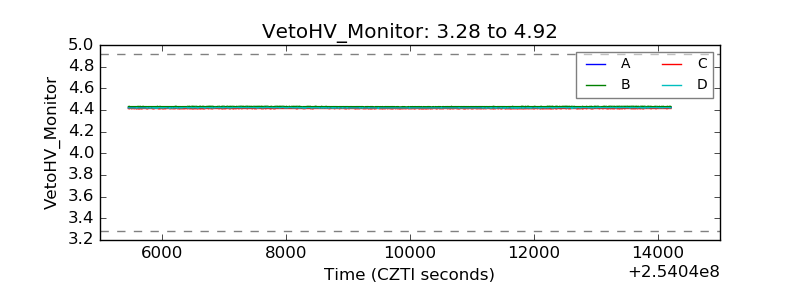 |
| Veto LLD | 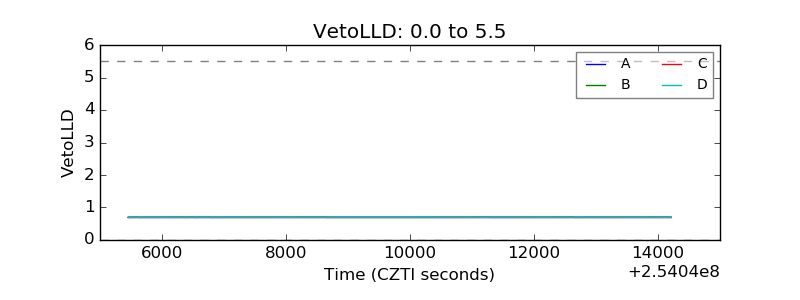 |
| Alpha Counter | 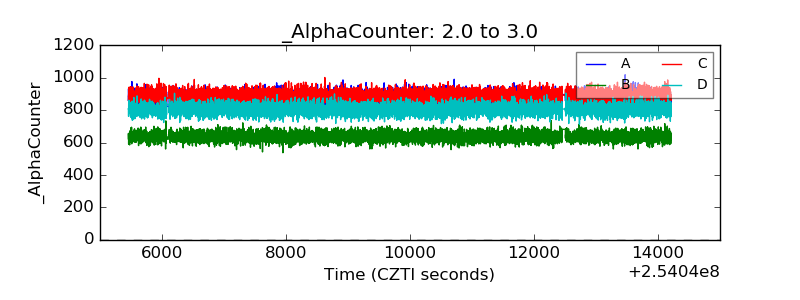 |
| _CPM_Rate | 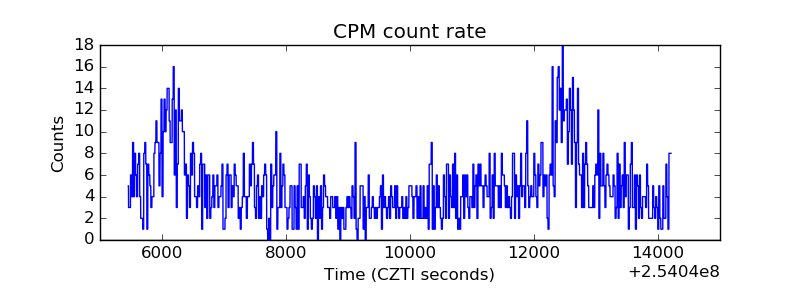 |
| CZT Counter | 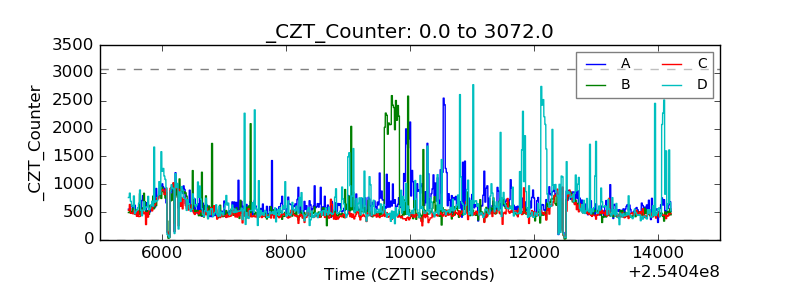 |
| +2.5 Volts monitor |  |
| +5 Volts monitor |  |
| _ROLL_ROT | 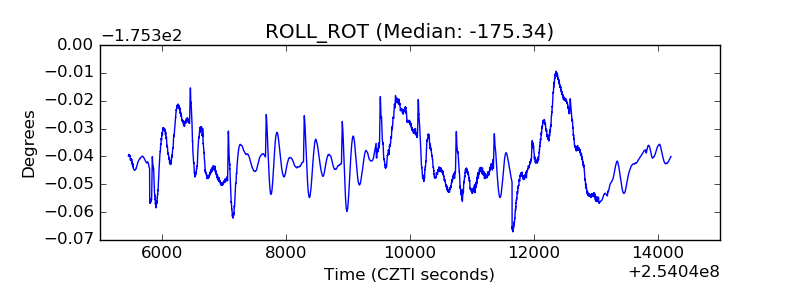 |
| _Roll_DEC | 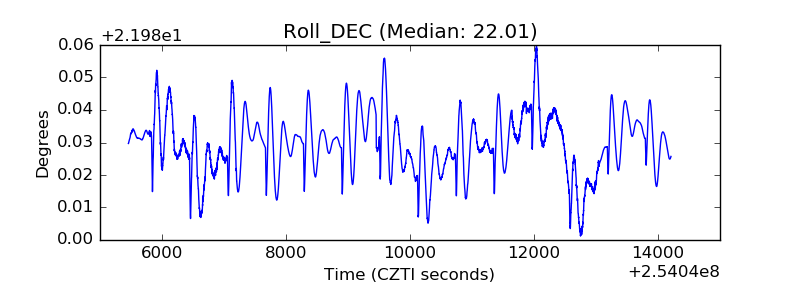 |
| _Roll_RA | 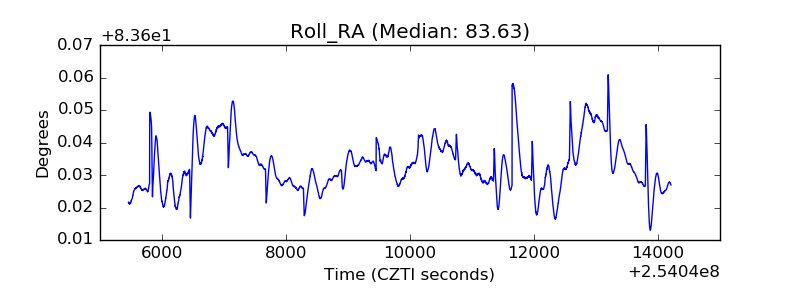 |
| Veto Counter | 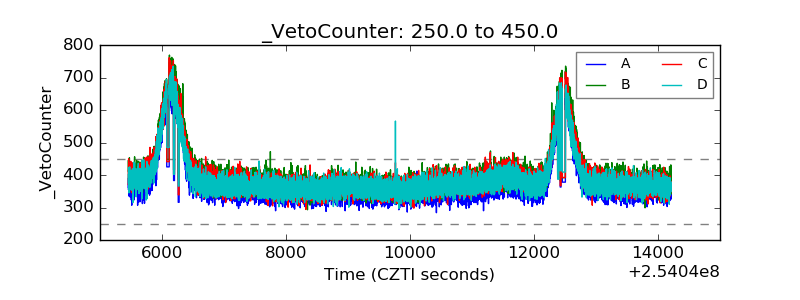 |