| Param | Original file | Final file |
|---|---|---|
| Filename | modeM0/AS1A04_174T01_9000001850_12499cztM0_level2.evt | modeM0/AS1A04_174T01_9000001850_12499cztM0_level2_quad_clean.evt |
| Size (bytes) | 1,079,910,720 | 182,975,040 |
| Size | 1.0 GB | 174.5 MB |
| Events in quadrant A | 7,239,575 | 1,189,180 |
| Events in quadrant B | 7,645,392 | 1,196,236 |
| Events in quadrant C | 5,910,939 | 1,208,061 |
| Events in quadrant D | 11,054,190 | 1,073,068 |
| Mode M0 | |||
|---|---|---|---|
| Quadrant | BADHDUFLAG | Total packets | Discarded packets |
| A | 0 | 29741 | 3 |
| B | 0 | 30601 | 2 |
| C | 0 | 25841 | 2 |
| D | 0 | 41176 | 2 |
| Mode M9 | |||
|---|---|---|---|
| Quadrant | BADHDUFLAG | Total packets | Discarded packets |
| A | 0 | 12 | 0 |
| B | 0 | 12 | 0 |
| C | 0 | 12 | 0 |
| D | 0 | 12 | 0 |
| Mode SS | |||
|---|---|---|---|
| Quadrant | BADHDUFLAG | Total packets | Discarded packets |
| A | 0 | 260 | 0 |
| B | 0 | 260 | 0 |
| C | 0 | 260 | 0 |
| D | 0 | 260 | 0 |
| Quadrant | Total seconds | Saturated seconds | Saturation percentage |
|---|---|---|---|
| A | 12651 | 205 | 1.620425% |
| B | 12651 | 397 | 3.138092% |
| C | 12651 | 88 | 0.695597% |
| D | 12651 | 1817 | 14.362501% |
Noise dominated data is calculated using 1-second bins in cleaned event files. If a bin has >2000 counts, and if more than 50% of those come from <1% of pixels, then it is considered to be noise-dominated and hence unusable.
| Quadrant | # 1 sec bins | Bins with >0 counts | Bins with >2000 counts | High rate bins dominated by noise | Noise dominated (total time) | Noise dominated (detector-on time) | Marked lightcurve |
|---|---|---|---|---|---|---|---|
| A | 13927 | 12652 | 6 | 6 | 0.04% | 0.05% | 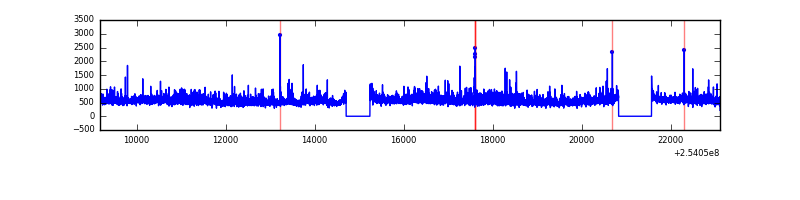 |
| B | 13927 | 12653 | 179 | 179 | 1.29% | 1.41% | 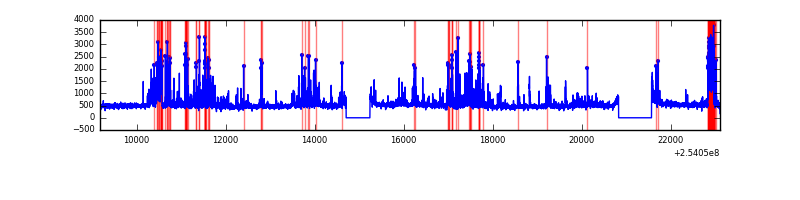 |
| C | 13927 | 12654 | 6 | 6 | 0.04% | 0.05% | 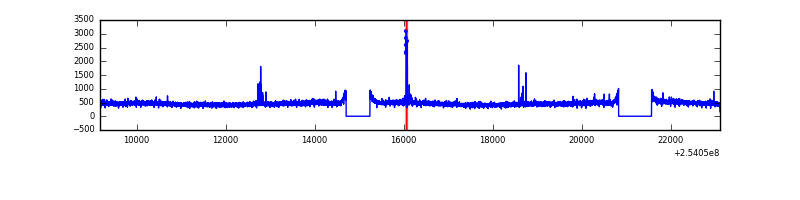 |
| D | 13927 | 12653 | 1350 | 1350 | 9.69% | 10.67% | 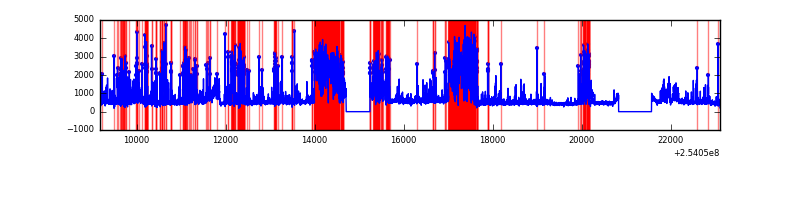 |
Top three noisy pixels from each quadrant. If the there are fewer than three noisy pixels in the level2.evt file, extra rows are filled as -1
| Pixel properties | Quadrant properties | ||||||
|---|---|---|---|---|---|---|---|
| Quadrant | DetID | PixID | Counts | Sigma | Mean | Median | Sigma |
| A | 1 | 162 | 355038 | 1125.08 | 1541 | 1511 | 314.2 |
| A | 1 | 178 | 208581 | 658.99 | 1541 | 1511 | 314.2 |
| A | 1 | 161 | 178511 | 563.3 | 1541 | 1511 | 314.2 |
| B | 4 | 239 | 1417276 | 4839.64 | 1533 | 1499 | 292.5 |
| B | 0 | 214 | 71950 | 240.83 | 1533 | 1499 | 292.5 |
| B | 3 | 209 | 53968 | 179.36 | 1533 | 1499 | 292.5 |
| C | 14 | 234 | 50288 | 140.23 | 1504 | 1517 | 347.8 |
| C | 13 | 61 | 10847 | 26.83 | 1504 | 1517 | 347.8 |
| C | 3 | 202 | 3619 | 6.04 | 1504 | 1517 | 347.8 |
| D | 1 | 52 | 5120024 | 15004.17 | 1398 | 1359 | 341.1 |
| D | 8 | 195 | 233688 | 681.02 | 1398 | 1359 | 341.1 |
| D | 2 | 14 | 189984 | 552.91 | 1398 | 1359 | 341.1 |
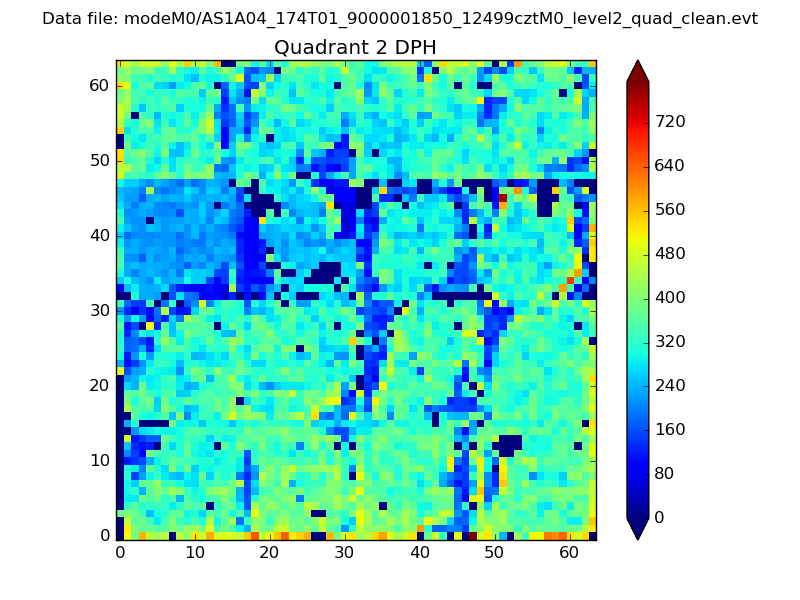
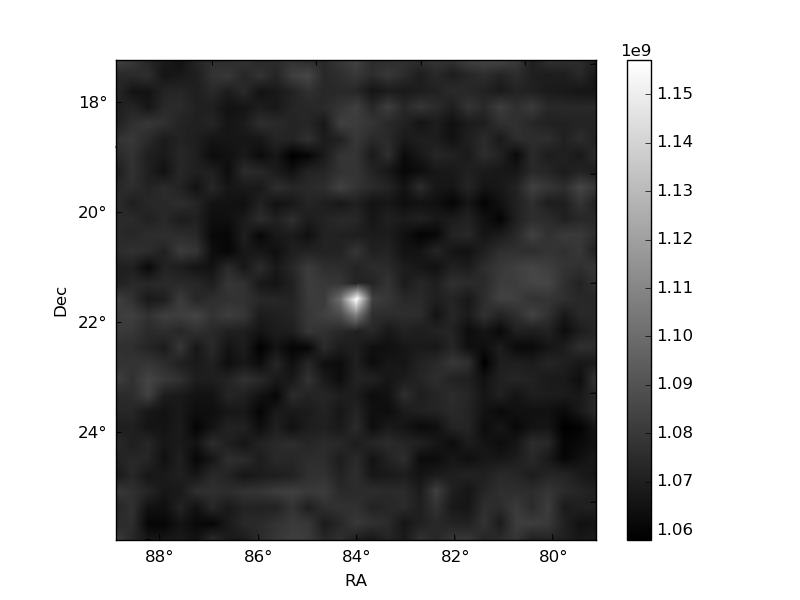
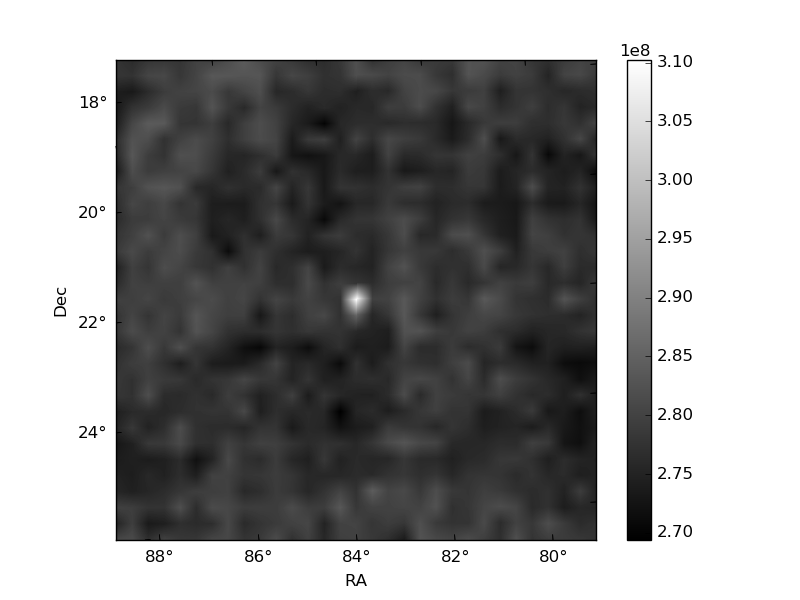
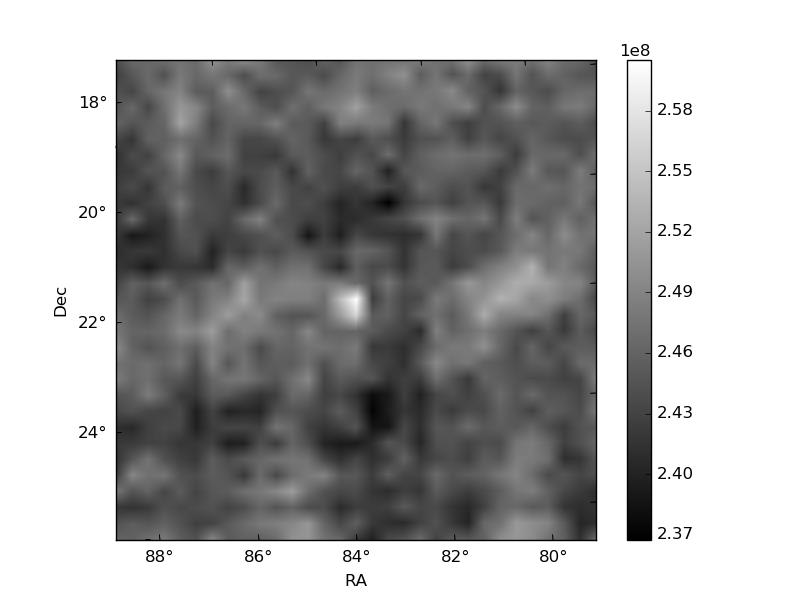
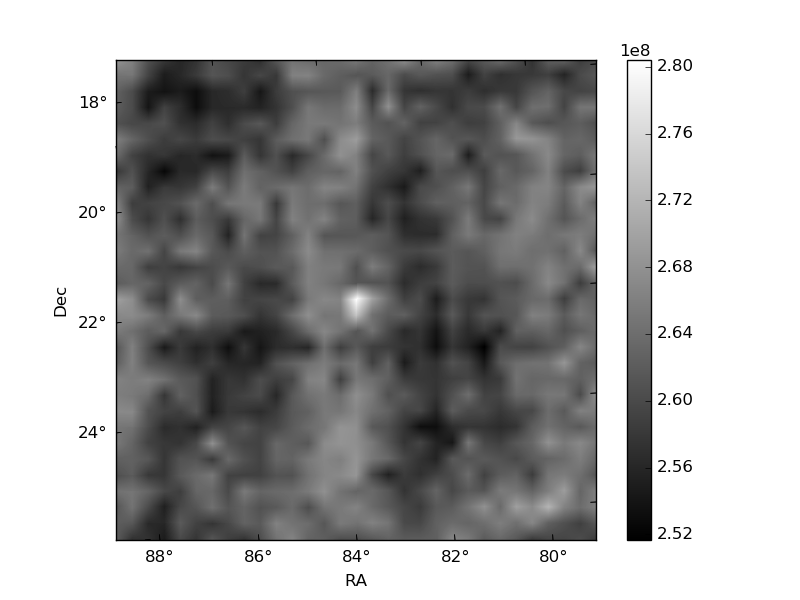
Histogram calculated using DETX and DETY for each event in the final _common_clean file
| Quadrant A | 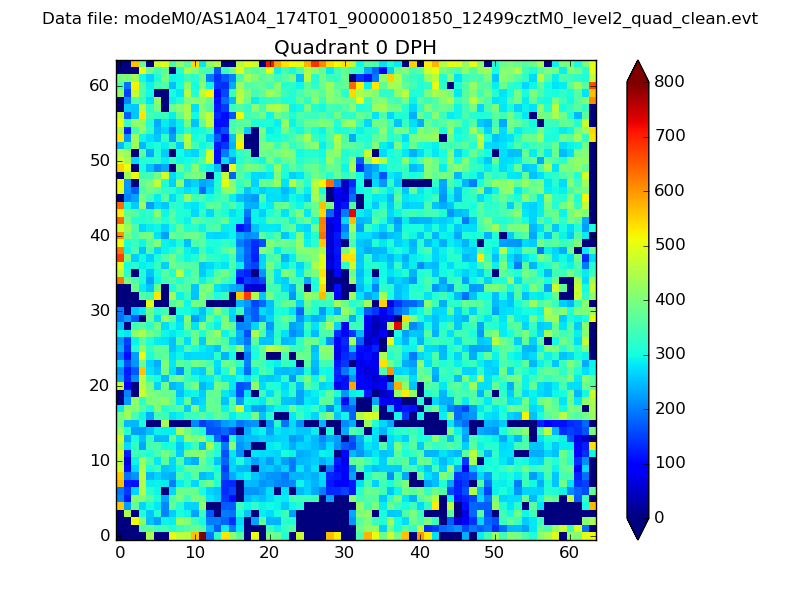 |
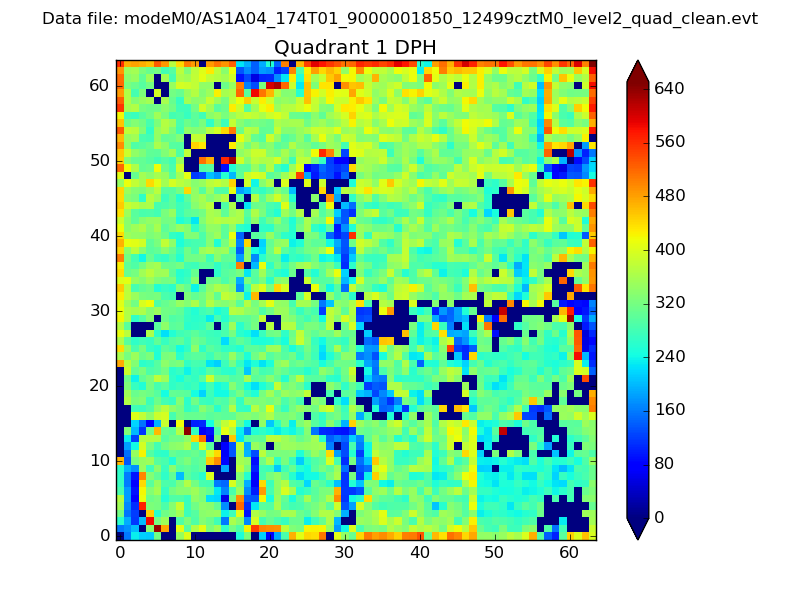 |
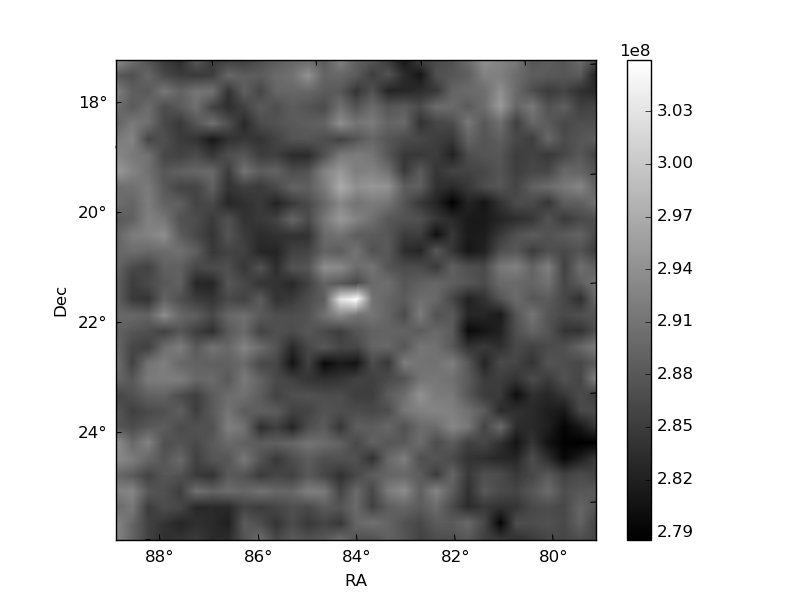
Quadrant B |
|---|---|---|---|
| Quadrant D | 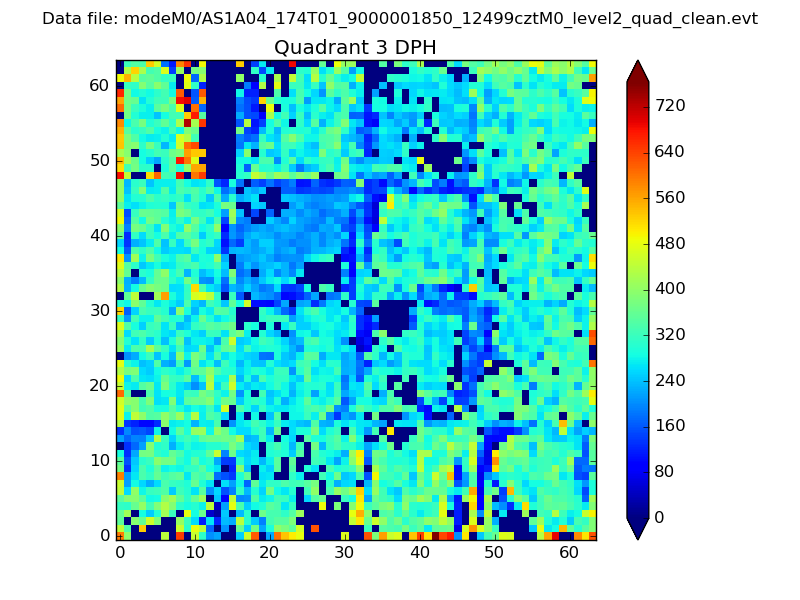 |
 |
Quadrant C |
| Plot type | Count rate plots | Images |
|---|---|---|
| Comparison with Poisson distribution Blue bars denote a histogram of data divided into 1 sec bins. Red curve is a Poisson curve with rate = median count rate of data. |
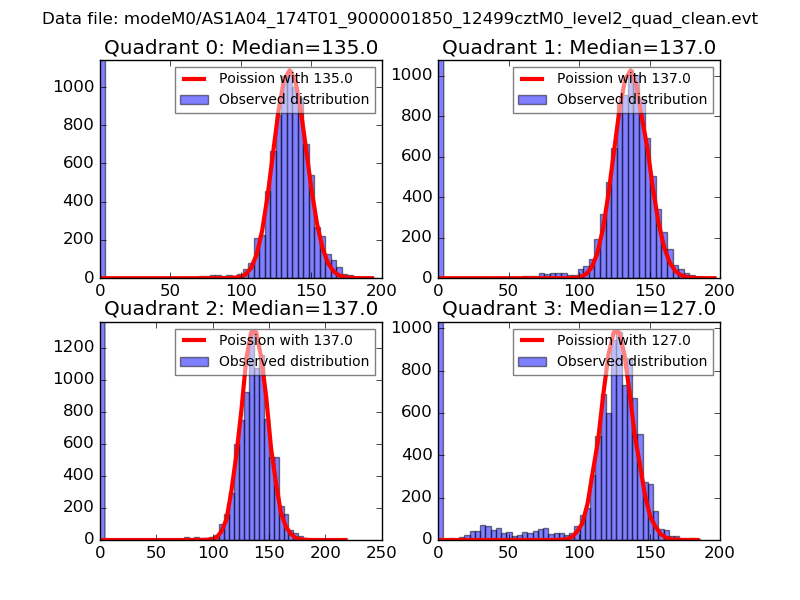 |
 |
| Quadrant-wise count rates Data is divided into 100 sec bins |
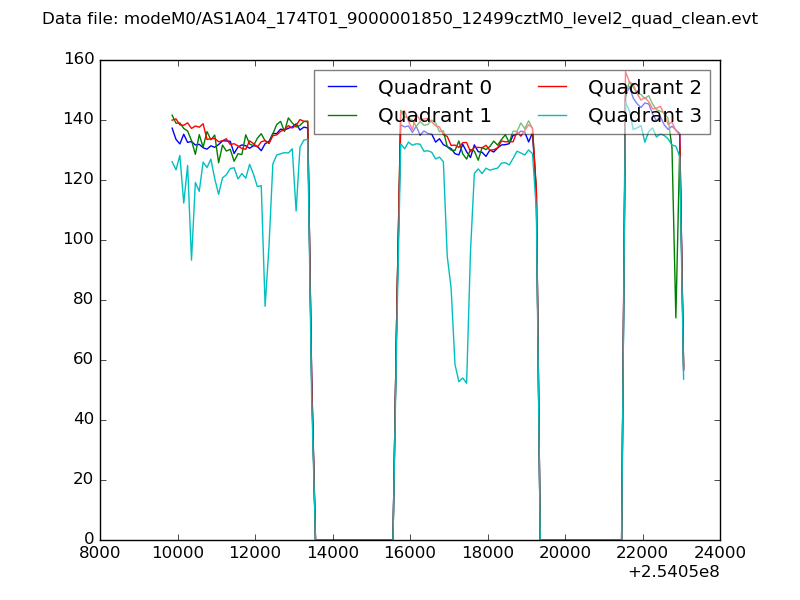 |
|
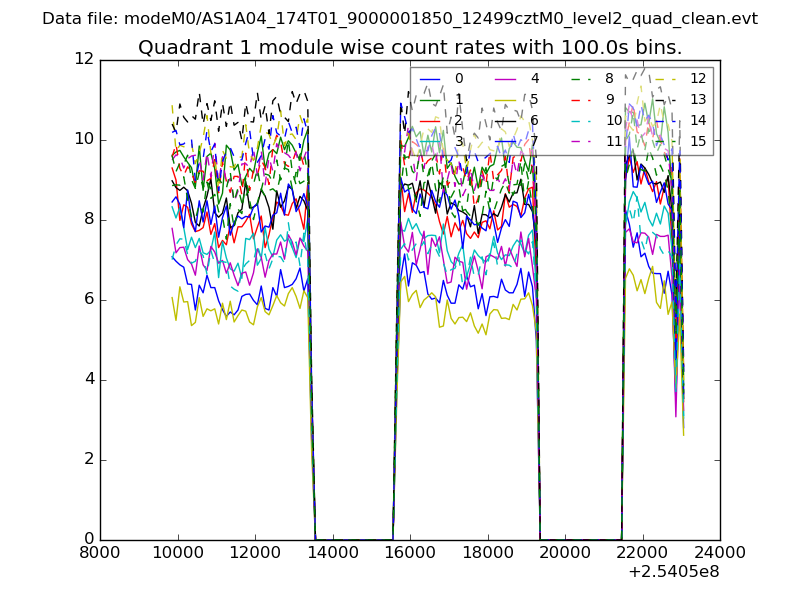
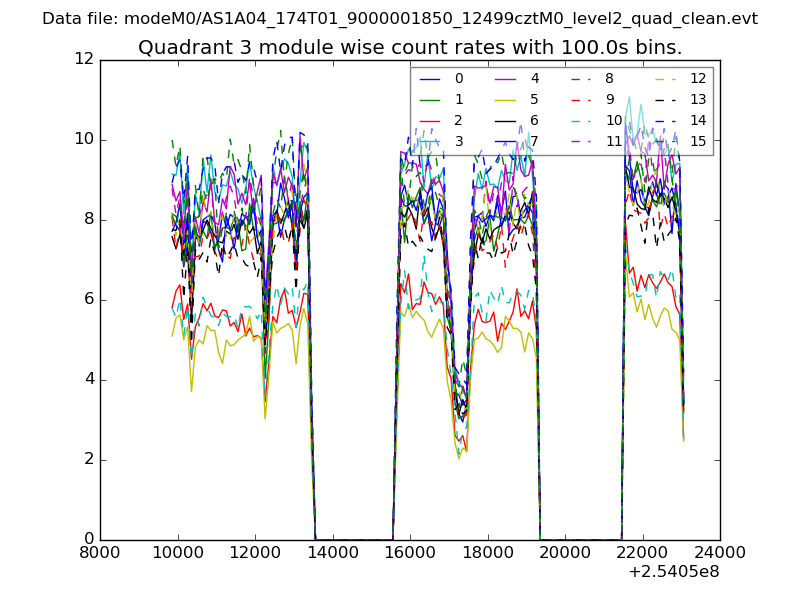
| Module-wise count rates for Quadrant A Data is divided into 100 sec bins |
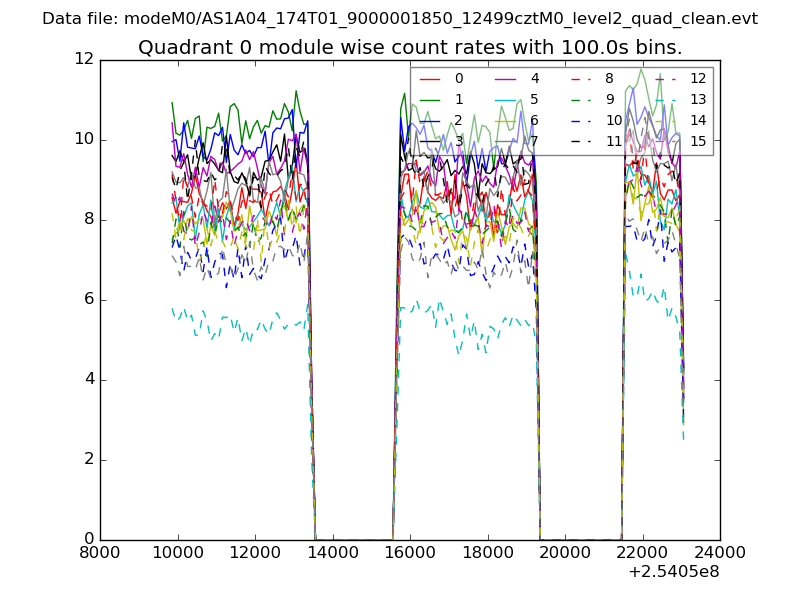 |
 |
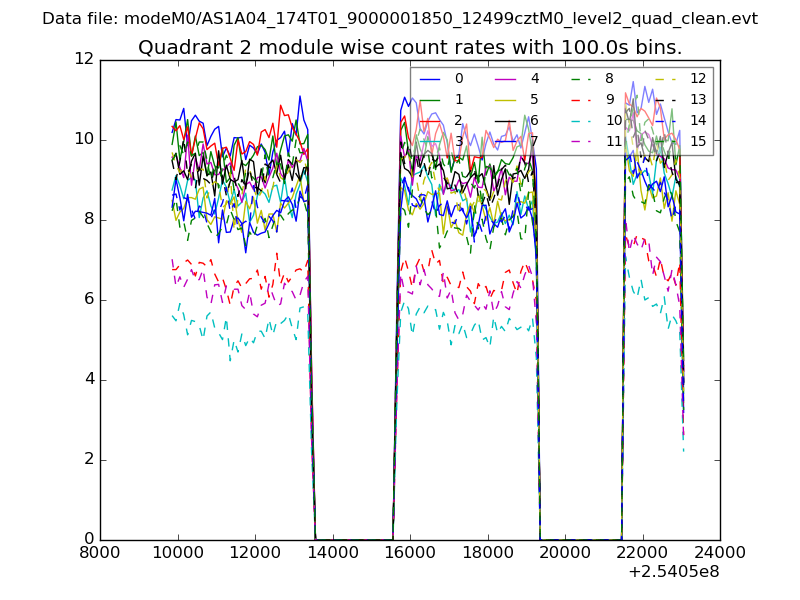
| Module-wise count rates for Quadrant B Data is divided into 100 sec bins |
 |
 |
| Module-wise count rates for Quadrant C Data is divided into 100 sec bins |
 |
 |
| Module-wise count rates for Quadrant D Data is divided into 100 sec bins |
 |
 |
| Parameter | Plot |
|---|---|
| CZT HV Monitor | 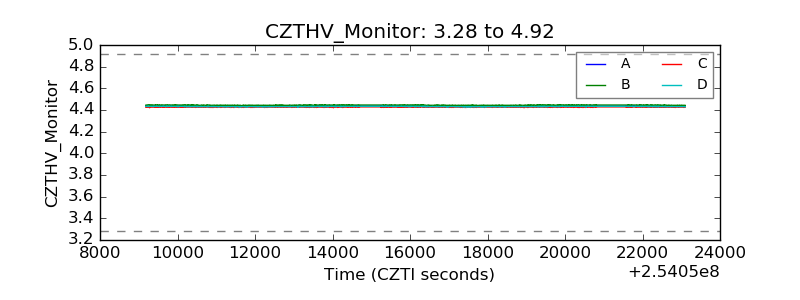 |
| D_VDD | 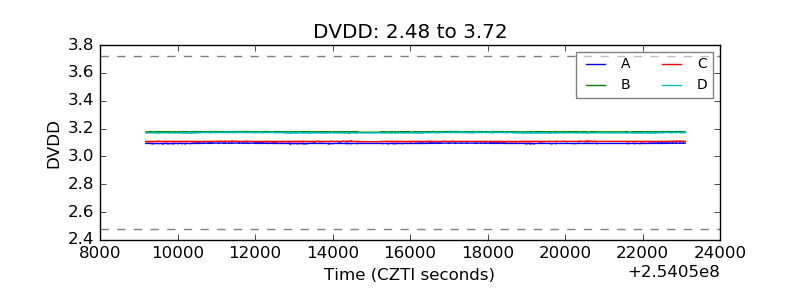 |
| Temperature 1 | 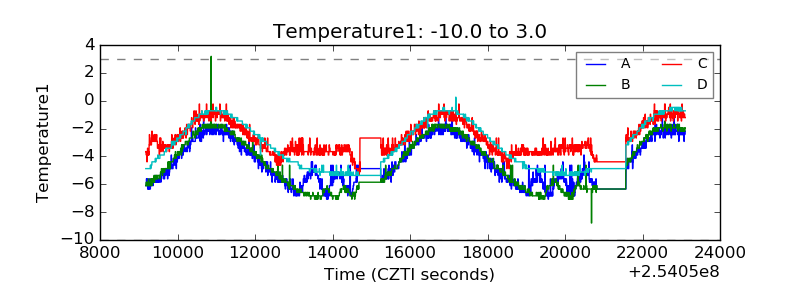 |
| Veto HV Monitor | 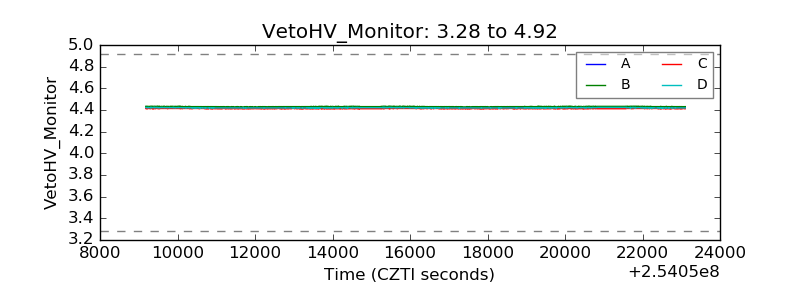 |
| Veto LLD |  |
| Alpha Counter | 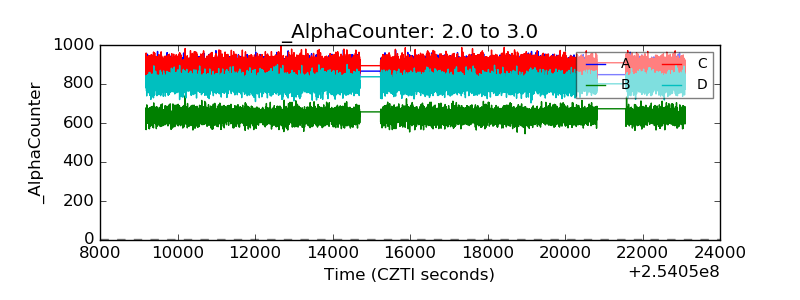 |
| _CPM_Rate | 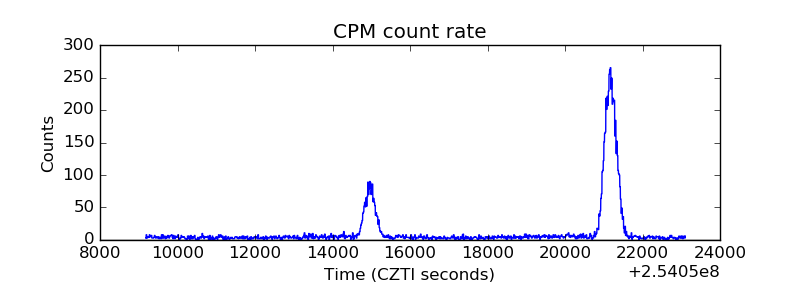 |
| CZT Counter | 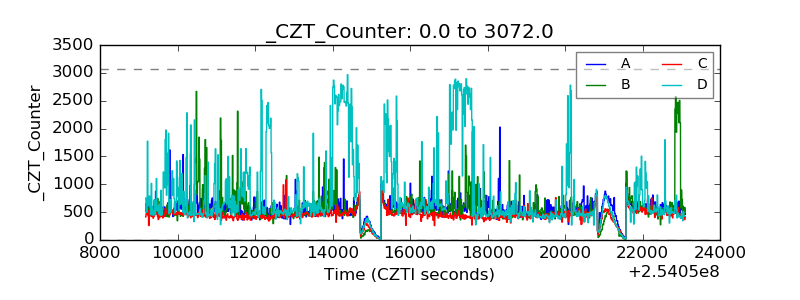 |
| +2.5 Volts monitor |  |
| +5 Volts monitor |  |
| _ROLL_ROT | 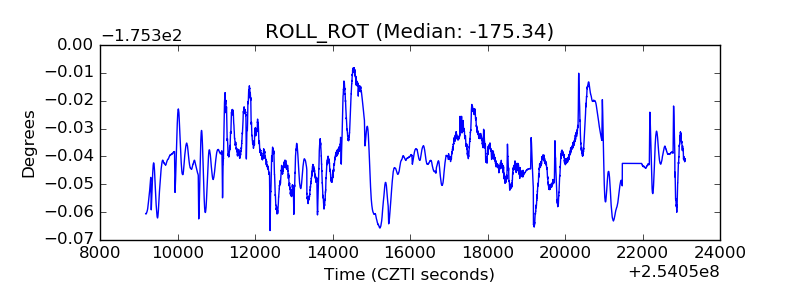 |
| _Roll_DEC | 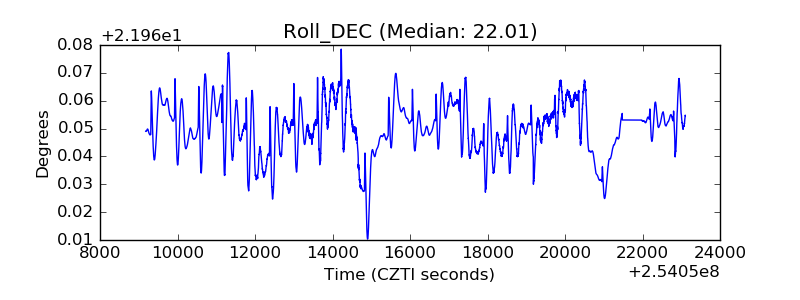 |
| _Roll_RA | 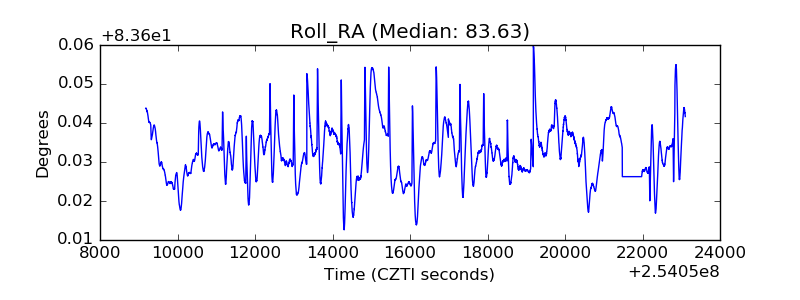 |
| Veto Counter |  |