| Param | Original file | Final file |
|---|---|---|
| Filename | modeM0/AS1A04_174T01_9000001850_12501cztM0_level2.evt | modeM0/AS1A04_174T01_9000001850_12501cztM0_level2_quad_clean.evt |
| Size (bytes) | 521,323,200 | 100,137,600 |
| Size | 497.2 MB | 95.5 MB |
| Events in quadrant A | 3,896,593 | 652,157 |
| Events in quadrant B | 3,765,078 | 661,209 |
| Events in quadrant C | 3,080,418 | 654,040 |
| Events in quadrant D | 4,601,620 | 607,944 |
| Mode M0 | |||
|---|---|---|---|
| Quadrant | BADHDUFLAG | Total packets | Discarded packets |
| A | 0 | 16052 | 2 |
| B | 0 | 15565 | 1 |
| C | 0 | 13479 | 1 |
| D | 0 | 18162 | 1 |
| Mode M9 | |||
|---|---|---|---|
| Quadrant | BADHDUFLAG | Total packets | Discarded packets |
| A | 0 | 10 | 0 |
| B | 0 | 10 | 0 |
| C | 0 | 10 | 0 |
| D | 0 | 10 | 0 |
| Mode SS | |||
|---|---|---|---|
| Quadrant | BADHDUFLAG | Total packets | Discarded packets |
| A | 0 | 134 | 0 |
| B | 0 | 134 | 0 |
| C | 0 | 134 | 0 |
| D | 0 | 134 | 0 |
| Quadrant | Total seconds | Saturated seconds | Saturation percentage |
|---|---|---|---|
| A | 6554 | 91 | 1.388465% |
| B | 6554 | 119 | 1.815685% |
| C | 6554 | 21 | 0.320415% |
| D | 6554 | 157 | 2.395484% |
Noise dominated data is calculated using 1-second bins in cleaned event files. If a bin has >2000 counts, and if more than 50% of those come from <1% of pixels, then it is considered to be noise-dominated and hence unusable.
| Quadrant | # 1 sec bins | Bins with >0 counts | Bins with >2000 counts | High rate bins dominated by noise | Noise dominated (total time) | Noise dominated (detector-on time) | Marked lightcurve |
|---|---|---|---|---|---|---|---|
| A | 7640 | 6555 | 8 | 8 | 0.10% | 0.12% | 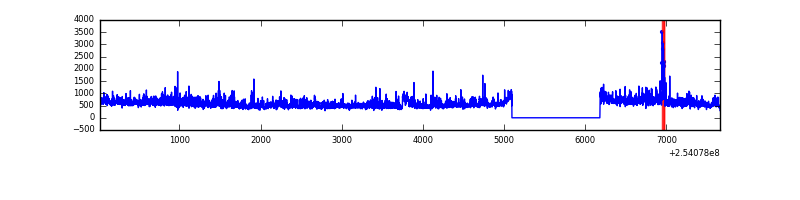 |
| B | 7640 | 6556 | 61 | 61 | 0.80% | 0.93% | 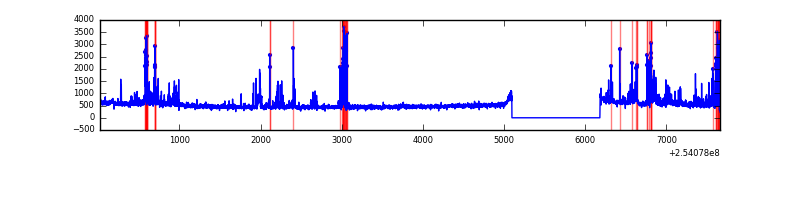 |
| C | 7640 | 6556 | 0 | 0 | 0.00% | 0.00% | 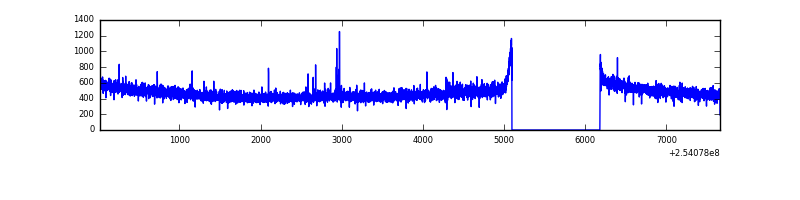 |
| D | 7640 | 6556 | 157 | 157 | 2.05% | 2.39% | 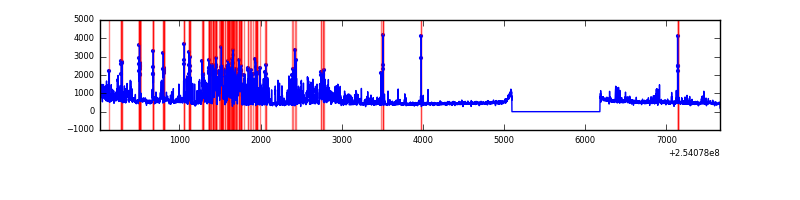 |
Top three noisy pixels from each quadrant. If the there are fewer than three noisy pixels in the level2.evt file, extra rows are filled as -1
| Pixel properties | Quadrant properties | ||||||
|---|---|---|---|---|---|---|---|
| Quadrant | DetID | PixID | Counts | Sigma | Mean | Median | Sigma |
| A | 1 | 162 | 237054 | 1421.67 | 809 | 794 | 166.2 |
| A | 1 | 178 | 146195 | 874.94 | 809 | 794 | 166.2 |
| A | 1 | 161 | 123731 | 739.76 | 809 | 794 | 166.2 |
| B | 4 | 239 | 487098 | 3176.68 | 807 | 790 | 153.1 |
| B | 0 | 230 | 33891 | 216.22 | 807 | 790 | 153.1 |
| B | 11 | 51 | 30863 | 196.44 | 807 | 790 | 153.1 |
| C | 14 | 234 | 11752 | 60.58 | 785 | 793 | 180.9 |
| C | 14 | 67 | 10555 | 53.96 | 785 | 793 | 180.9 |
| C | 13 | 61 | 5803 | 27.69 | 785 | 793 | 180.9 |
| D | 1 | 52 | 1376834 | 7355.61 | 779 | 759 | 187.1 |
| D | 7 | 71 | 85589 | 453.45 | 779 | 759 | 187.1 |
| D | 13 | 104 | 47127 | 247.85 | 779 | 759 | 187.1 |
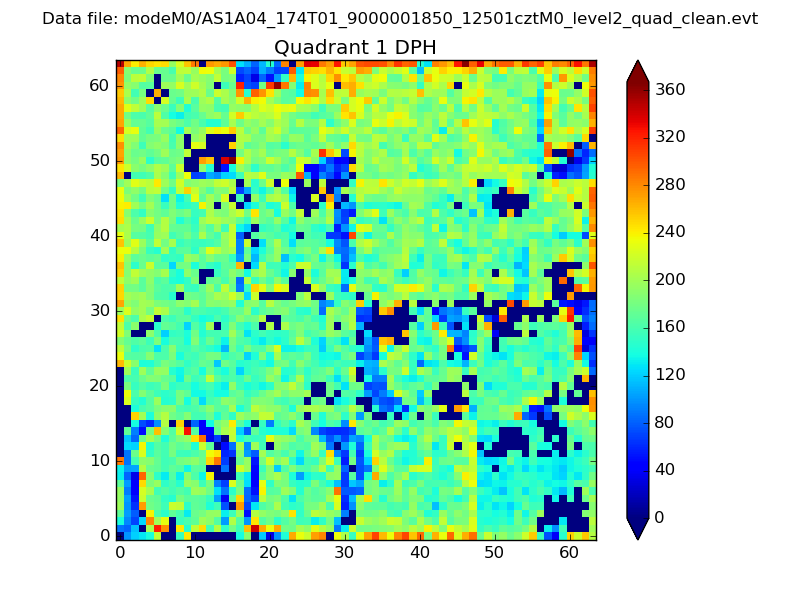
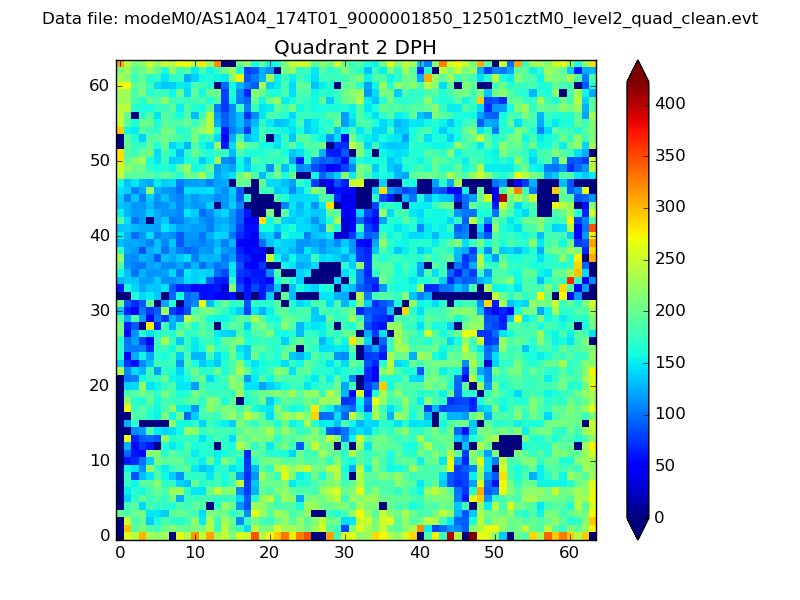
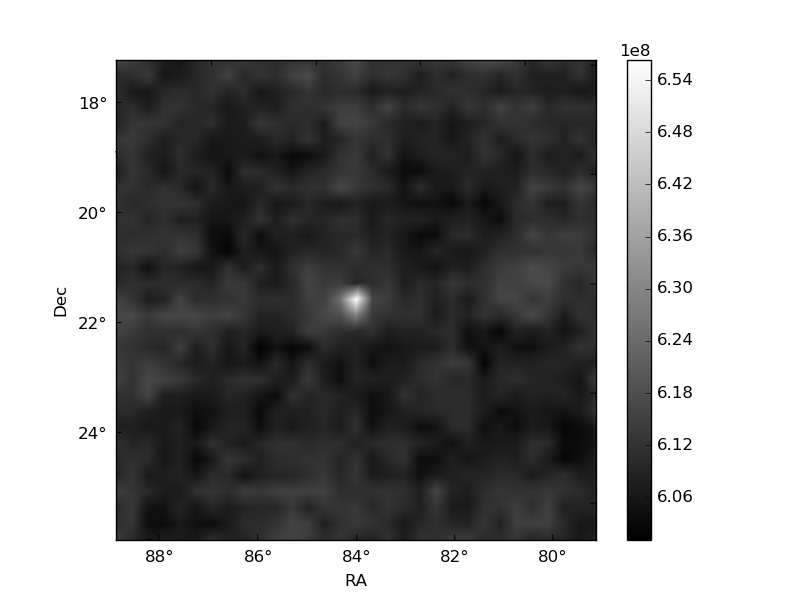
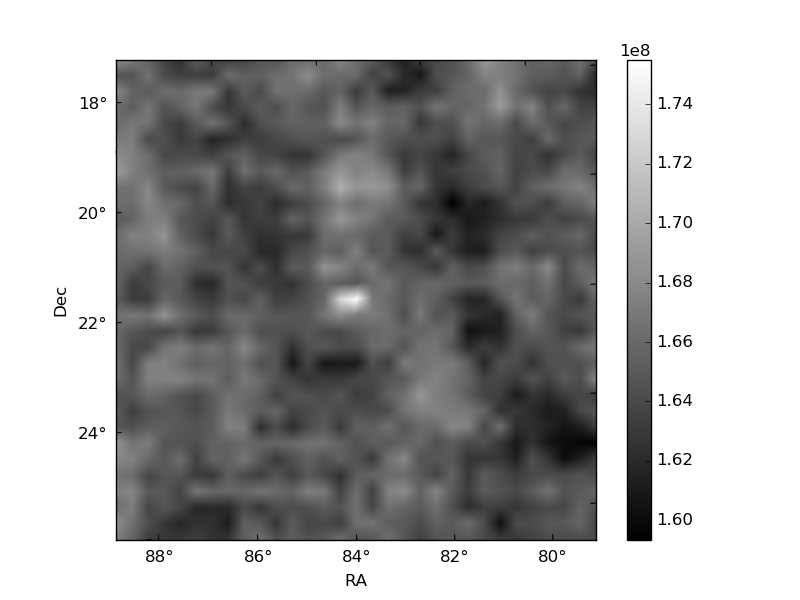
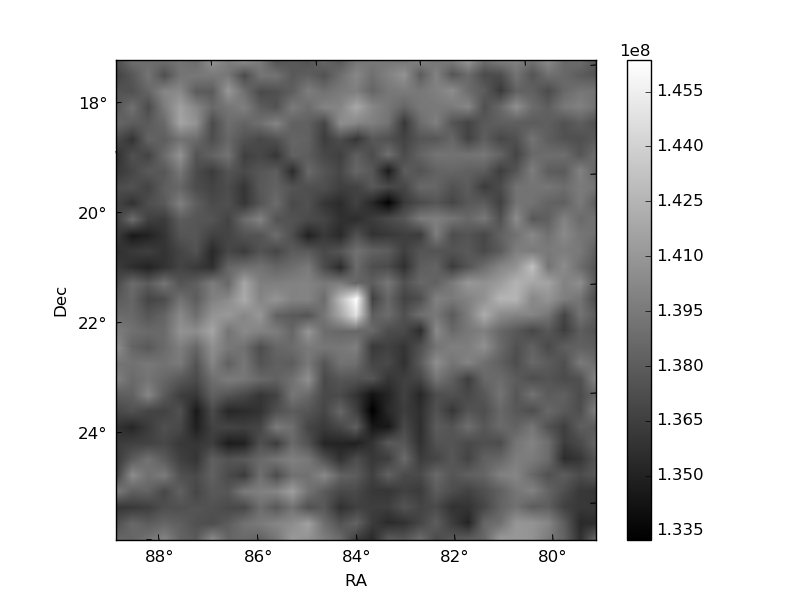
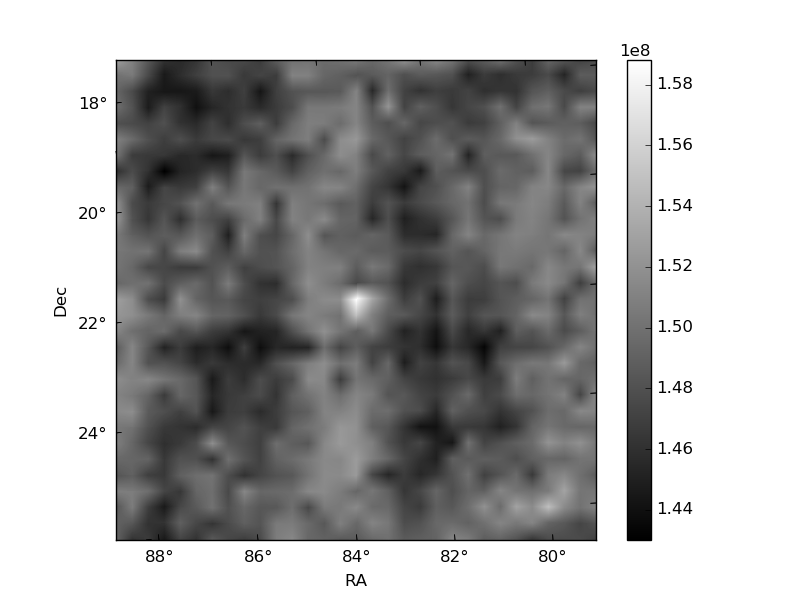
Histogram calculated using DETX and DETY for each event in the final _common_clean file
| Quadrant A |  |
 |
Quadrant B |
|---|---|---|---|
| Quadrant D | 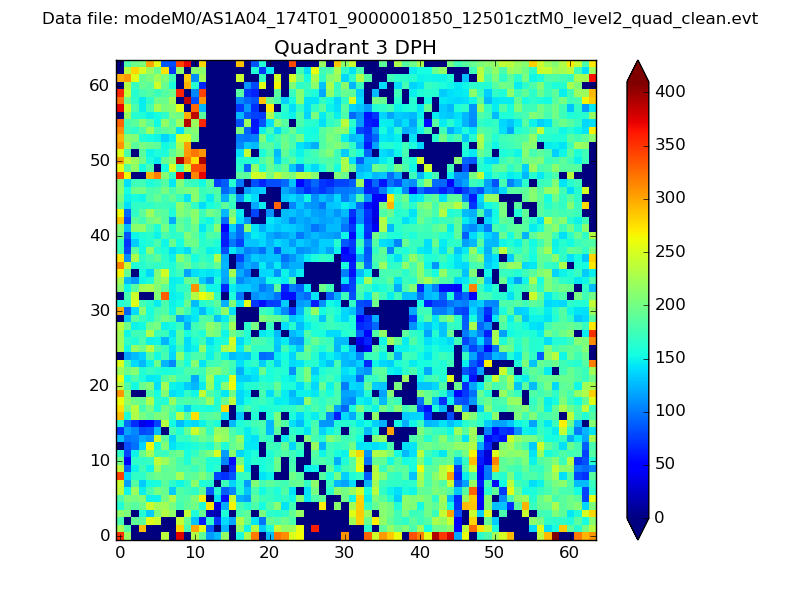 |
 |
Quadrant C |
| Plot type | Count rate plots | Images |
|---|---|---|
| Comparison with Poisson distribution Blue bars denote a histogram of data divided into 1 sec bins. Red curve is a Poisson curve with rate = median count rate of data. |
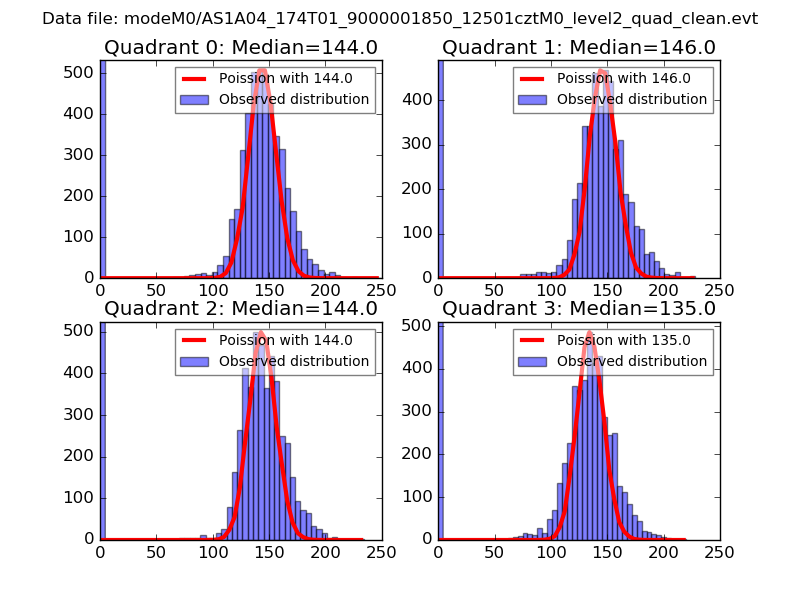 |
 |
| Quadrant-wise count rates Data is divided into 100 sec bins |
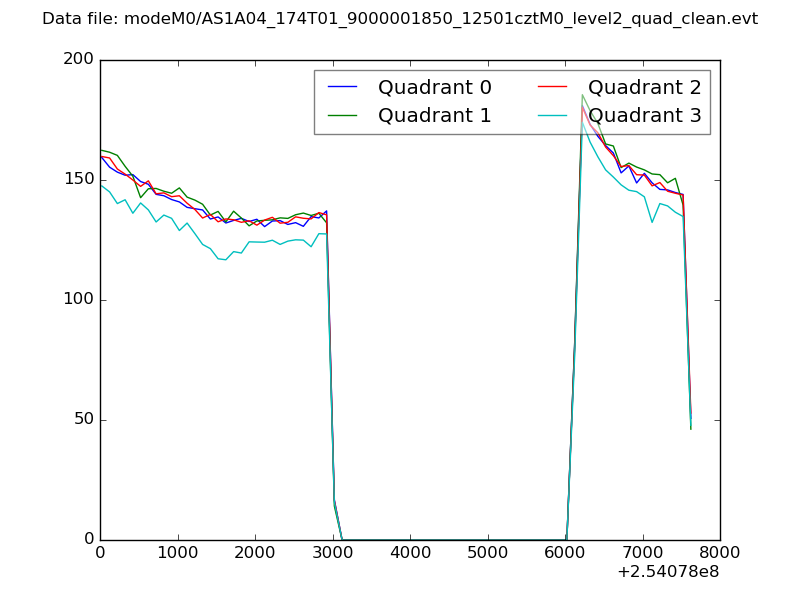 |
|
| Module-wise count rates for Quadrant A Data is divided into 100 sec bins |
 |
 |
| Module-wise count rates for Quadrant B Data is divided into 100 sec bins |
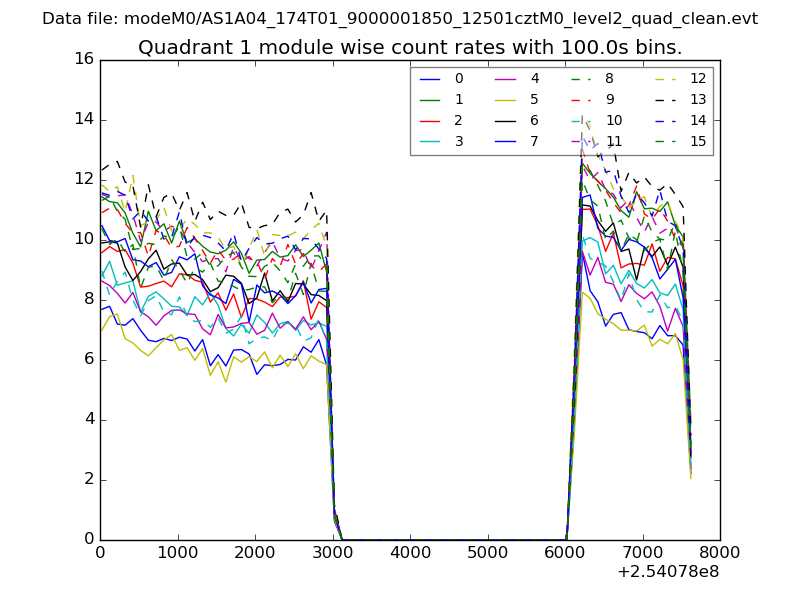 |
 |
| Module-wise count rates for Quadrant C Data is divided into 100 sec bins |
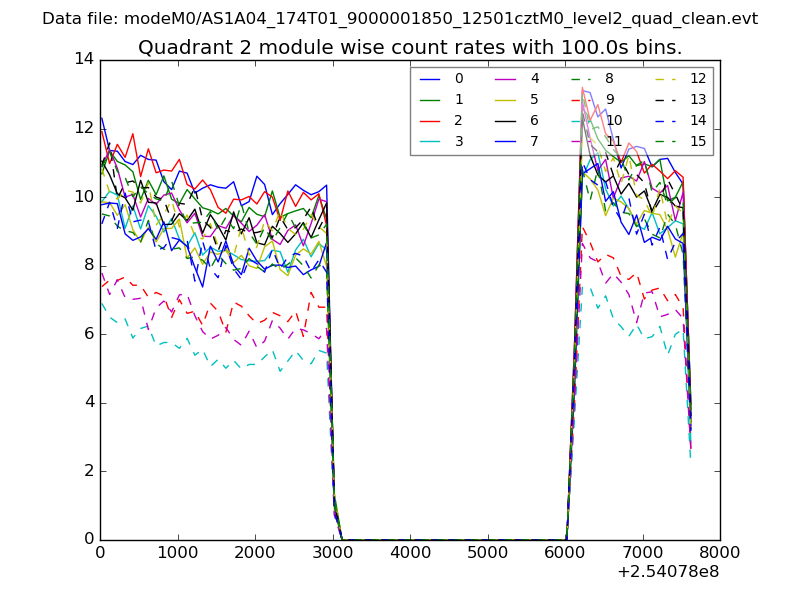 |
 |
| Module-wise count rates for Quadrant D Data is divided into 100 sec bins |
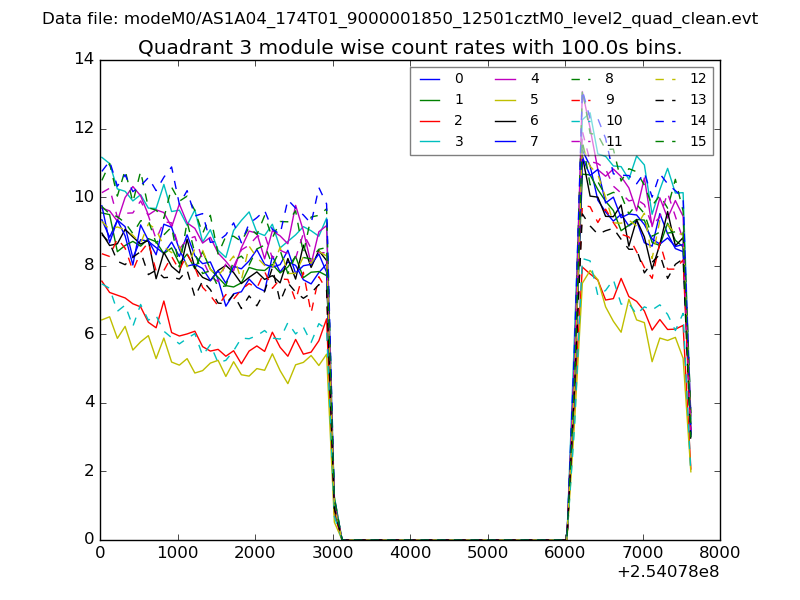 |
 |
| Parameter | Plot |
|---|---|
| CZT HV Monitor | 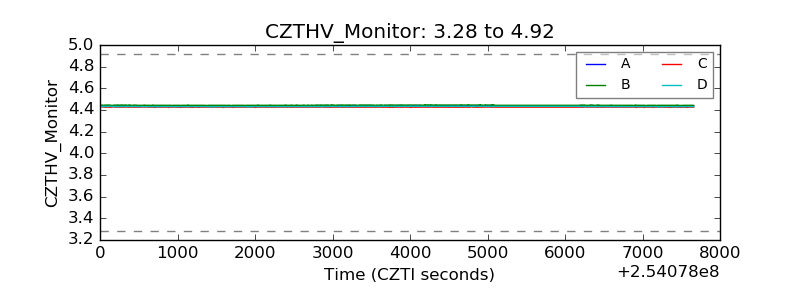 |
| D_VDD | 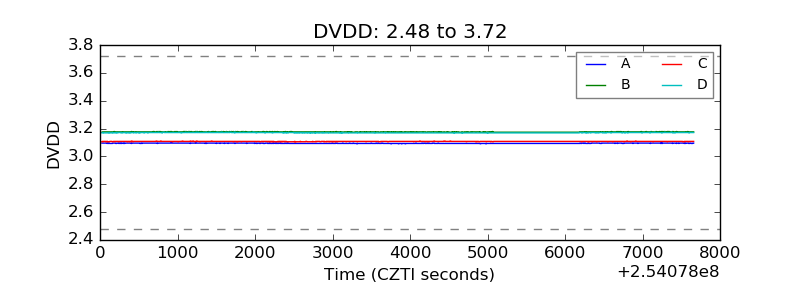 |
| Temperature 1 | 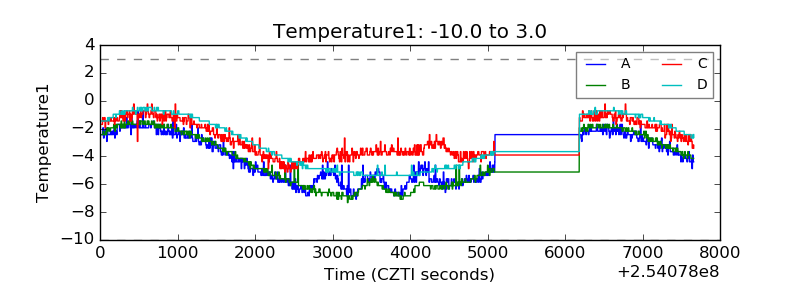 |
| Veto HV Monitor | 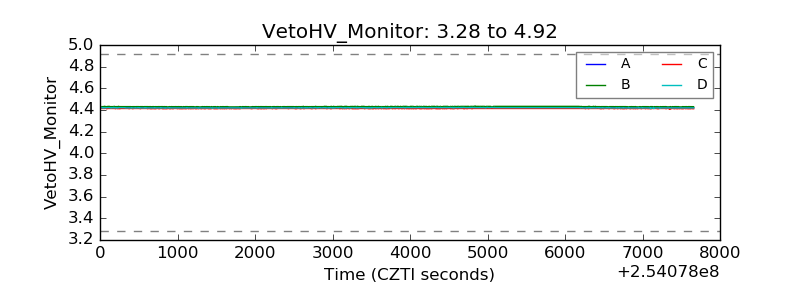 |
| Veto LLD | 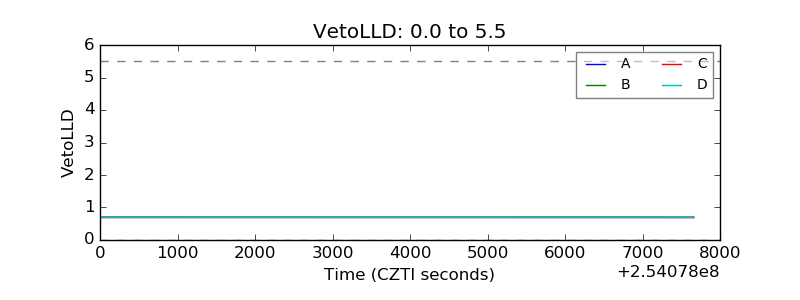 |
| Alpha Counter | 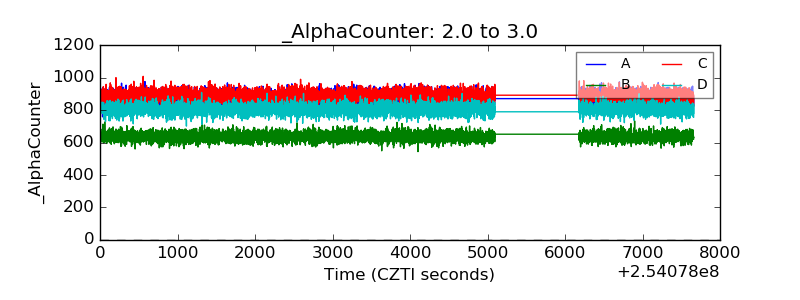 |
| _CPM_Rate | 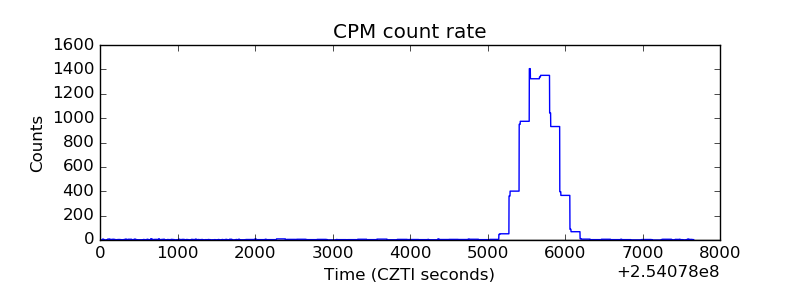 |
| CZT Counter | 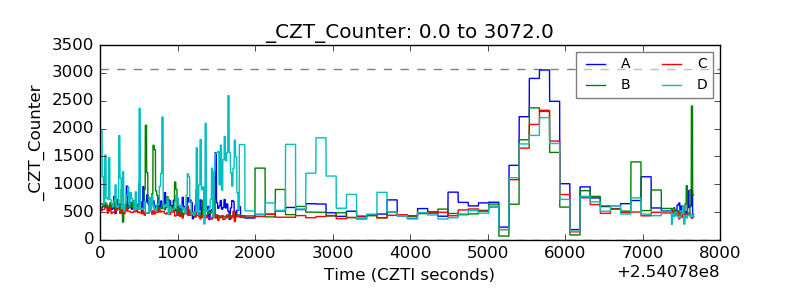 |
| +2.5 Volts monitor |  |
| +5 Volts monitor |  |
| _ROLL_ROT | 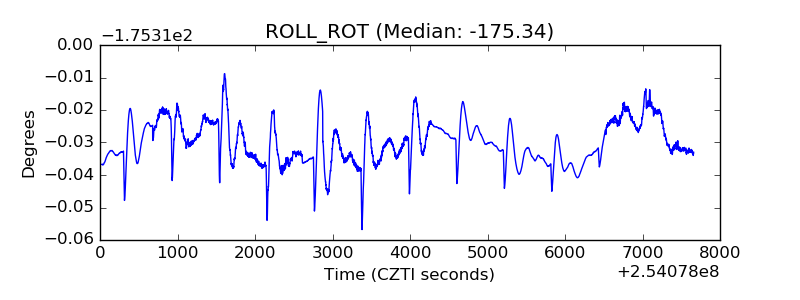 |
| _Roll_DEC | 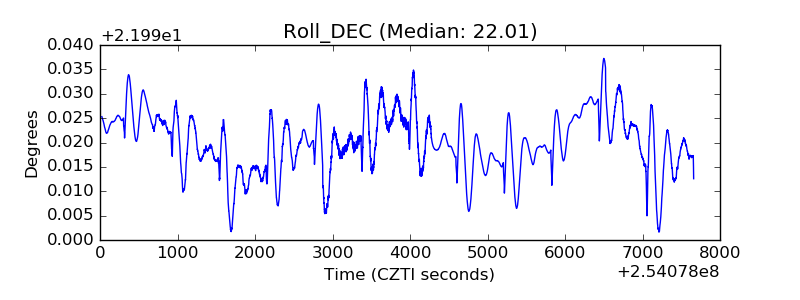 |
| _Roll_RA | 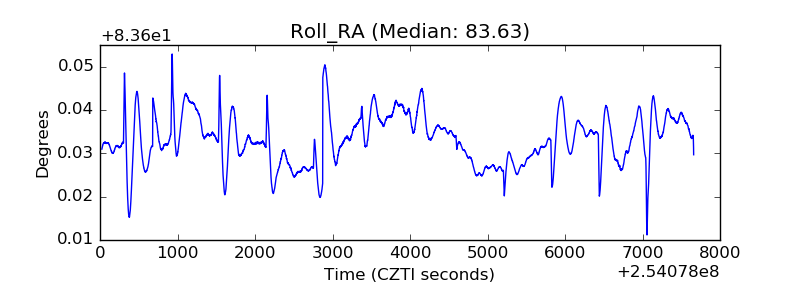 |
| Veto Counter | 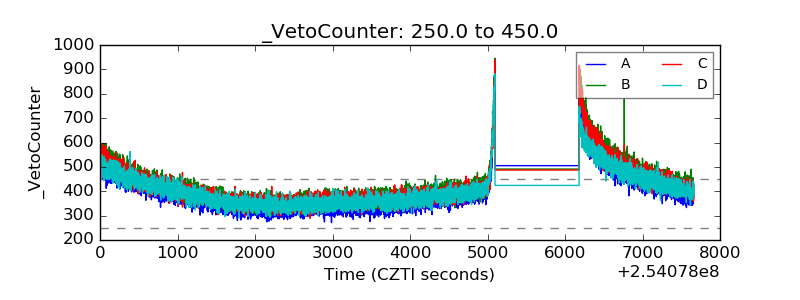 |