| Param | Original file | Final file |
|---|---|---|
| Filename | modeM0/AS1A04_174T01_9000001850_12503cztM0_level2.evt | modeM0/AS1A04_174T01_9000001850_12503cztM0_level2_quad_clean.evt |
| Size (bytes) | 452,496,960 | 84,211,200 |
| Size | 431.5 MB | 80.3 MB |
| Events in quadrant A | 3,420,752 | 543,679 |
| Events in quadrant B | 3,931,780 | 548,632 |
| Events in quadrant C | 2,789,062 | 542,240 |
| Events in quadrant D | 3,169,740 | 511,288 |
| Mode M0 | |||
|---|---|---|---|
| Quadrant | BADHDUFLAG | Total packets | Discarded packets |
| A | 0 | 14057 | 2 |
| B | 0 | 15493 | 1 |
| C | 0 | 12053 | 1 |
| D | 0 | 13294 | 1 |
| Mode M9 | |||
|---|---|---|---|
| Quadrant | BADHDUFLAG | Total packets | Discarded packets |
| A | 0 | 12 | 0 |
| B | 0 | 12 | 0 |
| C | 0 | 12 | 0 |
| D | 0 | 12 | 0 |
| Mode SS | |||
|---|---|---|---|
| Quadrant | BADHDUFLAG | Total packets | Discarded packets |
| A | 0 | 118 | 0 |
| B | 0 | 118 | 0 |
| C | 0 | 118 | 0 |
| D | 0 | 118 | 0 |
| Quadrant | Total seconds | Saturated seconds | Saturation percentage |
|---|---|---|---|
| A | 5781 | 95 | 1.643314% |
| B | 5781 | 223 | 3.857464% |
| C | 5781 | 48 | 0.830306% |
| D | 5781 | 69 | 1.193565% |
Noise dominated data is calculated using 1-second bins in cleaned event files. If a bin has >2000 counts, and if more than 50% of those come from <1% of pixels, then it is considered to be noise-dominated and hence unusable.
| Quadrant | # 1 sec bins | Bins with >0 counts | Bins with >2000 counts | High rate bins dominated by noise | Noise dominated (total time) | Noise dominated (detector-on time) | Marked lightcurve |
|---|---|---|---|---|---|---|---|
| A | 6977 | 5782 | 9 | 9 | 0.13% | 0.16% | 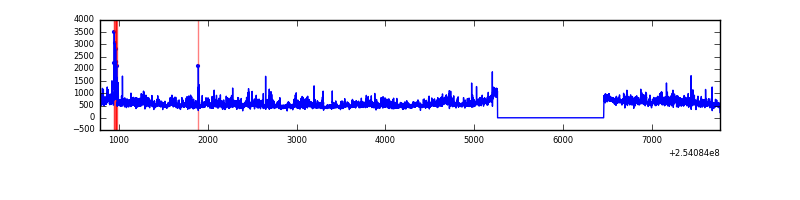 |
| B | 6977 | 5783 | 69 | 69 | 0.99% | 1.19% |  |
| C | 6977 | 5783 | 5 | 5 | 0.07% | 0.09% | 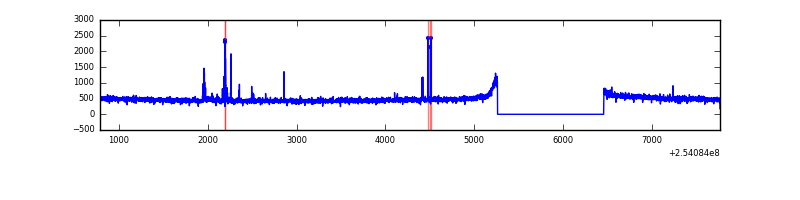 |
| D | 6977 | 5783 | 22 | 22 | 0.32% | 0.38% |  |
Top three noisy pixels from each quadrant. If the there are fewer than three noisy pixels in the level2.evt file, extra rows are filled as -1
| Pixel properties | Quadrant properties | ||||||
|---|---|---|---|---|---|---|---|
| Quadrant | DetID | PixID | Counts | Sigma | Mean | Median | Sigma |
| A | 1 | 162 | 206102 | 1411.89 | 715 | 704 | 145.5 |
| A | 1 | 178 | 124043 | 847.82 | 715 | 704 | 145.5 |
| A | 1 | 161 | 105602 | 721.06 | 715 | 704 | 145.5 |
| B | 4 | 239 | 696741 | 5158.82 | 712 | 698 | 134.9 |
| B | 3 | 64 | 396739 | 2935.31 | 712 | 698 | 134.9 |
| B | 11 | 51 | 17525 | 124.72 | 712 | 698 | 134.9 |
| C | 7 | 238 | 37917 | 229.39 | 698 | 704 | 162.2 |
| C | 14 | 234 | 18093 | 107.19 | 698 | 704 | 162.2 |
| C | 14 | 67 | 6965 | 38.59 | 698 | 704 | 162.2 |
| D | 13 | 104 | 185382 | 1100.69 | 694 | 676 | 167.8 |
| D | 7 | 80 | 141908 | 841.62 | 694 | 676 | 167.8 |
| D | 1 | 52 | 115663 | 685.22 | 694 | 676 | 167.8 |
Histogram calculated using DETX and DETY for each event in the final _common_clean file
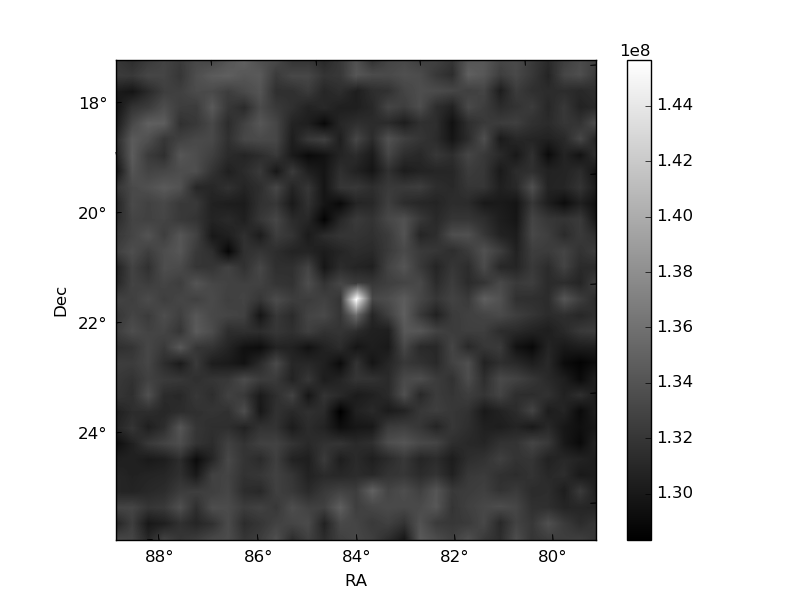
| Quadrant A | 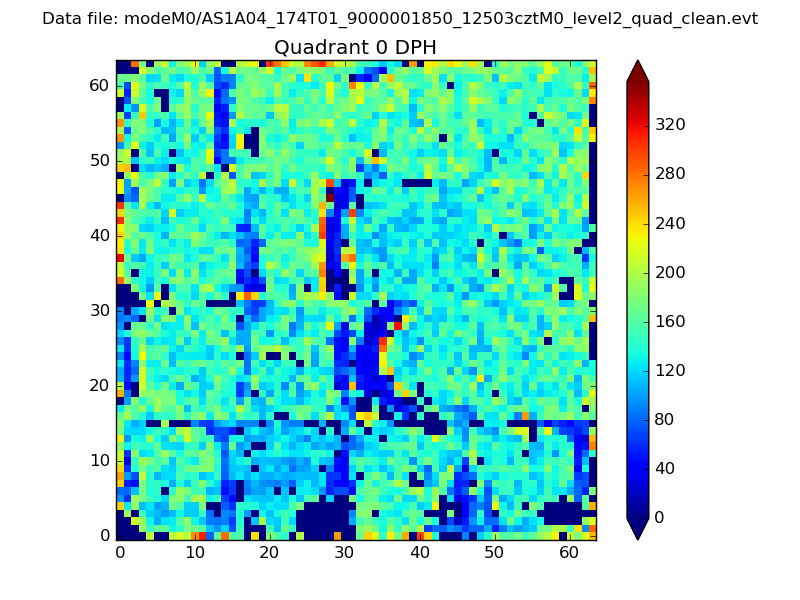 |
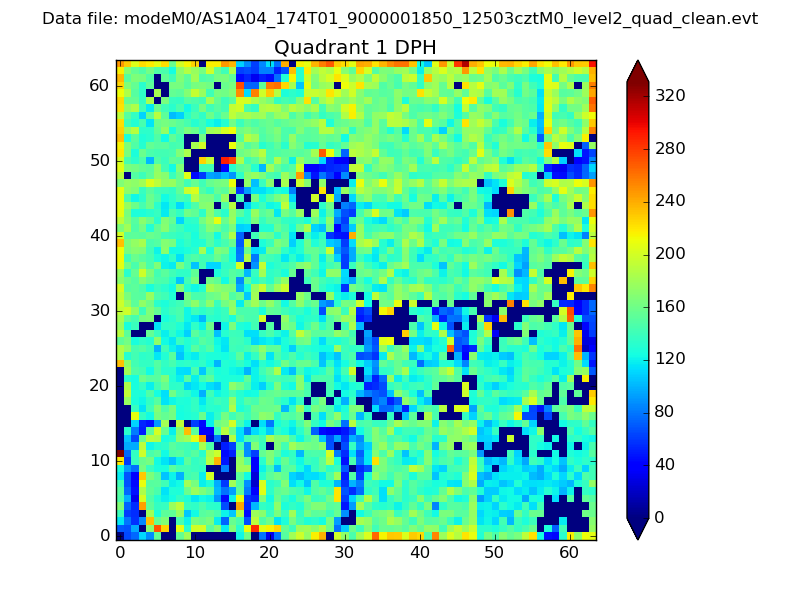 |
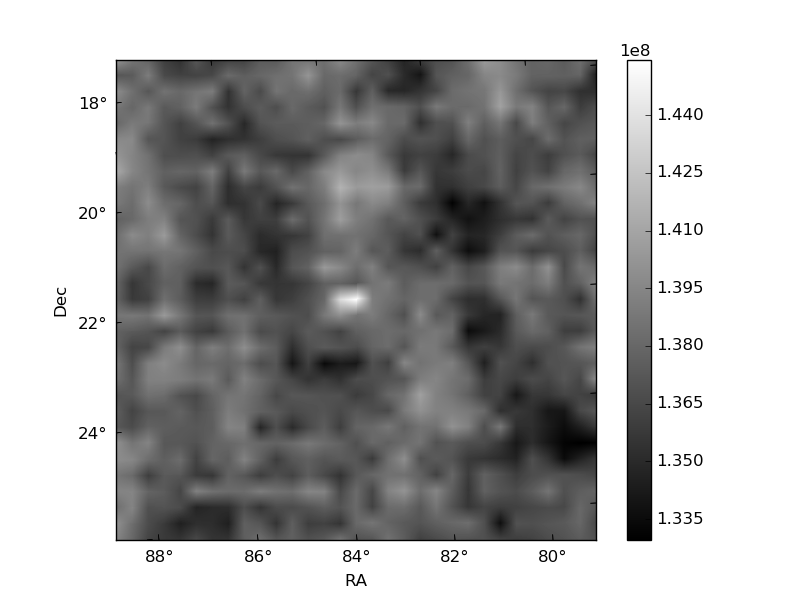
Quadrant B |
|---|---|---|---|
| Quadrant D |  |
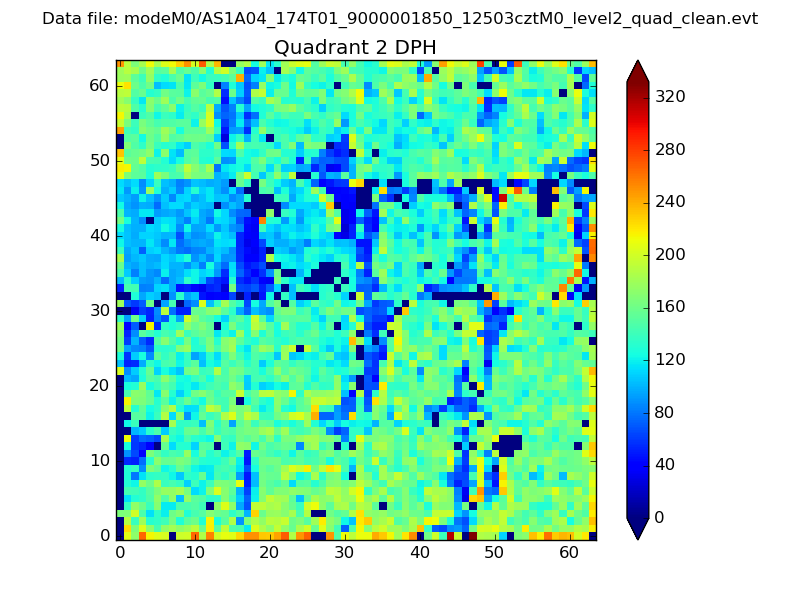 |
Quadrant C |
| Plot type | Count rate plots | Images |
|---|---|---|
| Comparison with Poisson distribution Blue bars denote a histogram of data divided into 1 sec bins. Red curve is a Poisson curve with rate = median count rate of data. |
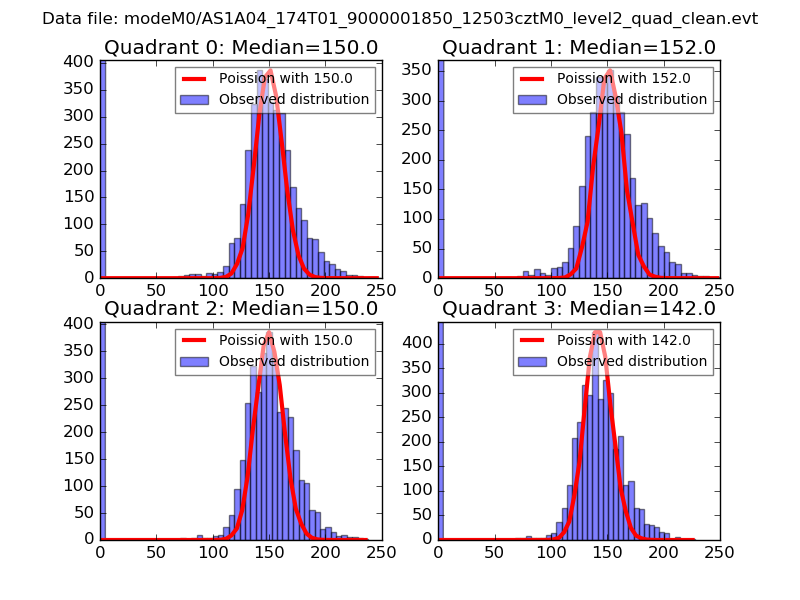 |
 |
| Quadrant-wise count rates Data is divided into 100 sec bins |
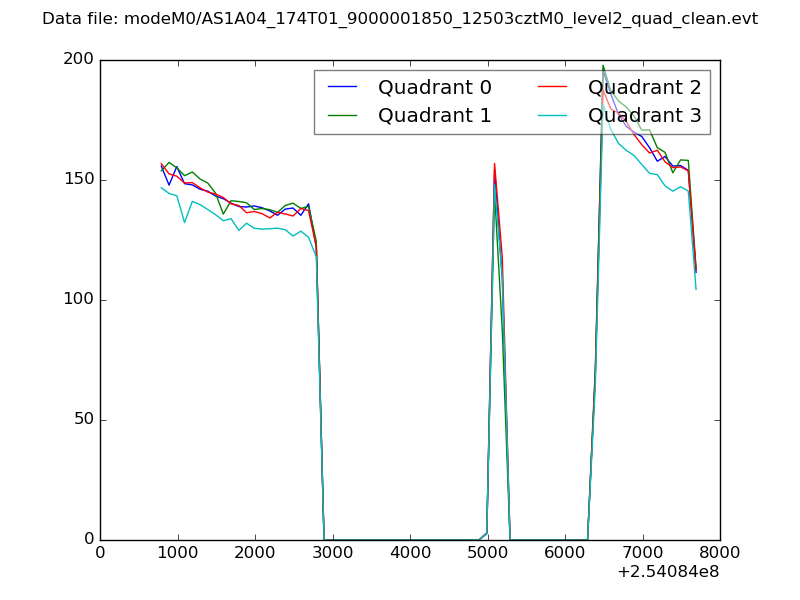 |
|
| Module-wise count rates for Quadrant A Data is divided into 100 sec bins |
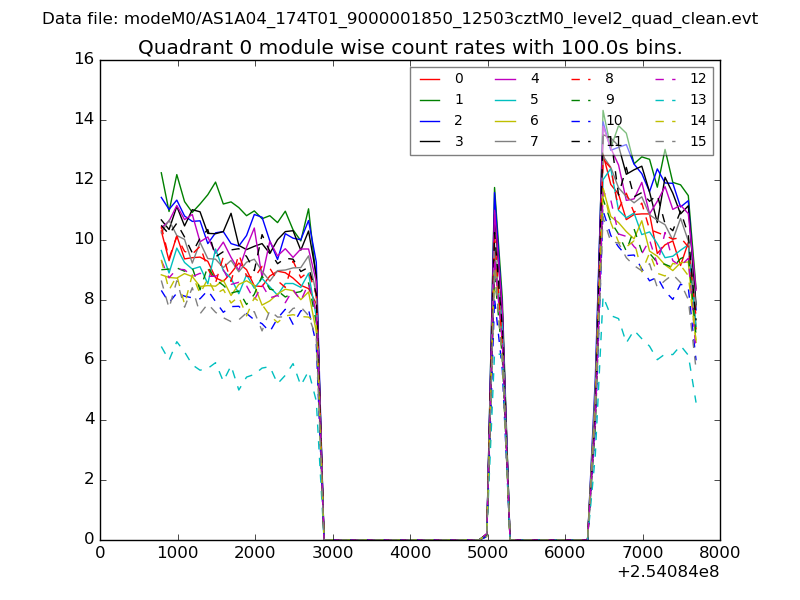 |
 |
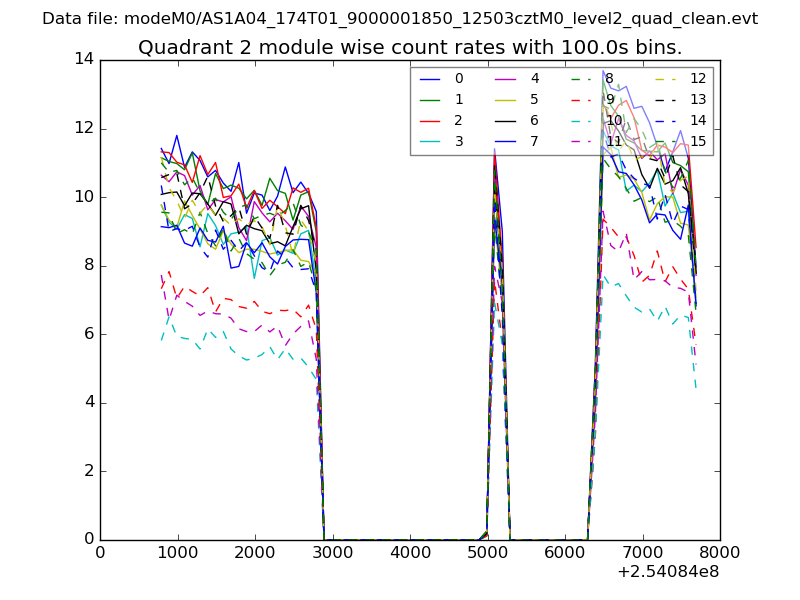
| Module-wise count rates for Quadrant B Data is divided into 100 sec bins |
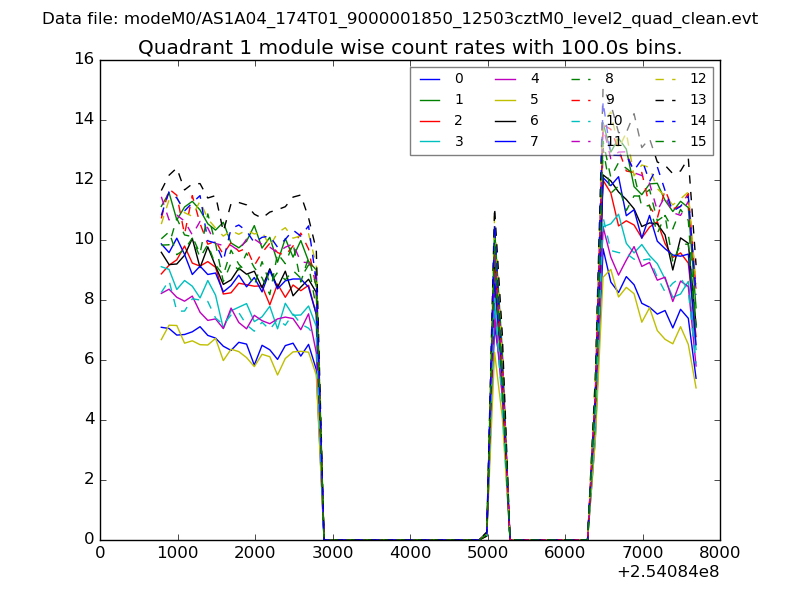 |
 |
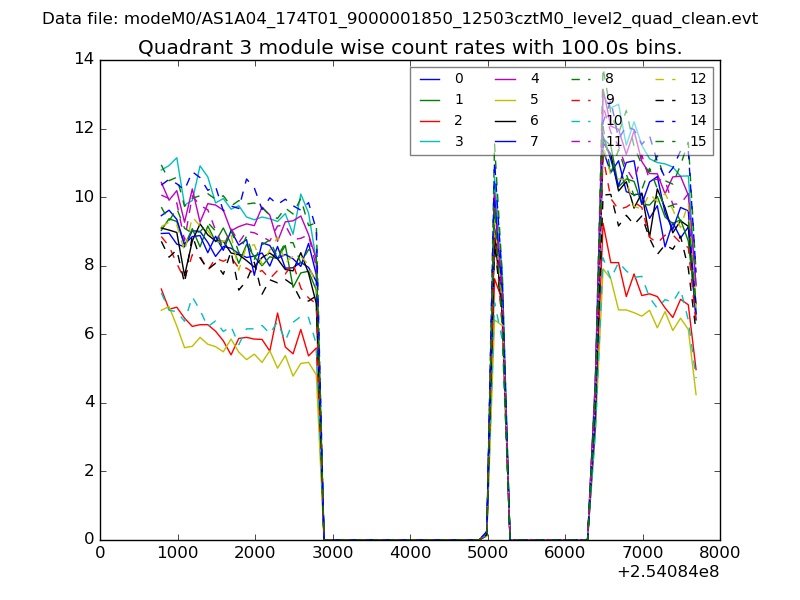
| Module-wise count rates for Quadrant C Data is divided into 100 sec bins |
 |
 |
| Module-wise count rates for Quadrant D Data is divided into 100 sec bins |
 |
 |
| Parameter | Plot |
|---|---|
| CZT HV Monitor | 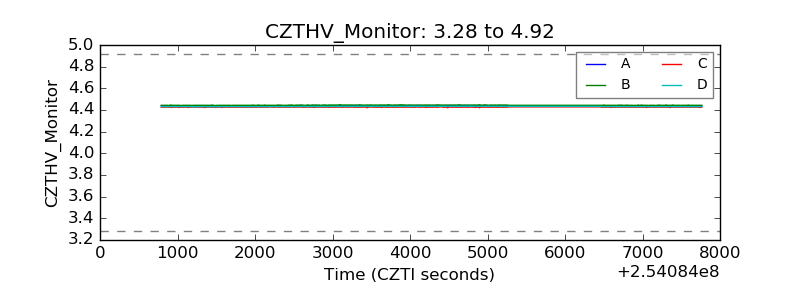 |
| D_VDD | 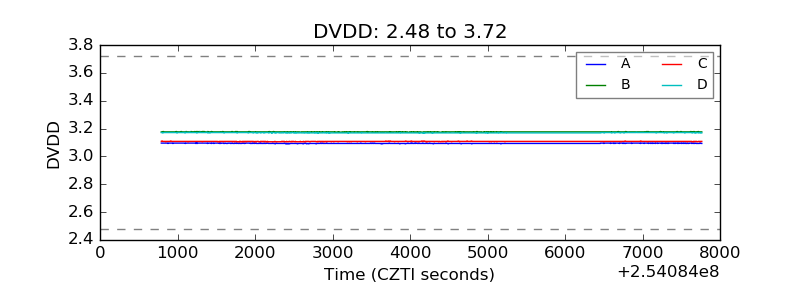 |
| Temperature 1 | 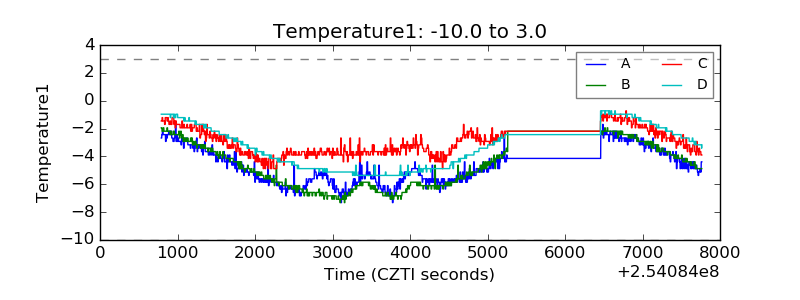 |
| Veto HV Monitor | 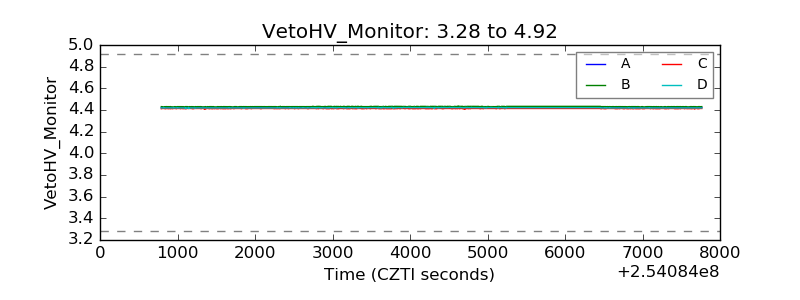 |
| Veto LLD |  |
| Alpha Counter | 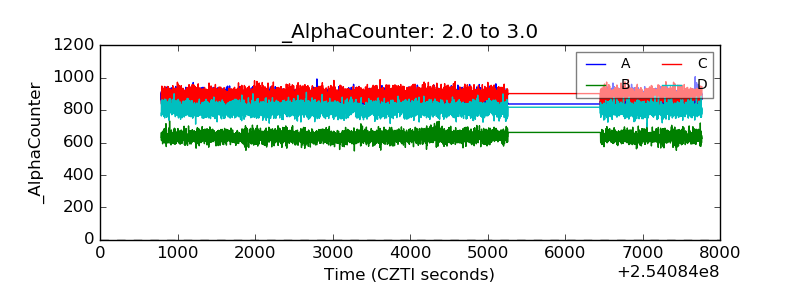 |
| _CPM_Rate | 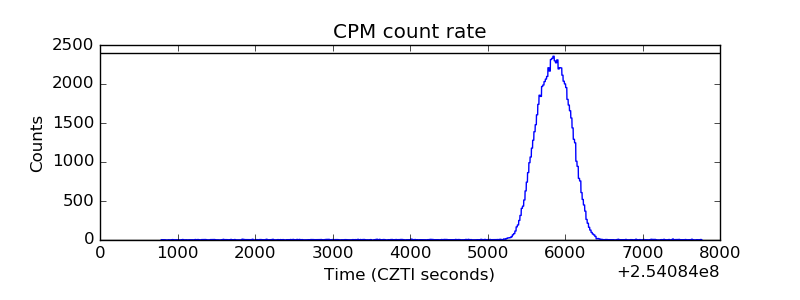 |
| CZT Counter | 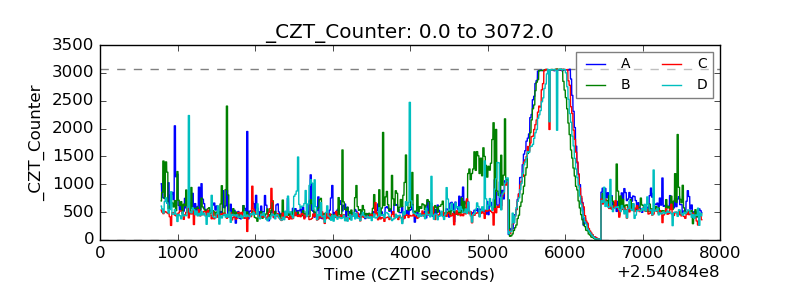 |
| +2.5 Volts monitor |  |
| +5 Volts monitor |  |
| _ROLL_ROT | 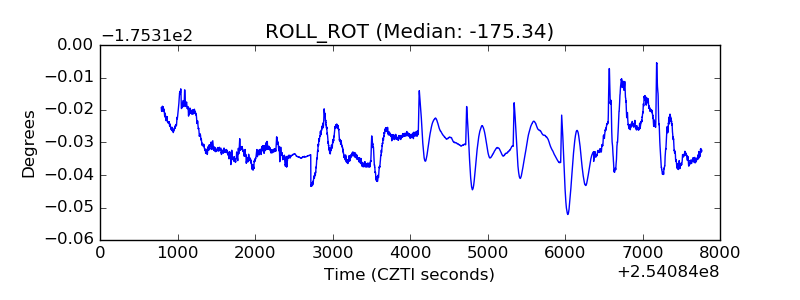 |
| _Roll_DEC | 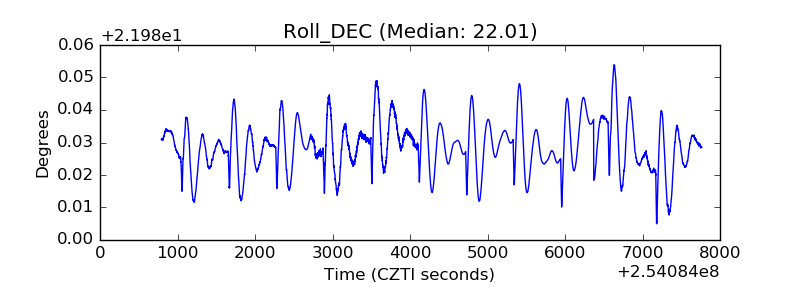 |
| _Roll_RA | 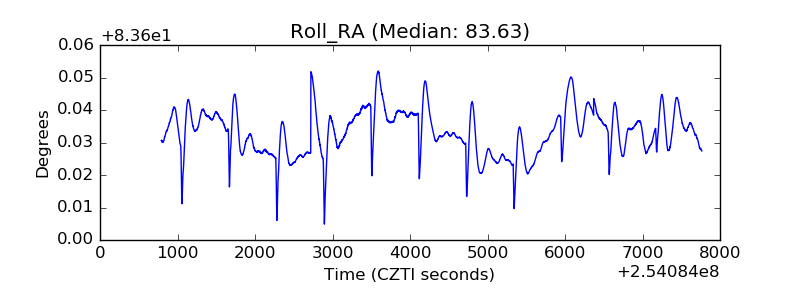 |
| Veto Counter | 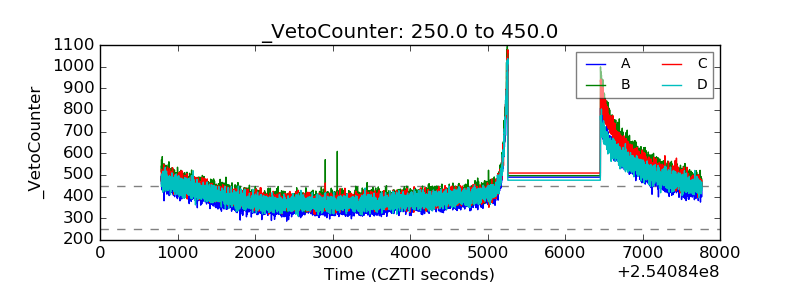 |