| Param | Original file | Final file |
|---|---|---|
| Filename | modeM0/AS1A04_174T01_9000001850_12504cztM0_level2.evt | modeM0/AS1A04_174T01_9000001850_12504cztM0_level2_quad_clean.evt |
| Size (bytes) | 445,331,520 | 85,383,360 |
| Size | 424.7 MB | 81.4 MB |
| Events in quadrant A | 3,379,129 | 556,702 |
| Events in quadrant B | 3,475,882 | 564,341 |
| Events in quadrant C | 2,887,857 | 553,885 |
| Events in quadrant D | 3,356,380 | 511,610 |
| Mode M0 | |||
|---|---|---|---|
| Quadrant | BADHDUFLAG | Total packets | Discarded packets |
| A | 0 | 13915 | 2 |
| B | 0 | 13913 | 1 |
| C | 0 | 12219 | 1 |
| D | 0 | 13864 | 1 |
| Mode M9 | |||
|---|---|---|---|
| Quadrant | BADHDUFLAG | Total packets | Discarded packets |
| A | 0 | 12 | 0 |
| B | 0 | 12 | 0 |
| C | 0 | 12 | 0 |
| D | 0 | 12 | 0 |
| Mode SS | |||
|---|---|---|---|
| Quadrant | BADHDUFLAG | Total packets | Discarded packets |
| A | 0 | 118 | 0 |
| B | 0 | 118 | 0 |
| C | 0 | 118 | 0 |
| D | 0 | 118 | 0 |
| Quadrant | Total seconds | Saturated seconds | Saturation percentage |
|---|---|---|---|
| A | 5699 | 62 | 1.087910% |
| B | 5699 | 176 | 3.088261% |
| C | 5699 | 62 | 1.087910% |
| D | 5699 | 172 | 3.018073% |
Noise dominated data is calculated using 1-second bins in cleaned event files. If a bin has >2000 counts, and if more than 50% of those come from <1% of pixels, then it is considered to be noise-dominated and hence unusable.
| Quadrant | # 1 sec bins | Bins with >0 counts | Bins with >2000 counts | High rate bins dominated by noise | Noise dominated (total time) | Noise dominated (detector-on time) | Marked lightcurve |
|---|---|---|---|---|---|---|---|
| A | 6970 | 5701 | 1 | 1 | 0.01% | 0.02% | 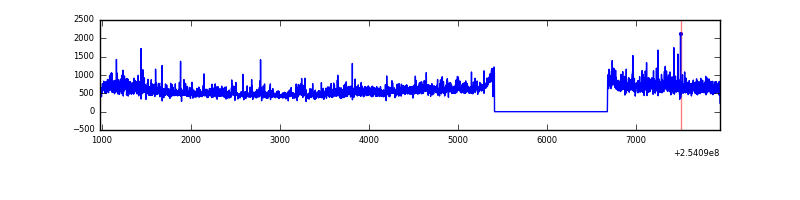 |
| B | 6970 | 5701 | 80 | 80 | 1.15% | 1.40% | 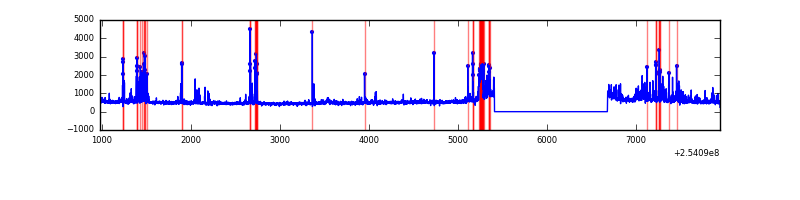 |
| C | 6970 | 5701 | 19 | 19 | 0.27% | 0.33% | 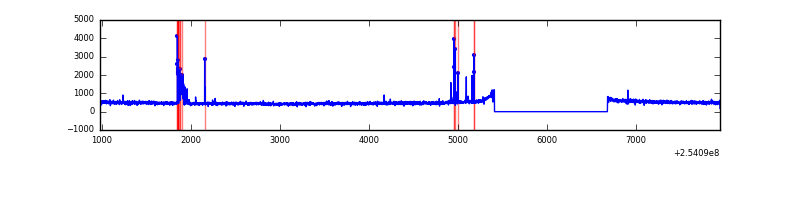 |
| D | 6970 | 5701 | 128 | 128 | 1.84% | 2.25% | 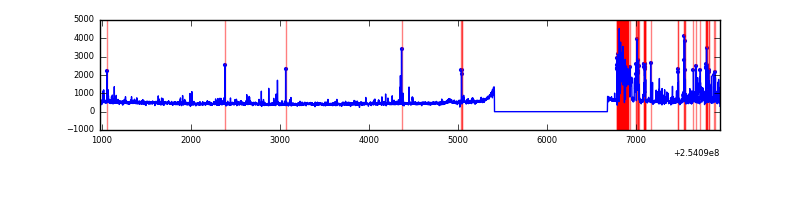 |
Top three noisy pixels from each quadrant. If the there are fewer than three noisy pixels in the level2.evt file, extra rows are filled as -1
| Pixel properties | Quadrant properties | ||||||
|---|---|---|---|---|---|---|---|
| Quadrant | DetID | PixID | Counts | Sigma | Mean | Median | Sigma |
| A | 1 | 162 | 178844 | 1214.31 | 721 | 707 | 146.7 |
| A | 12 | 189 | 121755 | 825.15 | 721 | 707 | 146.7 |
| A | 1 | 178 | 107894 | 730.66 | 721 | 707 | 146.7 |
| B | 4 | 239 | 393534 | 2890.49 | 724 | 708 | 135.9 |
| B | 3 | 64 | 173398 | 1270.69 | 724 | 708 | 135.9 |
| B | 0 | 214 | 34717 | 250.25 | 724 | 708 | 135.9 |
| C | 7 | 238 | 64758 | 393.47 | 704 | 714 | 162.8 |
| C | 14 | 234 | 49916 | 302.29 | 704 | 714 | 162.8 |
| C | 7 | 239 | 26331 | 157.39 | 704 | 714 | 162.8 |
| D | 1 | 52 | 540194 | 3244.21 | 690 | 673 | 166.3 |
| D | 13 | 104 | 82774 | 493.68 | 690 | 673 | 166.3 |
| D | 7 | 71 | 35582 | 209.91 | 690 | 673 | 166.3 |
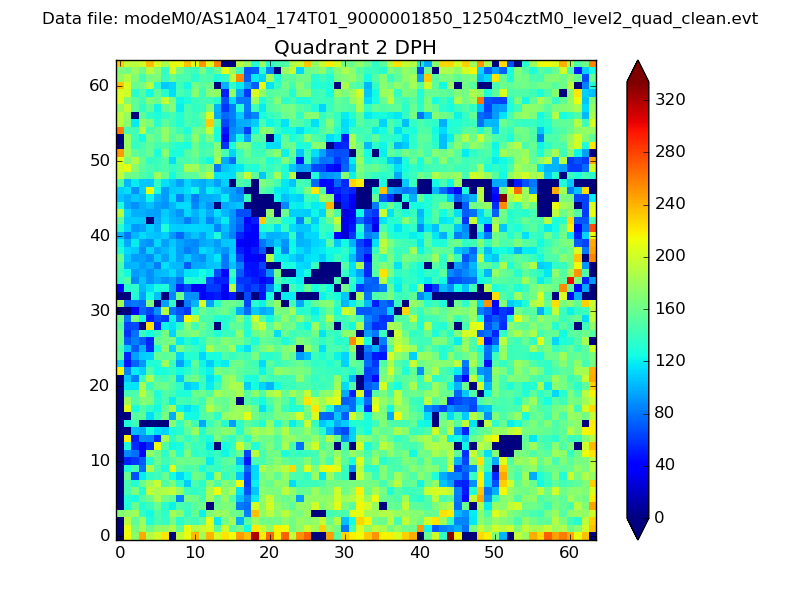
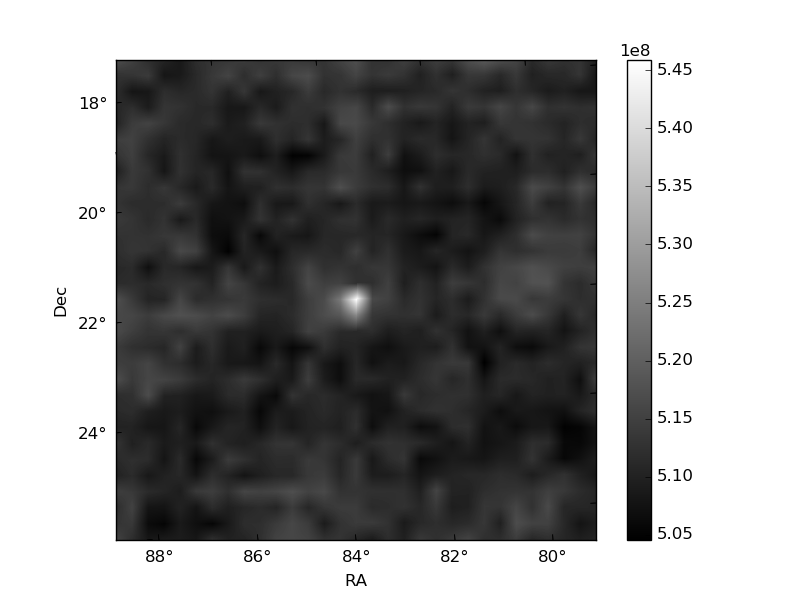
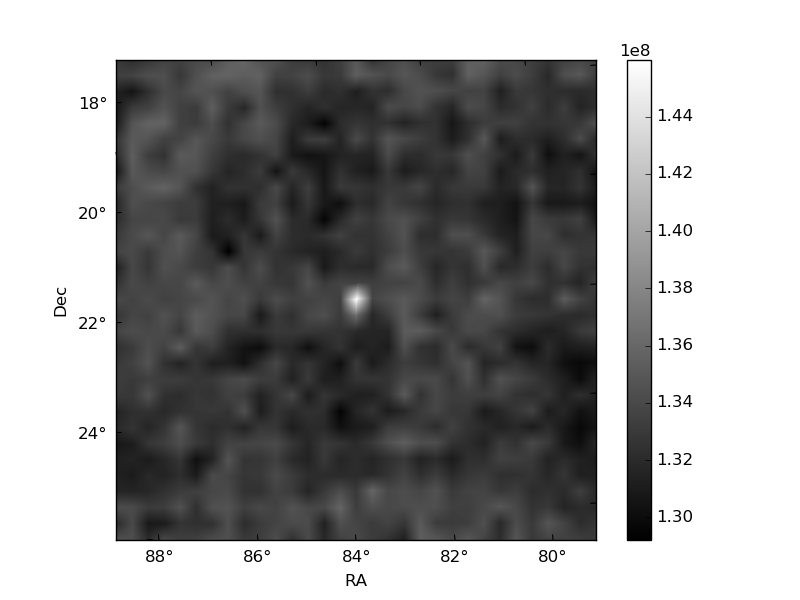
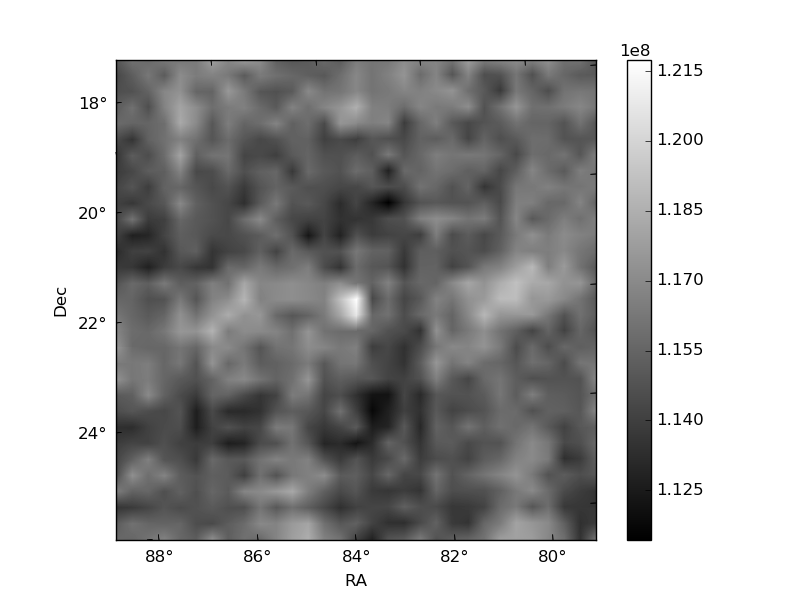
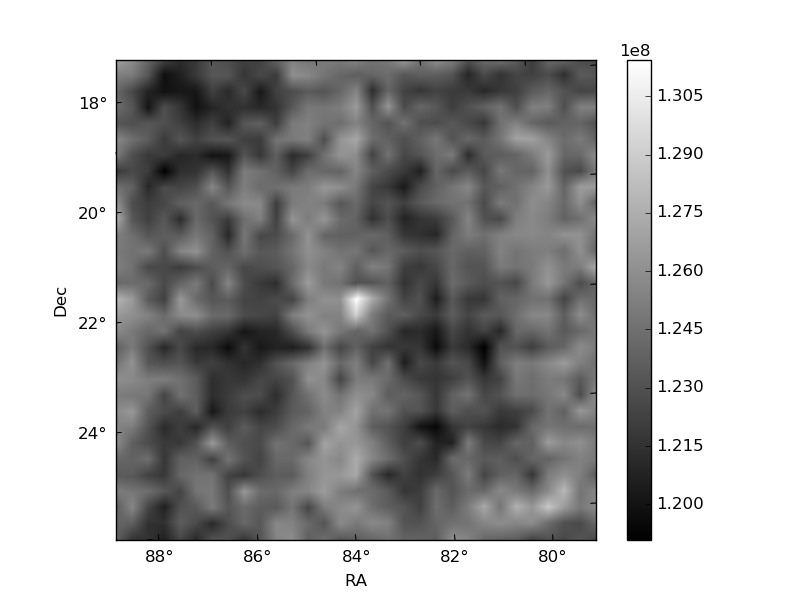
Histogram calculated using DETX and DETY for each event in the final _common_clean file
| Quadrant A | 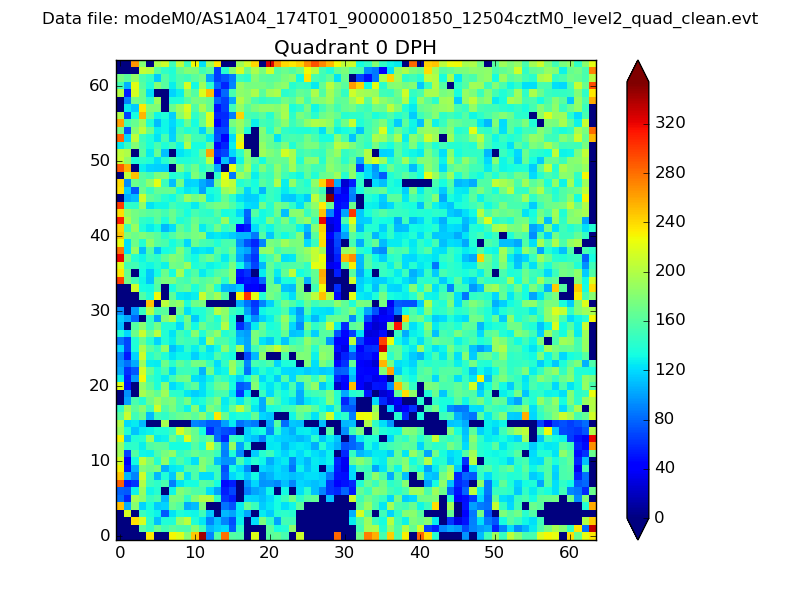 |
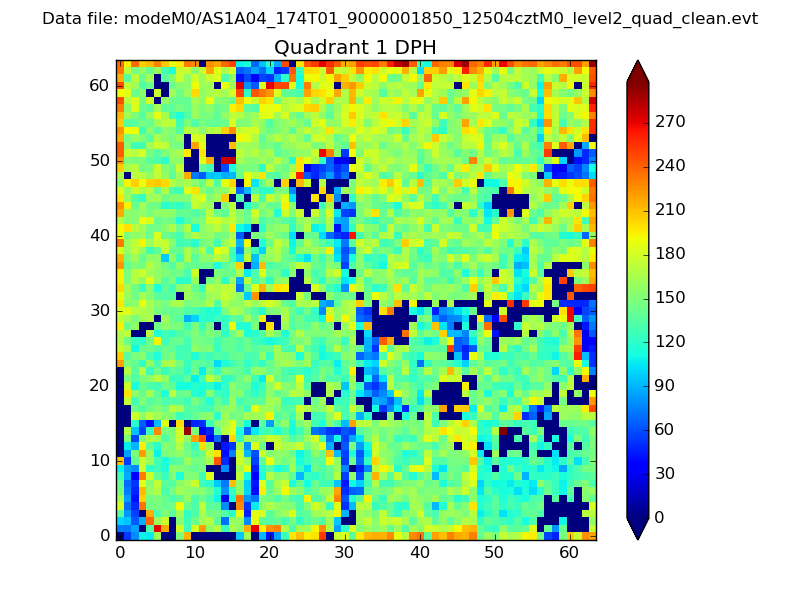 |
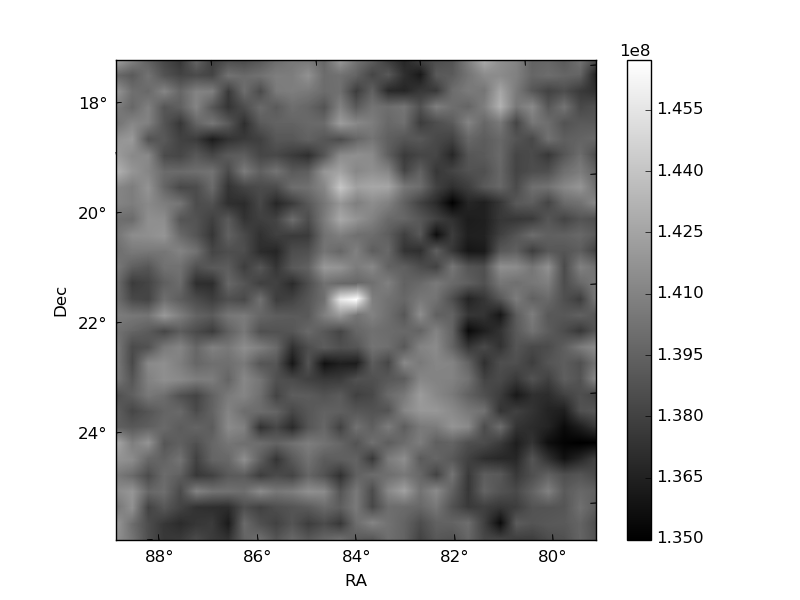
Quadrant B |
|---|---|---|---|
| Quadrant D | 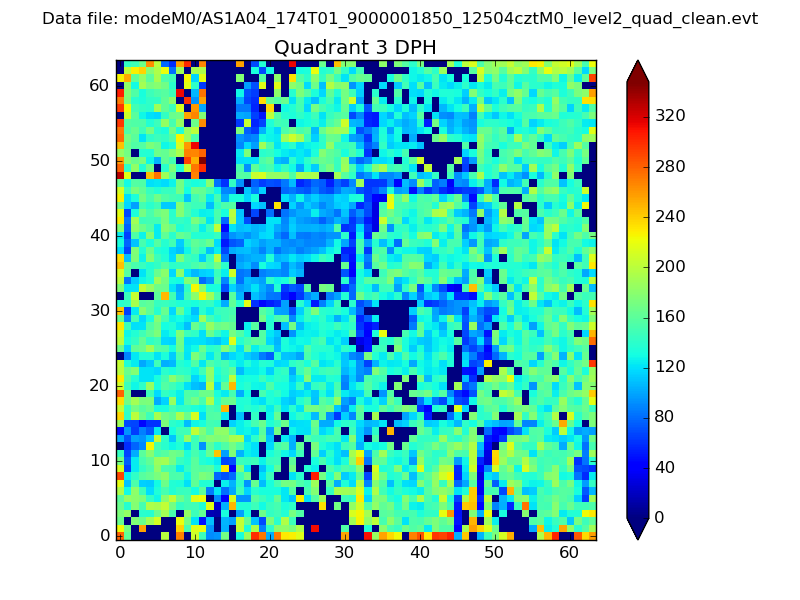 |
 |
Quadrant C |
| Plot type | Count rate plots | Images |
|---|---|---|
| Comparison with Poisson distribution Blue bars denote a histogram of data divided into 1 sec bins. Red curve is a Poisson curve with rate = median count rate of data. |
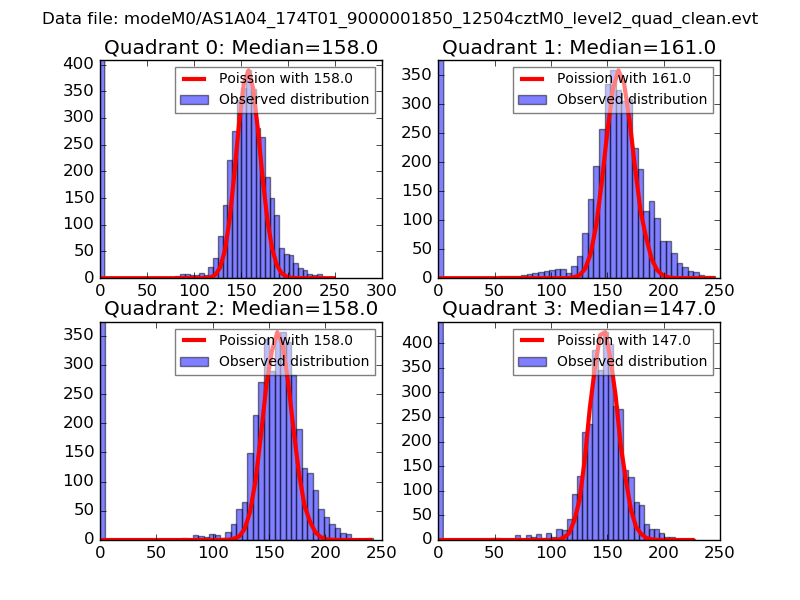 |
 |
| Quadrant-wise count rates Data is divided into 100 sec bins |
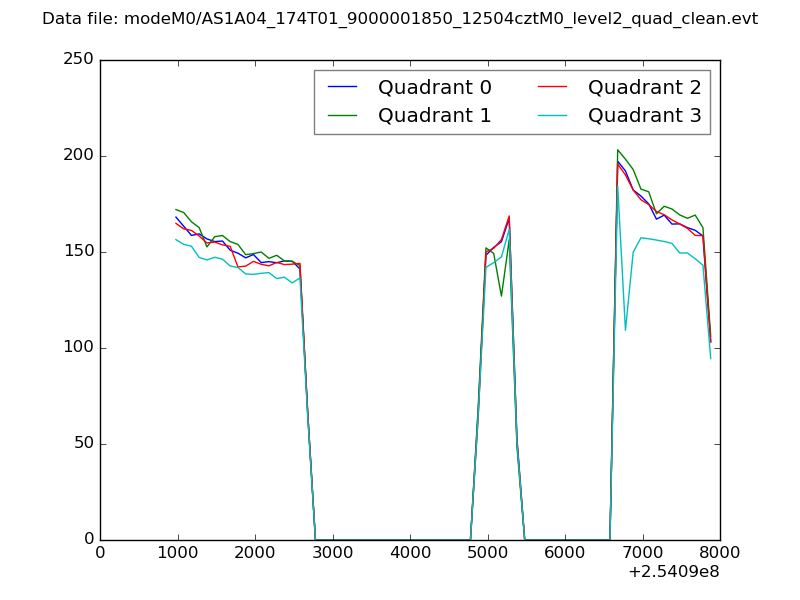 |
|
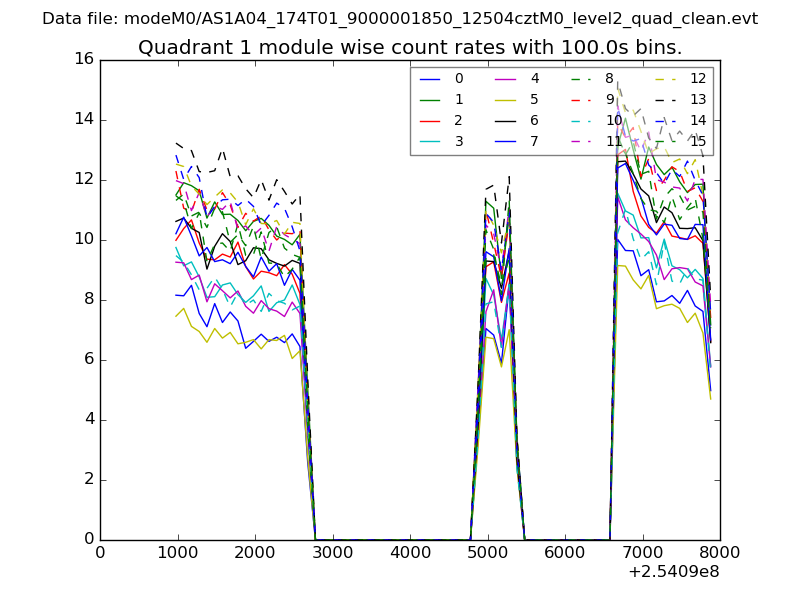
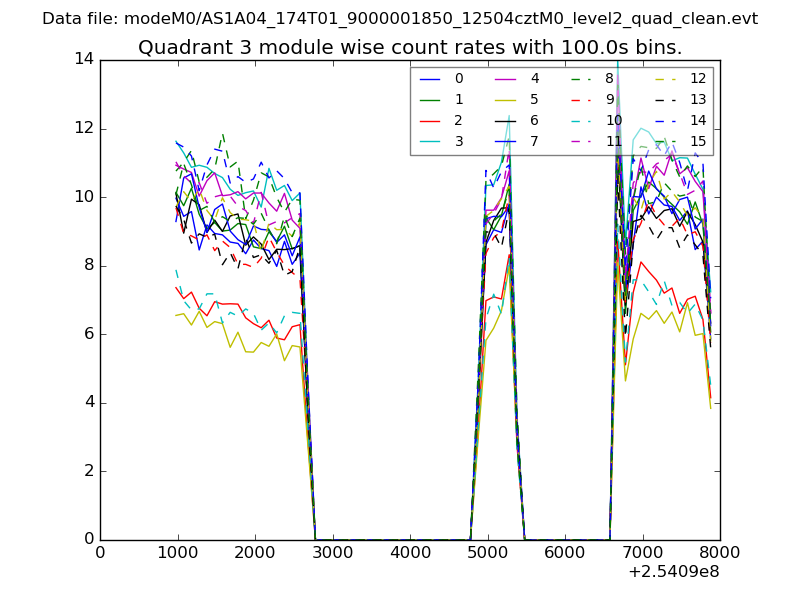
| Module-wise count rates for Quadrant A Data is divided into 100 sec bins |
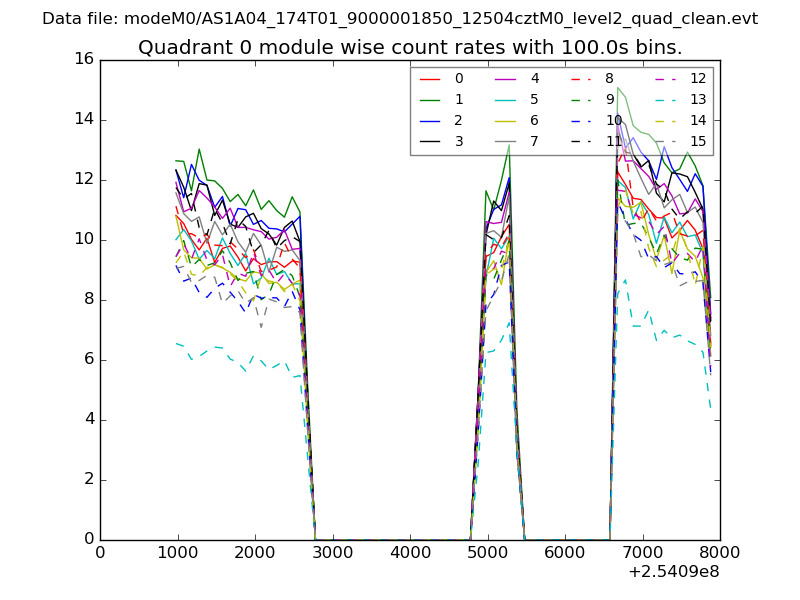 |
 |
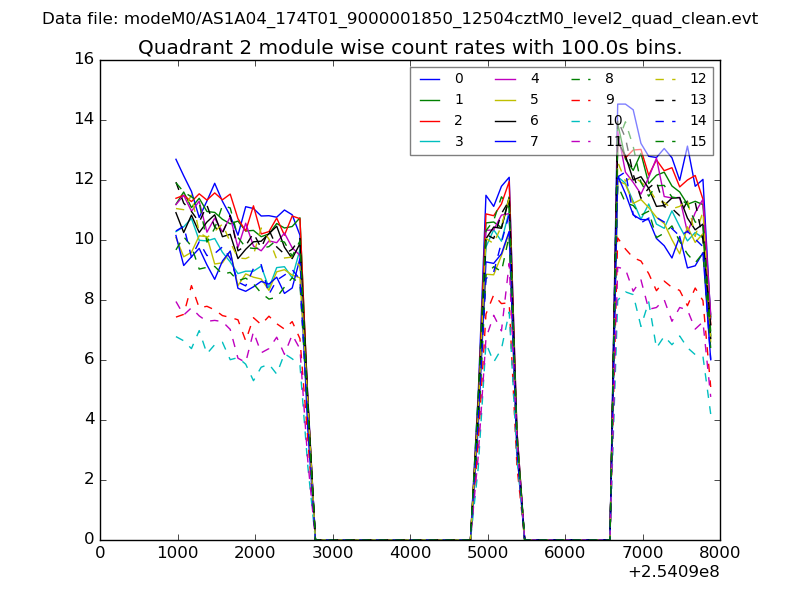
| Module-wise count rates for Quadrant B Data is divided into 100 sec bins |
 |
 |
| Module-wise count rates for Quadrant C Data is divided into 100 sec bins |
 |
 |
| Module-wise count rates for Quadrant D Data is divided into 100 sec bins |
 |
 |
| Parameter | Plot |
|---|---|
| CZT HV Monitor | 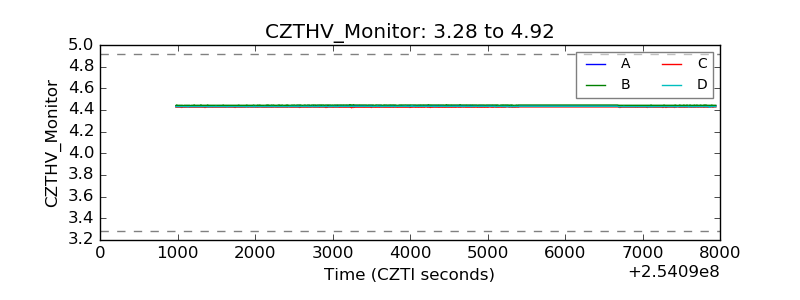 |
| D_VDD | 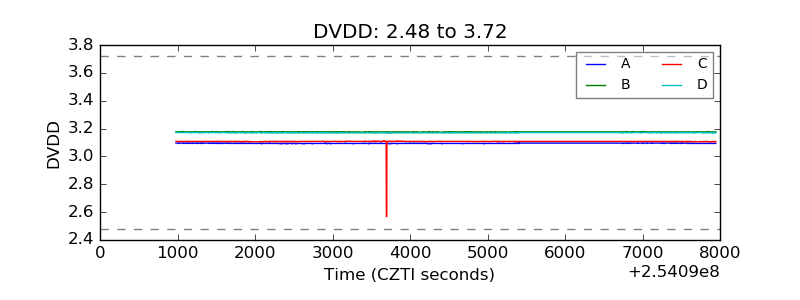 |
| Temperature 1 | 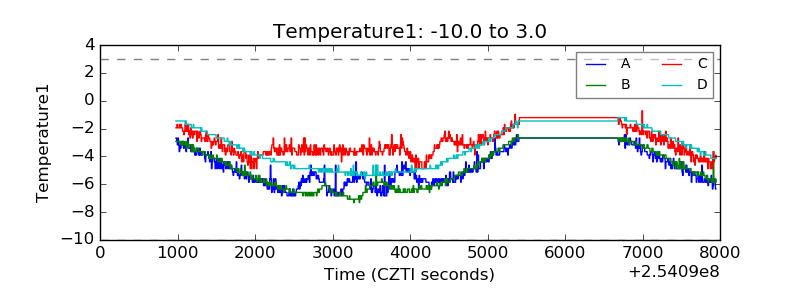 |
| Veto HV Monitor | 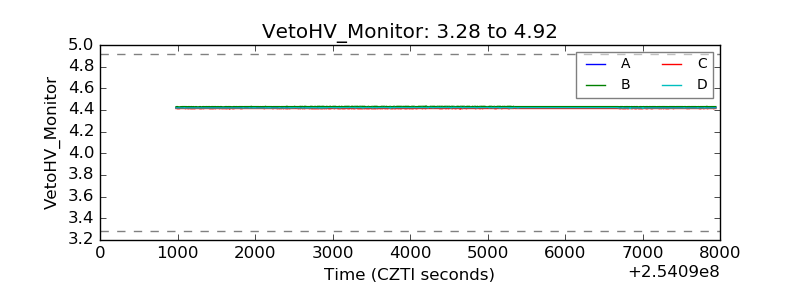 |
| Veto LLD | 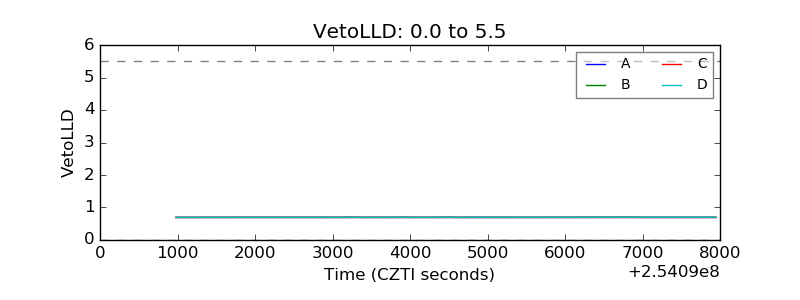 |
| Alpha Counter | 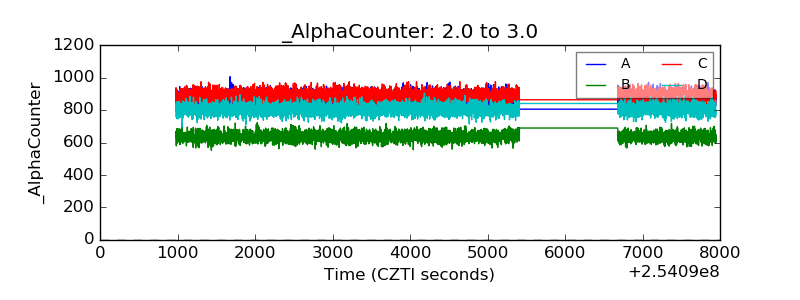 |
| _CPM_Rate | 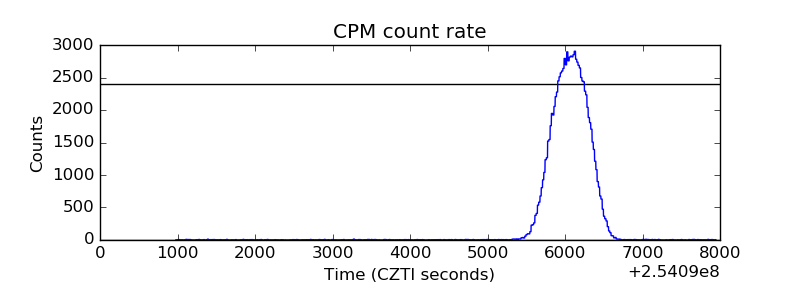 |
| CZT Counter |  |
| +2.5 Volts monitor |  |
| +5 Volts monitor |  |
| _ROLL_ROT | 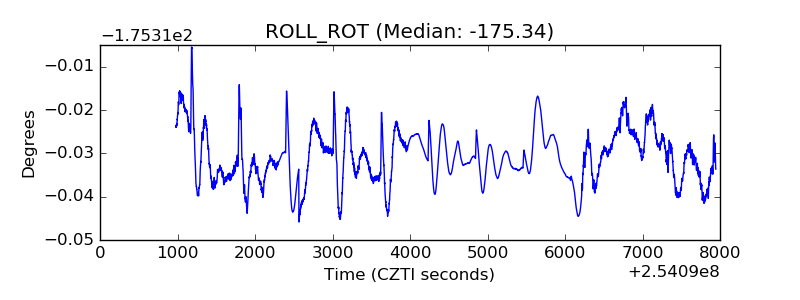 |
| _Roll_DEC | 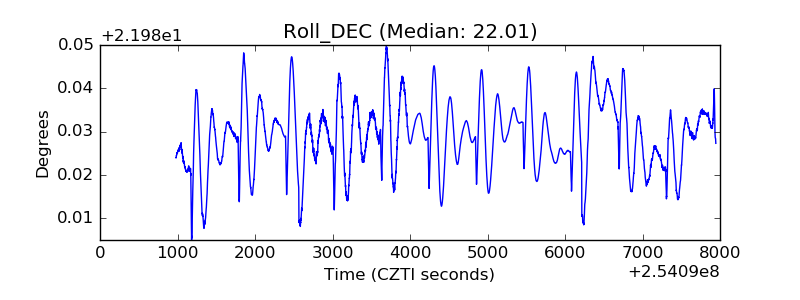 |
| _Roll_RA | 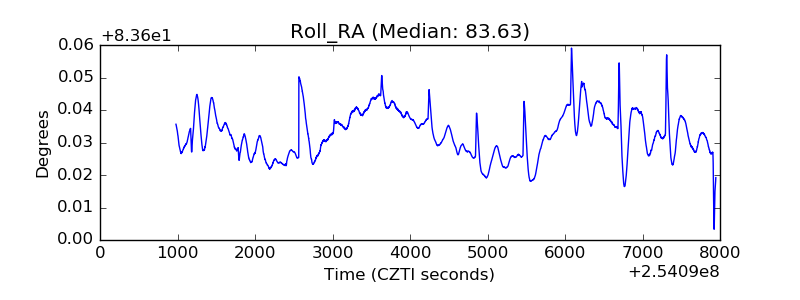 |
| Veto Counter | 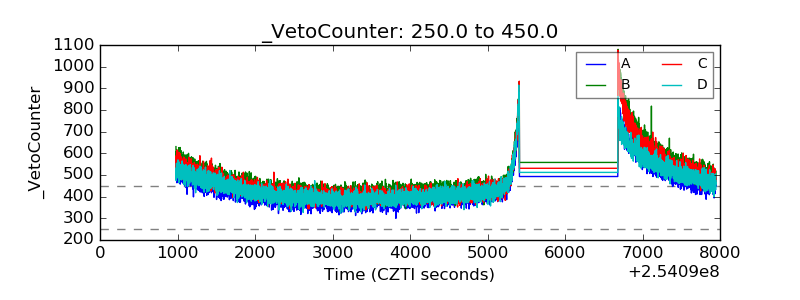 |