| Param | Original file | Final file |
|---|---|---|
| Filename | modeM0/AS1A04_174T01_9000001850_12505cztM0_level2.evt | modeM0/AS1A04_174T01_9000001850_12505cztM0_level2_quad_clean.evt |
| Size (bytes) | 119,073,600 | 32,515,200 |
| Size | 113.6 MB | 31.0 MB |
| Events in quadrant A | 884,309 | 222,176 |
| Events in quadrant B | 881,578 | 229,086 |
| Events in quadrant C | 692,755 | 222,947 |
| Events in quadrant D | 1,049,827 | 205,905 |
| Mode M0 | |||
|---|---|---|---|
| Quadrant | BADHDUFLAG | Total packets | Discarded packets |
| A | 0 | 3603 | 0 |
| B | 0 | 3476 | 0 |
| C | 0 | 2856 | 0 |
| D | 0 | 4041 | 0 |
| Mode SS | |||
|---|---|---|---|
| Quadrant | BADHDUFLAG | Total packets | Discarded packets |
| A | 0 | 28 | 0 |
| B | 0 | 28 | 0 |
| C | 0 | 28 | 0 |
| D | 0 | 28 | 0 |
| Quadrant | Total seconds | Saturated seconds | Saturation percentage |
|---|---|---|---|
| A | 1398 | 7 | 0.500715% |
| B | 1398 | 15 | 1.072961% |
| C | 1398 | 0 | 0.000000% |
| D | 1398 | 35 | 2.503577% |
Noise dominated data is calculated using 1-second bins in cleaned event files. If a bin has >2000 counts, and if more than 50% of those come from <1% of pixels, then it is considered to be noise-dominated and hence unusable.
| Quadrant | # 1 sec bins | Bins with >0 counts | Bins with >2000 counts | High rate bins dominated by noise | Noise dominated (total time) | Noise dominated (detector-on time) | Marked lightcurve |
|---|---|---|---|---|---|---|---|
| A | 1399 | 1399 | 1 | 1 | 0.07% | 0.07% | 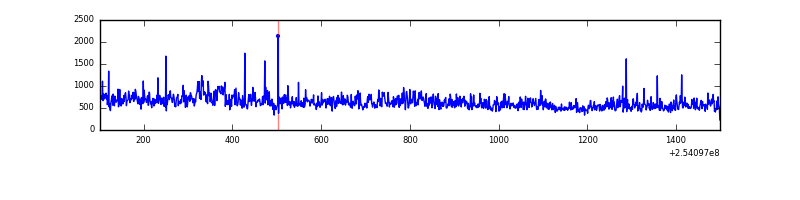 |
| B | 1399 | 1399 | 12 | 12 | 0.86% | 0.86% | 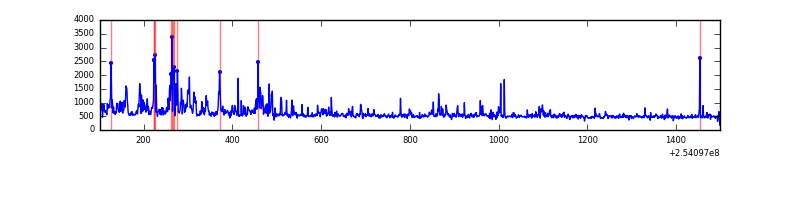 |
| C | 1399 | 1399 | 0 | 0 | 0.00% | 0.00% | 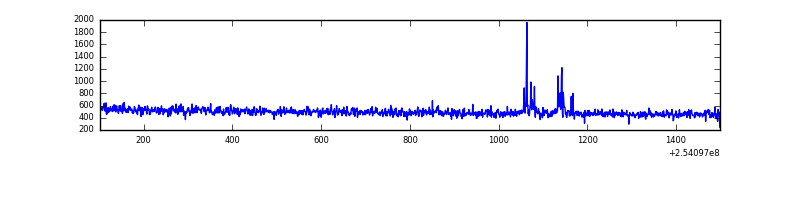 |
| D | 1399 | 1399 | 30 | 30 | 2.14% | 2.14% | 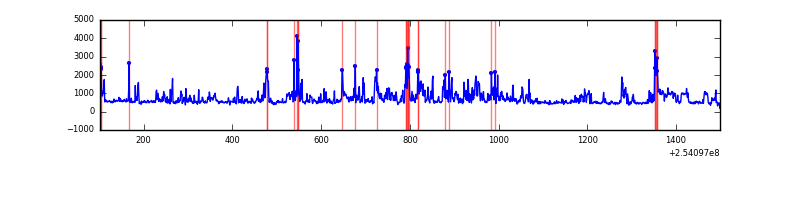 |
Top three noisy pixels from each quadrant. If the there are fewer than three noisy pixels in the level2.evt file, extra rows are filled as -1
| Pixel properties | Quadrant properties | ||||||
|---|---|---|---|---|---|---|---|
| Quadrant | DetID | PixID | Counts | Sigma | Mean | Median | Sigma |
| A | 1 | 162 | 68232 | 1783.54 | 177 | 174 | 38.2 |
| A | 1 | 178 | 40593 | 1059.23 | 177 | 174 | 38.2 |
| A | 1 | 161 | 34368 | 896.09 | 177 | 174 | 38.2 |
| B | 4 | 239 | 148980 | 4146.52 | 180 | 176 | 35.9 |
| B | 11 | 51 | 16764 | 462.24 | 180 | 176 | 35.9 |
| B | 0 | 230 | 7669 | 208.8 | 180 | 176 | 35.9 |
| C | 14 | 234 | 11400 | 265.38 | 174 | 176 | 42.3 |
| C | 13 | 61 | 1365 | 28.11 | 174 | 176 | 42.3 |
| C | 14 | 67 | 595 | 9.91 | 174 | 176 | 42.3 |
| D | 1 | 52 | 249543 | 5771.89 | 169 | 165 | 43.2 |
| D | 13 | 104 | 85637 | 1978.26 | 169 | 165 | 43.2 |
| D | 13 | 249 | 19925 | 457.35 | 169 | 165 | 43.2 |
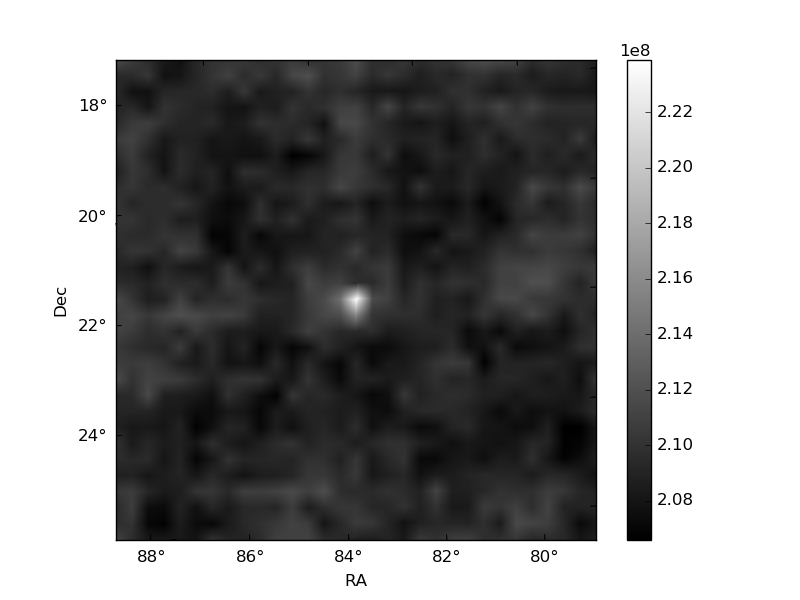
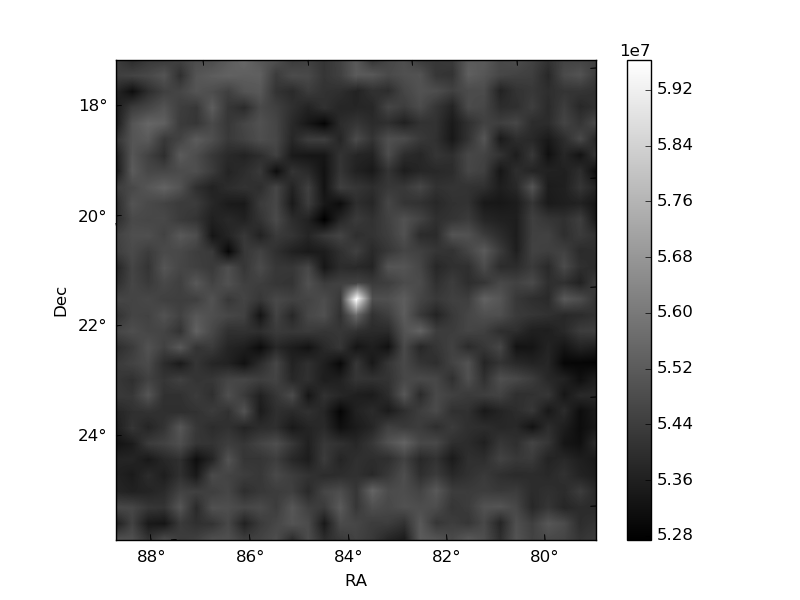
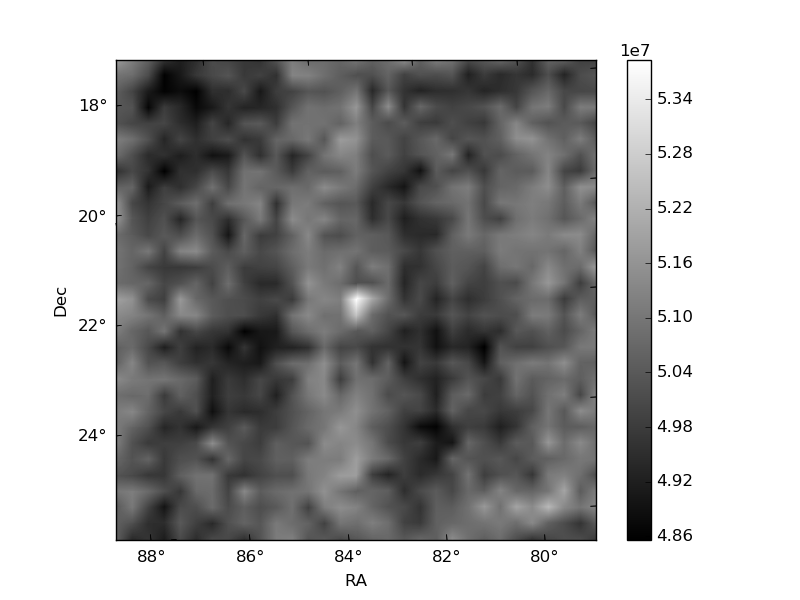
Histogram calculated using DETX and DETY for each event in the final _common_clean file
| Quadrant A | 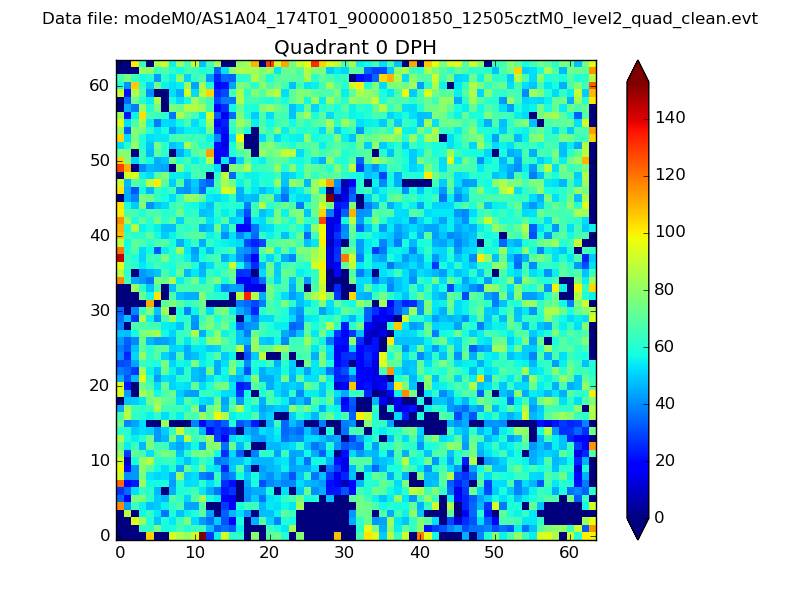 |
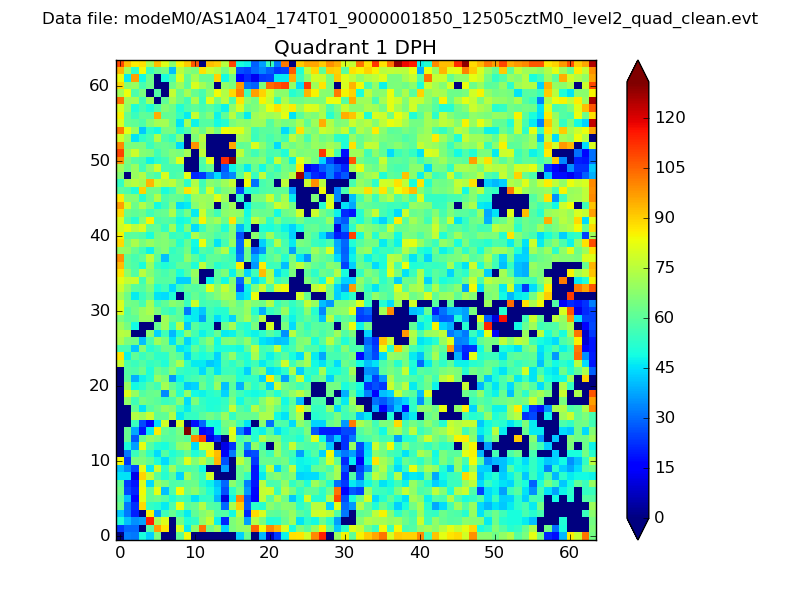 |
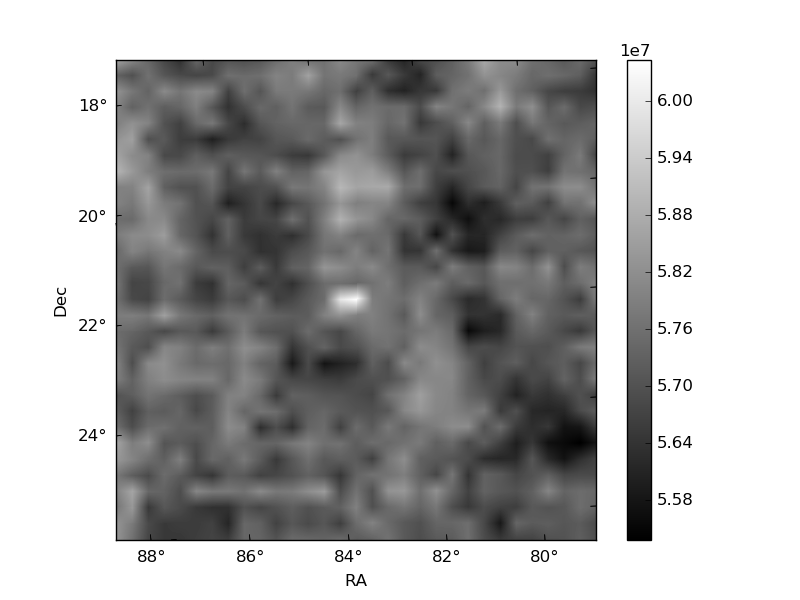
Quadrant B |
|---|---|---|---|
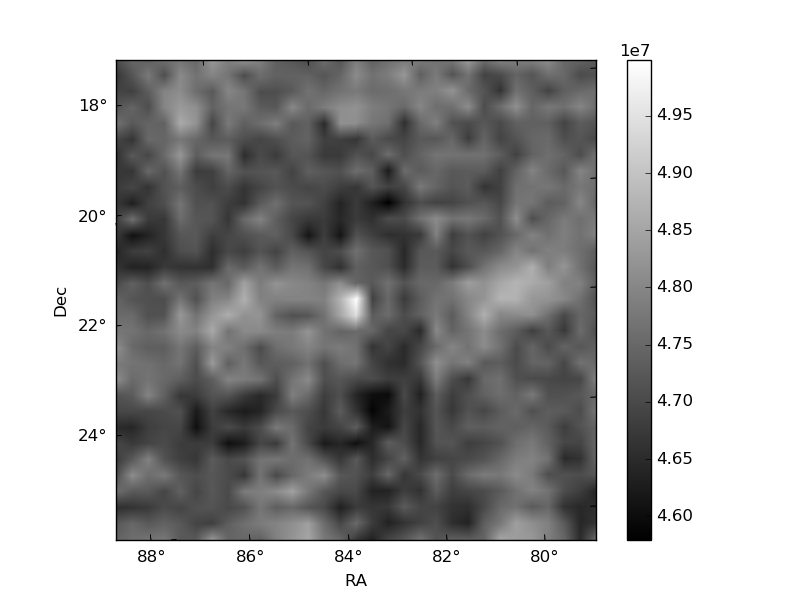
| Quadrant D | 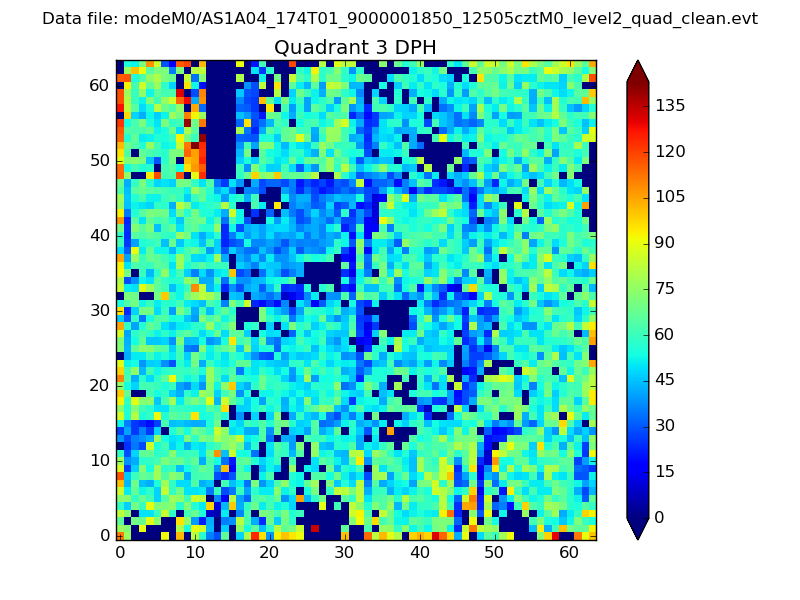 |
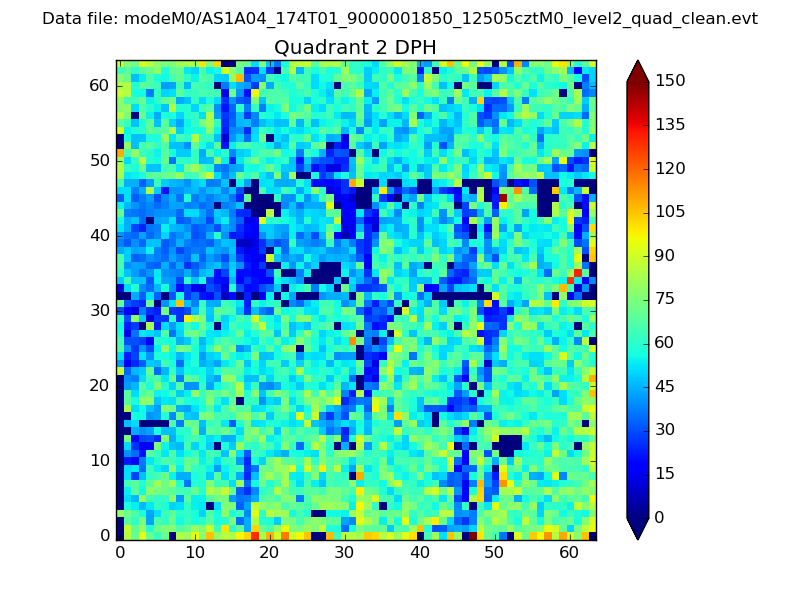 |
Quadrant C |
| Plot type | Count rate plots | Images |
|---|---|---|
| Comparison with Poisson distribution Blue bars denote a histogram of data divided into 1 sec bins. Red curve is a Poisson curve with rate = median count rate of data. |
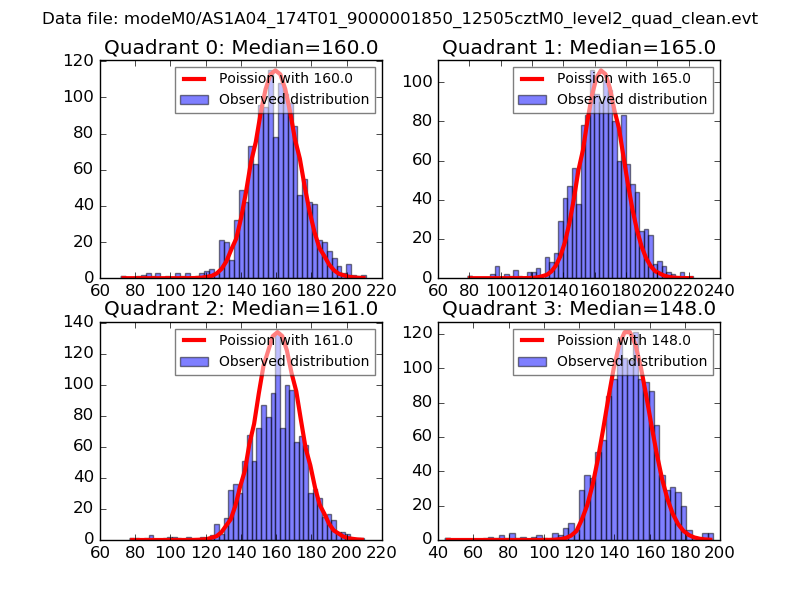 |
 |
| Quadrant-wise count rates Data is divided into 100 sec bins |
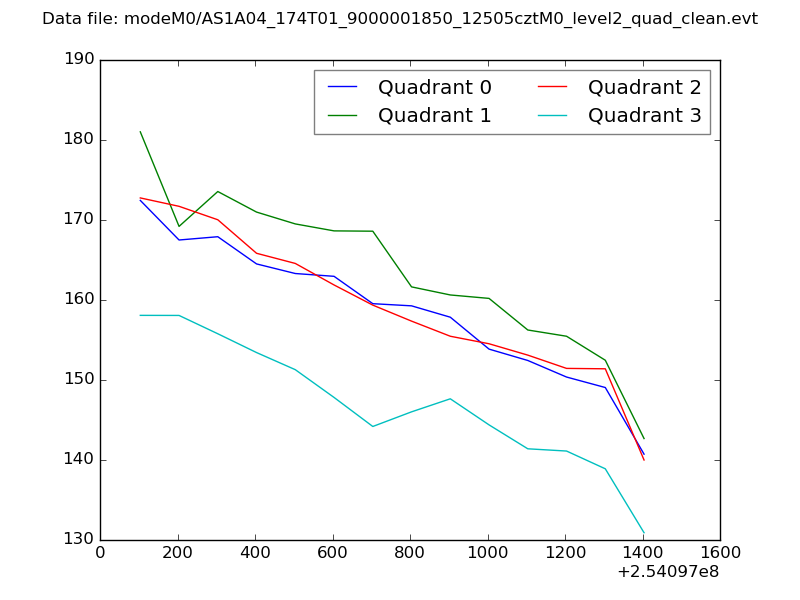 |
|
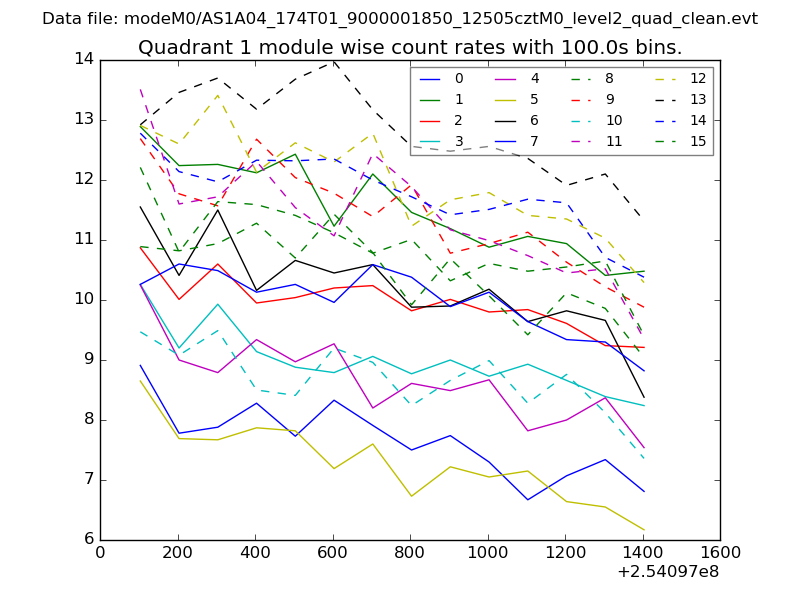
| Module-wise count rates for Quadrant A Data is divided into 100 sec bins |
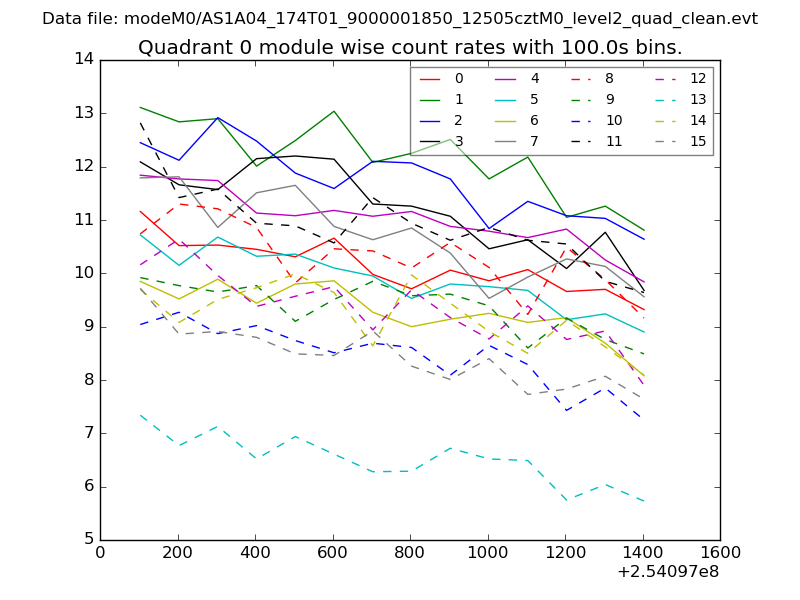 |
 |
| Module-wise count rates for Quadrant B Data is divided into 100 sec bins |
 |
 |
| Module-wise count rates for Quadrant C Data is divided into 100 sec bins |
 |
 |
| Module-wise count rates for Quadrant D Data is divided into 100 sec bins |
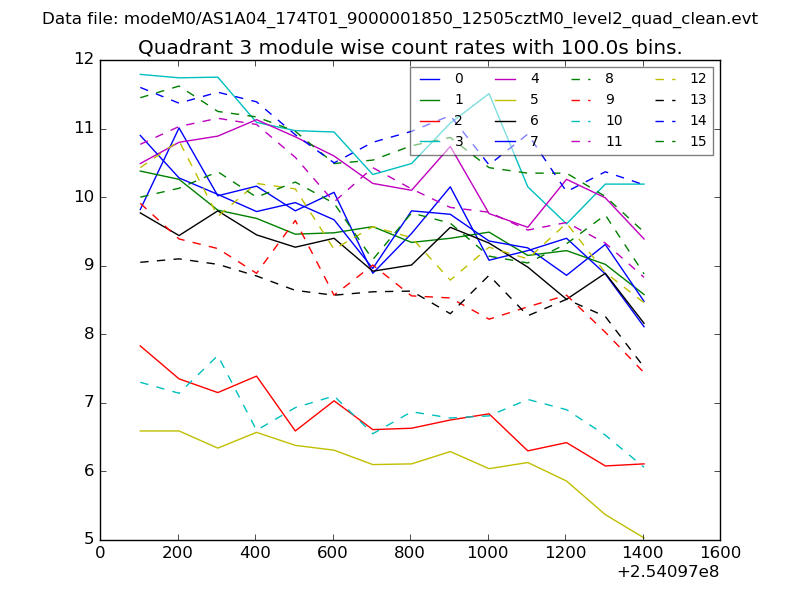 |
 |
| Parameter | Plot |
|---|---|
| CZT HV Monitor |  |
| D_VDD | 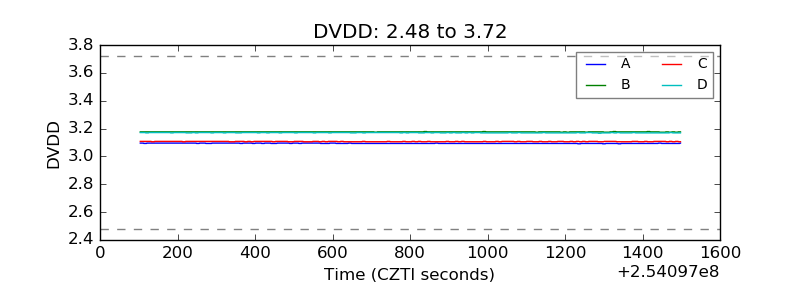 |
| Temperature 1 | 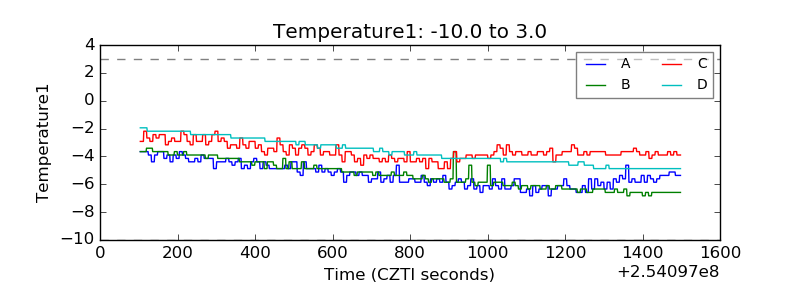 |
| Veto HV Monitor | 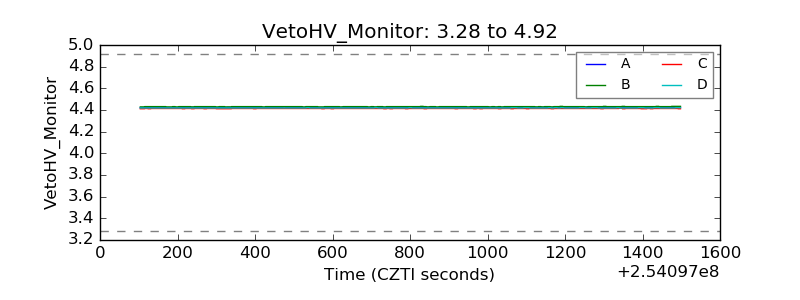 |
| Veto LLD | 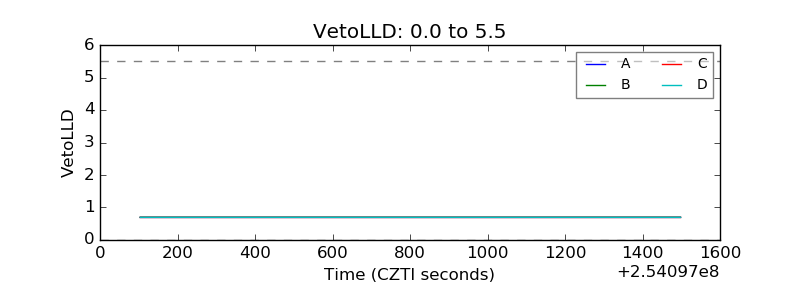 |
| Alpha Counter | 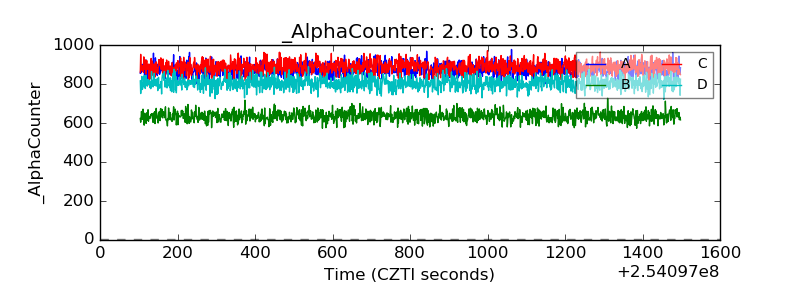 |
| _CPM_Rate | 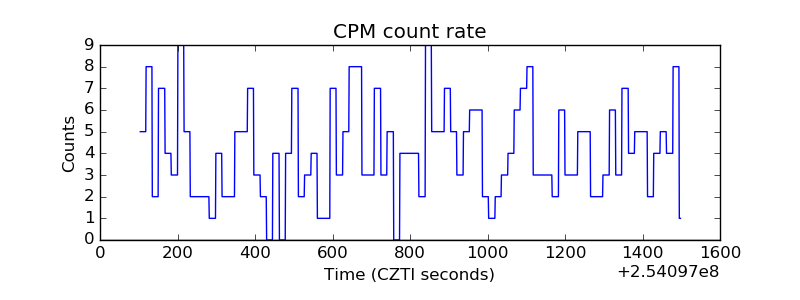 |
| CZT Counter | 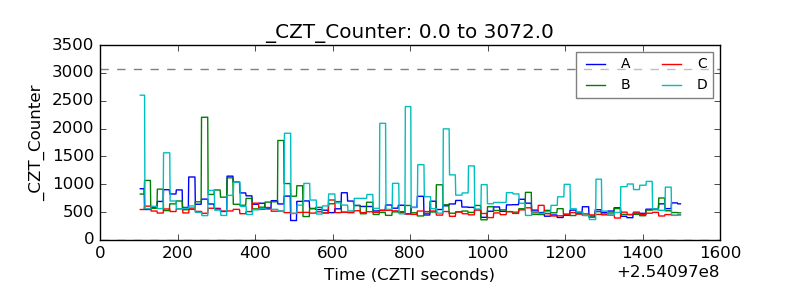 |
| +2.5 Volts monitor |  |
| +5 Volts monitor |  |
| _ROLL_ROT | 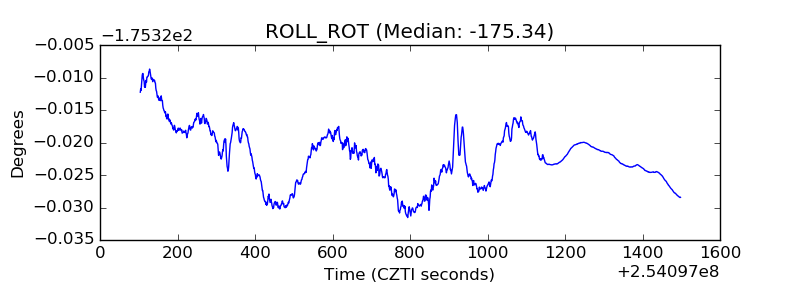 |
| _Roll_DEC | 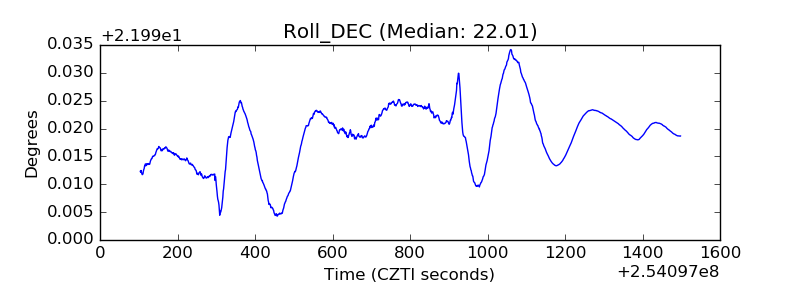 |
| _Roll_RA | 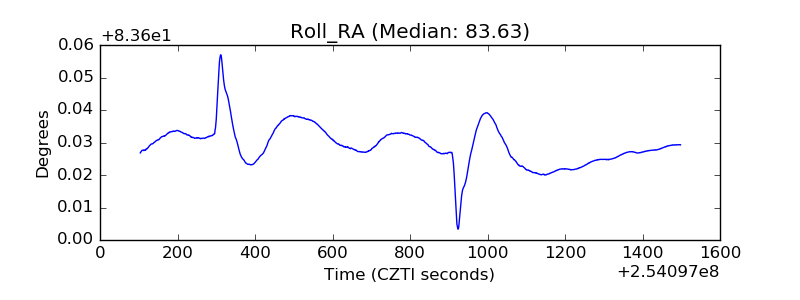 |
| Veto Counter | 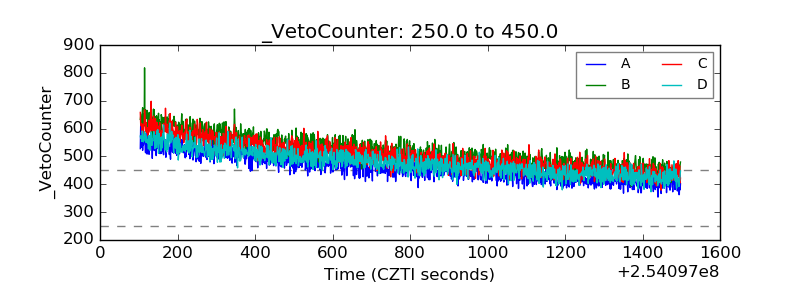 |